Zip Codes with the Highest Percentage of Population Employed in Office & Administration in Weatherford, TX
RELATED REPORTS & OPTIONS
Office & Administration
Weatherford
Compare Zip Codes
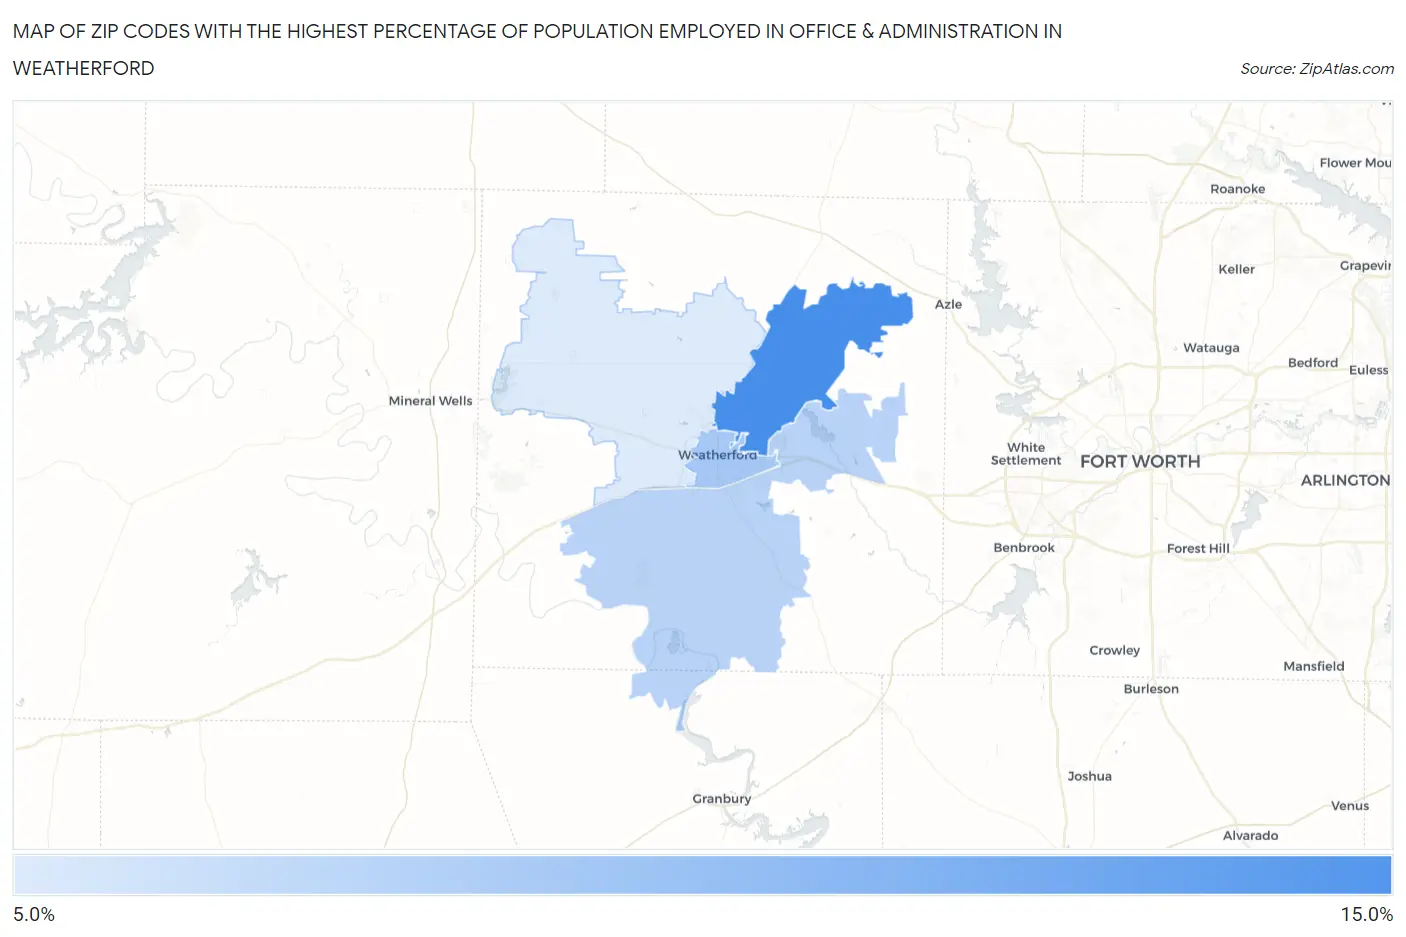
Map of Zip Codes with the Highest Percentage of Population Employed in Office & Administration in Weatherford
0.0%
15.0%
Zip Codes with the Highest Percentage of Population Employed in Office & Administration in Weatherford, TX
| Zip Code | % Employed | vs State | vs National | |
| 1. | 76085 | 14.5% | 11.0%(+3.56)#319 | 10.9%(+3.68)#5,206 |
| 2. | 76086 | 9.8% | 11.0%(-1.15)#1,080 | 10.9%(-1.03)#17,681 |
| 3. | 76087 | 8.9% | 11.0%(-2.05)#1,229 | 10.9%(-1.93)#20,476 |
| 4. | 76088 | 7.2% | 11.0%(-3.81)#1,474 | 10.9%(-3.70)#24,903 |
1
Common Questions
What are the Top 3 Zip Codes with the Highest Percentage of Population Employed in Office & Administration in Weatherford, TX?
Top 3 Zip Codes with the Highest Percentage of Population Employed in Office & Administration in Weatherford, TX are:
What zip code has the Highest Percentage of Population Employed in Office & Administration in Weatherford, TX?
76085 has the Highest Percentage of Population Employed in Office & Administration in Weatherford, TX with 14.5%.
What is the Percentage of Population Employed in Office & Administration in Weatherford, TX?
Percentage of Population Employed in Office & Administration in Weatherford is 9.7%.
What is the Percentage of Population Employed in Office & Administration in Texas?
Percentage of Population Employed in Office & Administration in Texas is 11.0%.
What is the Percentage of Population Employed in Office & Administration in the United States?
Percentage of Population Employed in Office & Administration in the United States is 10.9%.