Zip Codes with the Highest Percentage of Local Government Employees in Weatherford, TX
RELATED REPORTS & OPTIONS
Local Government Employees
Weatherford
Compare Zip Codes
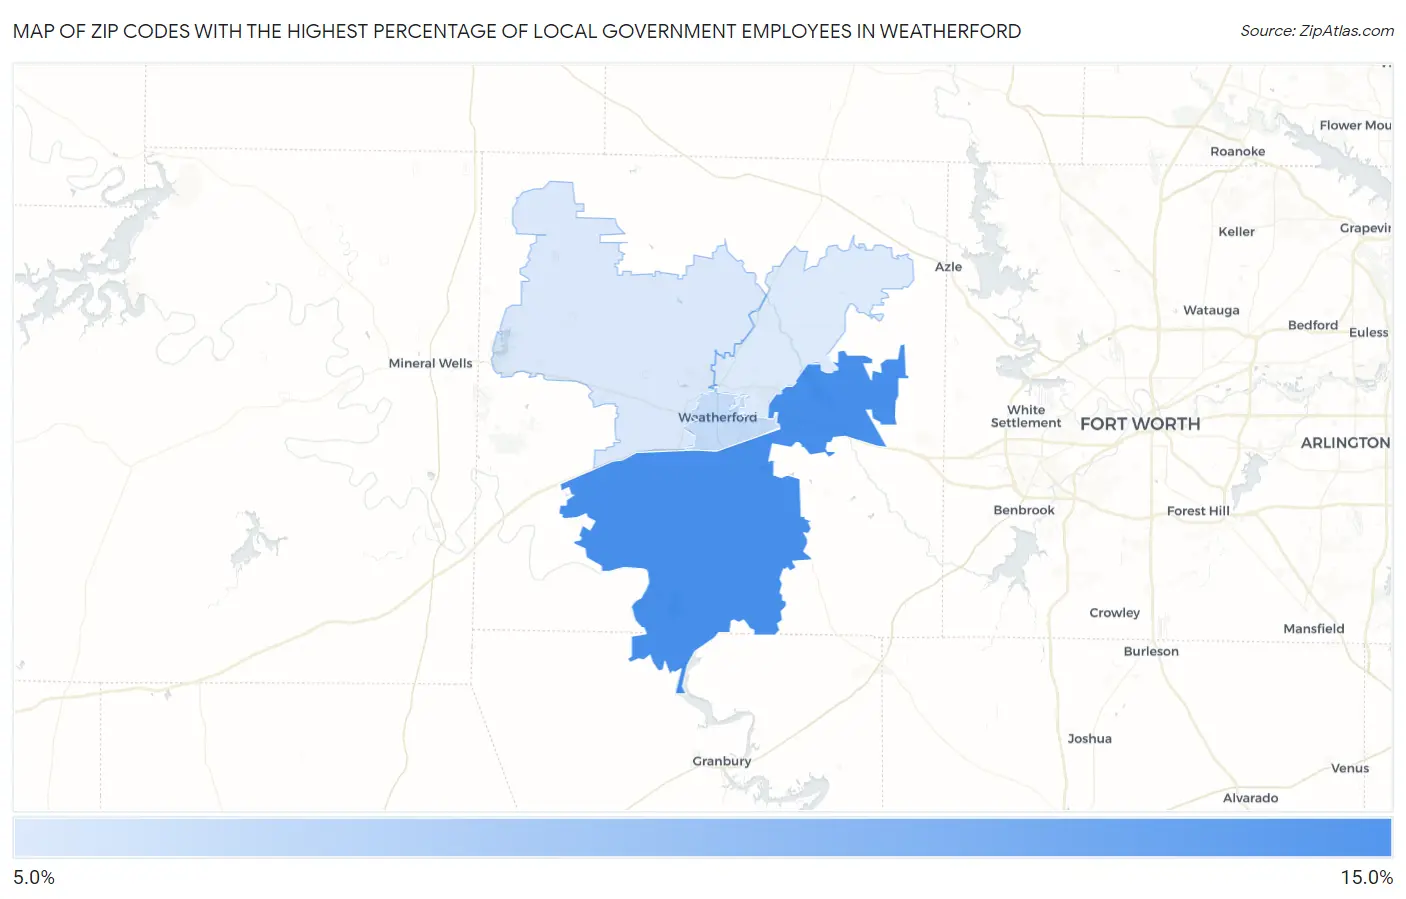
Map of Zip Codes with the Highest Percentage of Local Government Employees in Weatherford
0.0%
15.0%
Zip Codes with the Highest Percentage of Local Government Employees in Weatherford, TX
| Zip Code | % Local Government Employees | vs State | vs National | |
| 1. | 76087 | 13.7% | 7.2%(+6.49)#254 | 7.2%(+6.51)#3,737 |
| 2. | 76086 | 7.7% | 7.2%(+0.480)#905 | 7.2%(+0.499)#14,017 |
| 3. | 76088 | 6.6% | 7.2%(-0.609)#1,110 | 7.2%(-0.590)#17,618 |
| 4. | 76085 | 6.5% | 7.2%(-0.766)#1,143 | 7.2%(-0.747)#18,193 |
1
Common Questions
What are the Top 3 Zip Codes with the Highest Percentage of Local Government Employees in Weatherford, TX?
Top 3 Zip Codes with the Highest Percentage of Local Government Employees in Weatherford, TX are:
What zip code has the Highest Percentage of Local Government Employees in Weatherford, TX?
76087 has the Highest Percentage of Local Government Employees in Weatherford, TX with 13.7%.
What is the Percentage of Local Government Employees in Weatherford, TX?
Percentage of Local Government Employees in Weatherford is 9.0%.
What is the Percentage of Local Government Employees in Texas?
Percentage of Local Government Employees in Texas is 7.2%.
What is the Percentage of Local Government Employees in the United States?
Percentage of Local Government Employees in the United States is 7.2%.