Zip Codes with the Highest Percentage of Population Employed in Installation, Maintenance & Repair in Richmond, TX
RELATED REPORTS & OPTIONS
Installation, Maintenance & Repair
Richmond
Compare Zip Codes
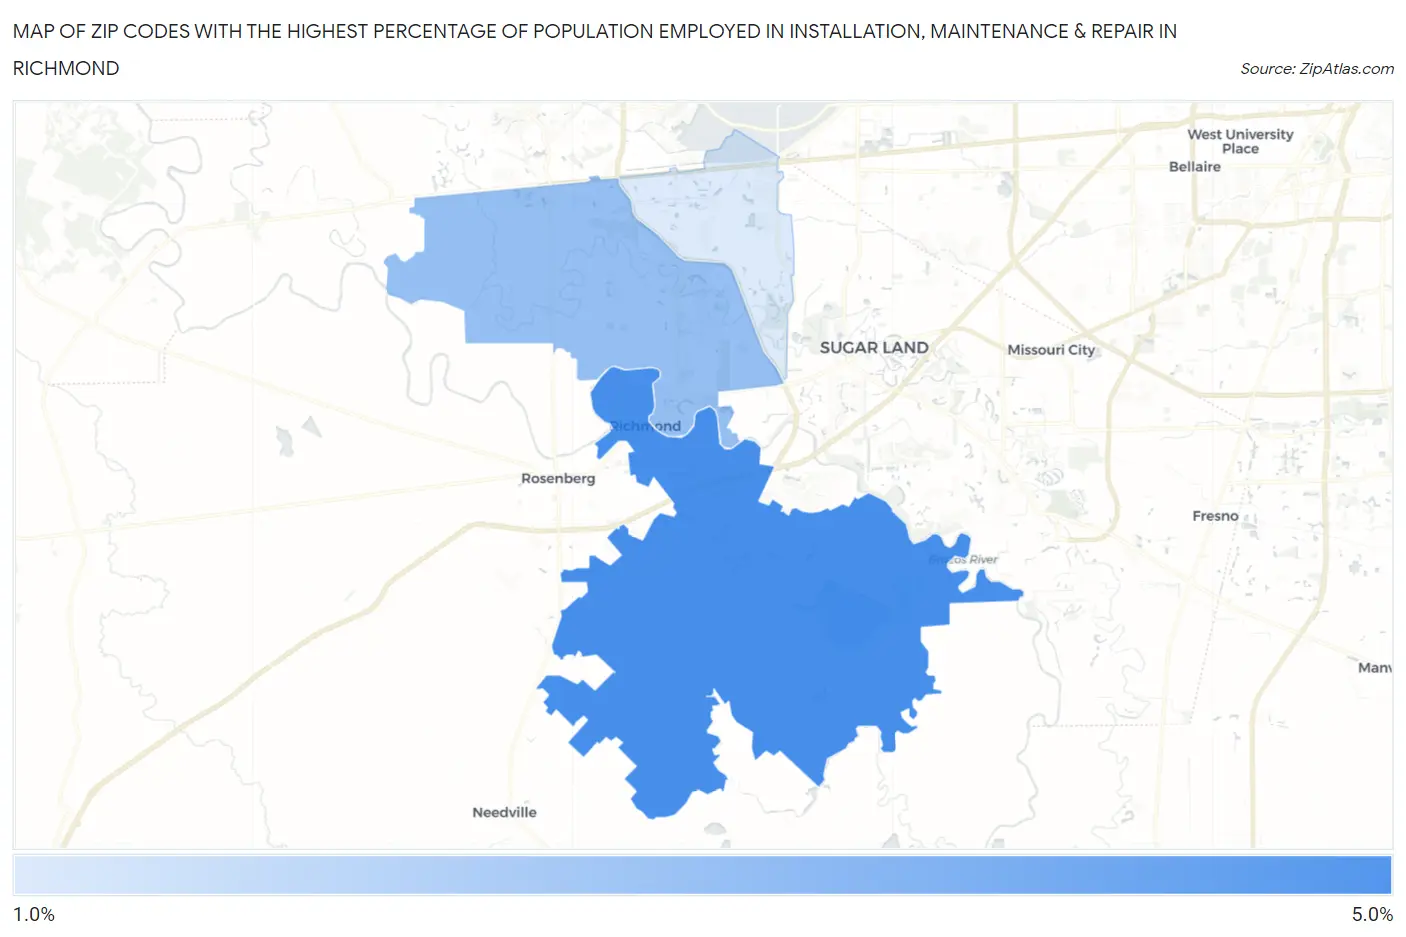
Map of Zip Codes with the Highest Percentage of Population Employed in Installation, Maintenance & Repair in Richmond
0.0%
5.0%
Zip Codes with the Highest Percentage of Population Employed in Installation, Maintenance & Repair in Richmond, TX
| Zip Code | % Employed | vs State | vs National | |
| 1. | 77469 | 4.5% | 3.4%(+1.05)#648 | 3.1%(+1.39)#10,582 |
| 2. | 77406 | 3.0% | 3.4%(-0.374)#1,054 | 3.1%(-0.038)#16,846 |
| 3. | 77407 | 1.7% | 3.4%(-1.68)#1,407 | 3.1%(-1.34)#23,235 |
1
Common Questions
What are the Top Zip Codes with the Highest Percentage of Population Employed in Installation, Maintenance & Repair in Richmond, TX?
Top Zip Codes with the Highest Percentage of Population Employed in Installation, Maintenance & Repair in Richmond, TX are:
What zip code has the Highest Percentage of Population Employed in Installation, Maintenance & Repair in Richmond, TX?
77469 has the Highest Percentage of Population Employed in Installation, Maintenance & Repair in Richmond, TX with 4.5%.
What is the Percentage of Population Employed in Installation, Maintenance & Repair in Richmond, TX?
Percentage of Population Employed in Installation, Maintenance & Repair in Richmond is 5.7%.
What is the Percentage of Population Employed in Installation, Maintenance & Repair in Texas?
Percentage of Population Employed in Installation, Maintenance & Repair in Texas is 3.4%.
What is the Percentage of Population Employed in Installation, Maintenance & Repair in the United States?
Percentage of Population Employed in Installation, Maintenance & Repair in the United States is 3.1%.