Zip Codes with the Highest Percentage of Population Employed in Legal Services & Support in Richmond, TX
RELATED REPORTS & OPTIONS
Legal Services & Support
Richmond
Compare Zip Codes
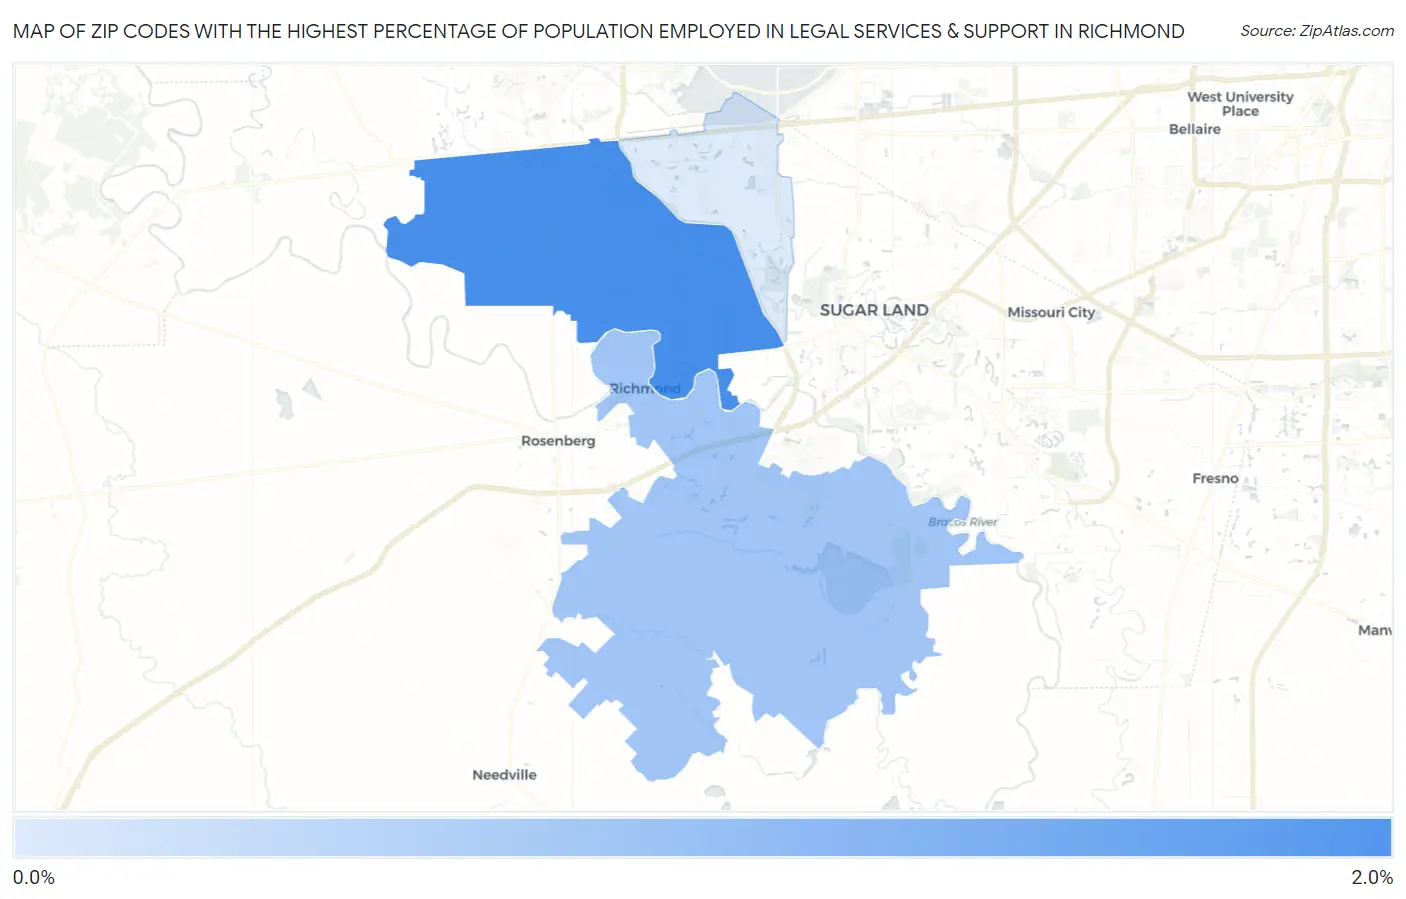
Map of Zip Codes with the Highest Percentage of Population Employed in Legal Services & Support in Richmond
0.0%
2.0%
Zip Codes with the Highest Percentage of Population Employed in Legal Services & Support in Richmond, TX
| Zip Code | % Employed | vs State | vs National | |
| 1. | 77406 | 1.7% | 1.0%(+0.715)#230 | 1.2%(+0.540)#4,235 |
| 2. | 77469 | 0.80% | 1.0%(-0.207)#524 | 1.2%(-0.382)#9,422 |
| 3. | 77407 | 0.21% | 1.0%(-0.799)#994 | 1.2%(-0.975)#16,102 |
1
Common Questions
What are the Top Zip Codes with the Highest Percentage of Population Employed in Legal Services & Support in Richmond, TX?
Top Zip Codes with the Highest Percentage of Population Employed in Legal Services & Support in Richmond, TX are:
What zip code has the Highest Percentage of Population Employed in Legal Services & Support in Richmond, TX?
77406 has the Highest Percentage of Population Employed in Legal Services & Support in Richmond, TX with 1.7%.
What is the Percentage of Population Employed in Legal Services & Support in Richmond, TX?
Percentage of Population Employed in Legal Services & Support in Richmond is 0.70%.
What is the Percentage of Population Employed in Legal Services & Support in Texas?
Percentage of Population Employed in Legal Services & Support in Texas is 1.0%.
What is the Percentage of Population Employed in Legal Services & Support in the United States?
Percentage of Population Employed in Legal Services & Support in the United States is 1.2%.