Zip Codes with the Highest Percentage of Population Employed in Architecture & Engineering in Richmond, TX
RELATED REPORTS & OPTIONS
Architecture & Engineering
Richmond
Compare Zip Codes
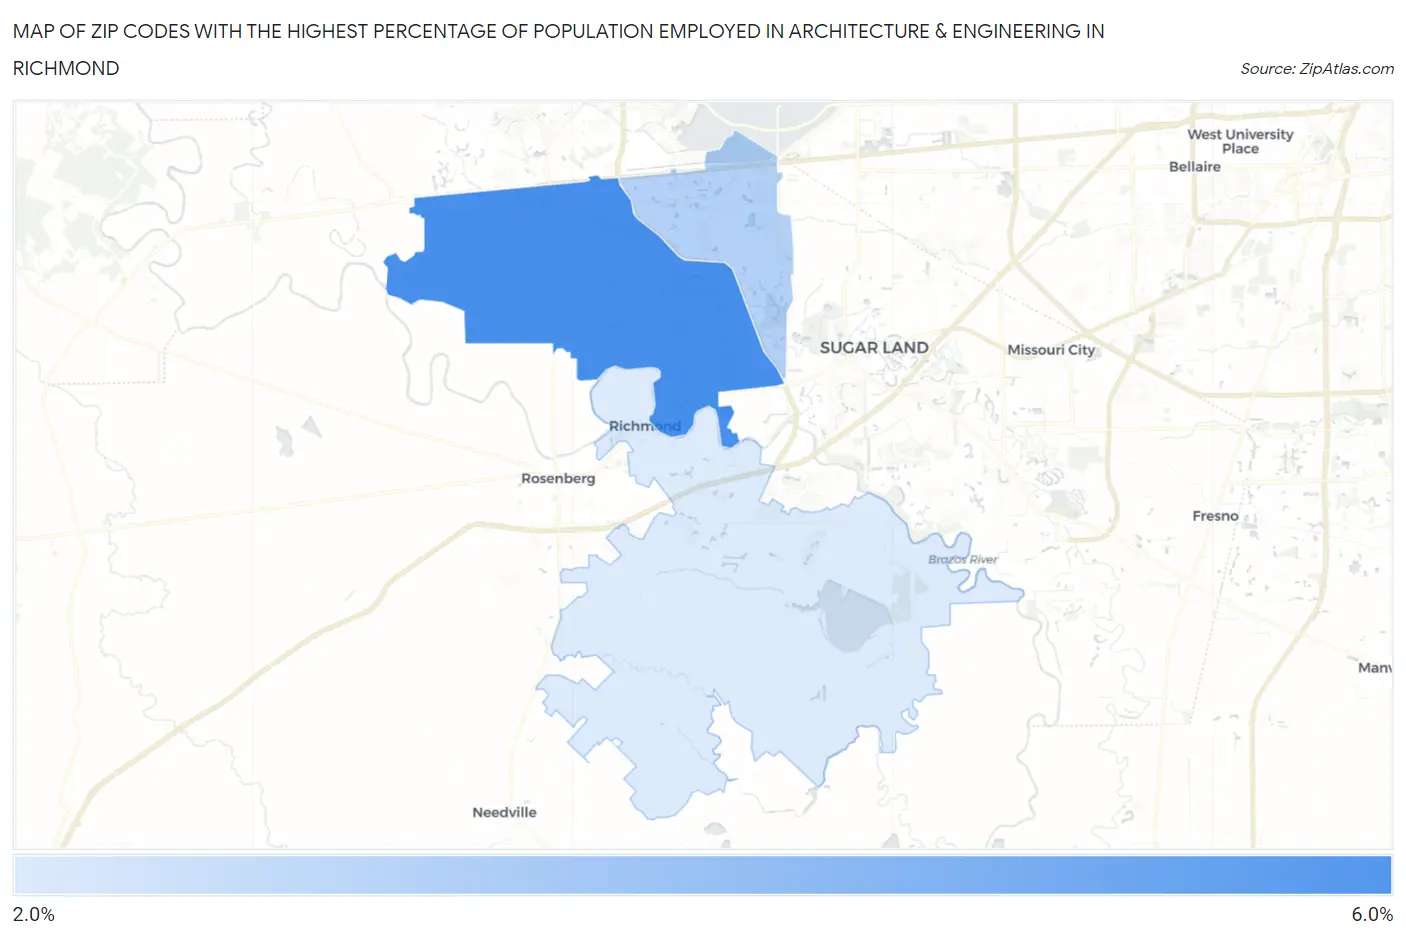
Map of Zip Codes with the Highest Percentage of Population Employed in Architecture & Engineering in Richmond
0.0%
6.0%
Zip Codes with the Highest Percentage of Population Employed in Architecture & Engineering in Richmond, TX
| Zip Code | % Employed | vs State | vs National | |
| 1. | 77406 | 5.9% | 2.2%(+3.66)#62 | 2.1%(+3.73)#1,144 |
| 2. | 77407 | 3.7% | 2.2%(+1.45)#185 | 2.1%(+1.52)#3,354 |
| 3. | 77469 | 2.8% | 2.2%(+0.626)#323 | 2.1%(+0.699)#5,592 |
1
Common Questions
What are the Top Zip Codes with the Highest Percentage of Population Employed in Architecture & Engineering in Richmond, TX?
Top Zip Codes with the Highest Percentage of Population Employed in Architecture & Engineering in Richmond, TX are:
What zip code has the Highest Percentage of Population Employed in Architecture & Engineering in Richmond, TX?
77406 has the Highest Percentage of Population Employed in Architecture & Engineering in Richmond, TX with 5.9%.
What is the Percentage of Population Employed in Architecture & Engineering in Richmond, TX?
Percentage of Population Employed in Architecture & Engineering in Richmond is 0.47%.
What is the Percentage of Population Employed in Architecture & Engineering in Texas?
Percentage of Population Employed in Architecture & Engineering in Texas is 2.2%.
What is the Percentage of Population Employed in Architecture & Engineering in the United States?
Percentage of Population Employed in Architecture & Engineering in the United States is 2.1%.