Zip Codes with the Highest Percentage of Population Employed in Legal Services & Support in Orange, TX
RELATED REPORTS & OPTIONS
Legal Services & Support
Orange
Compare Zip Codes
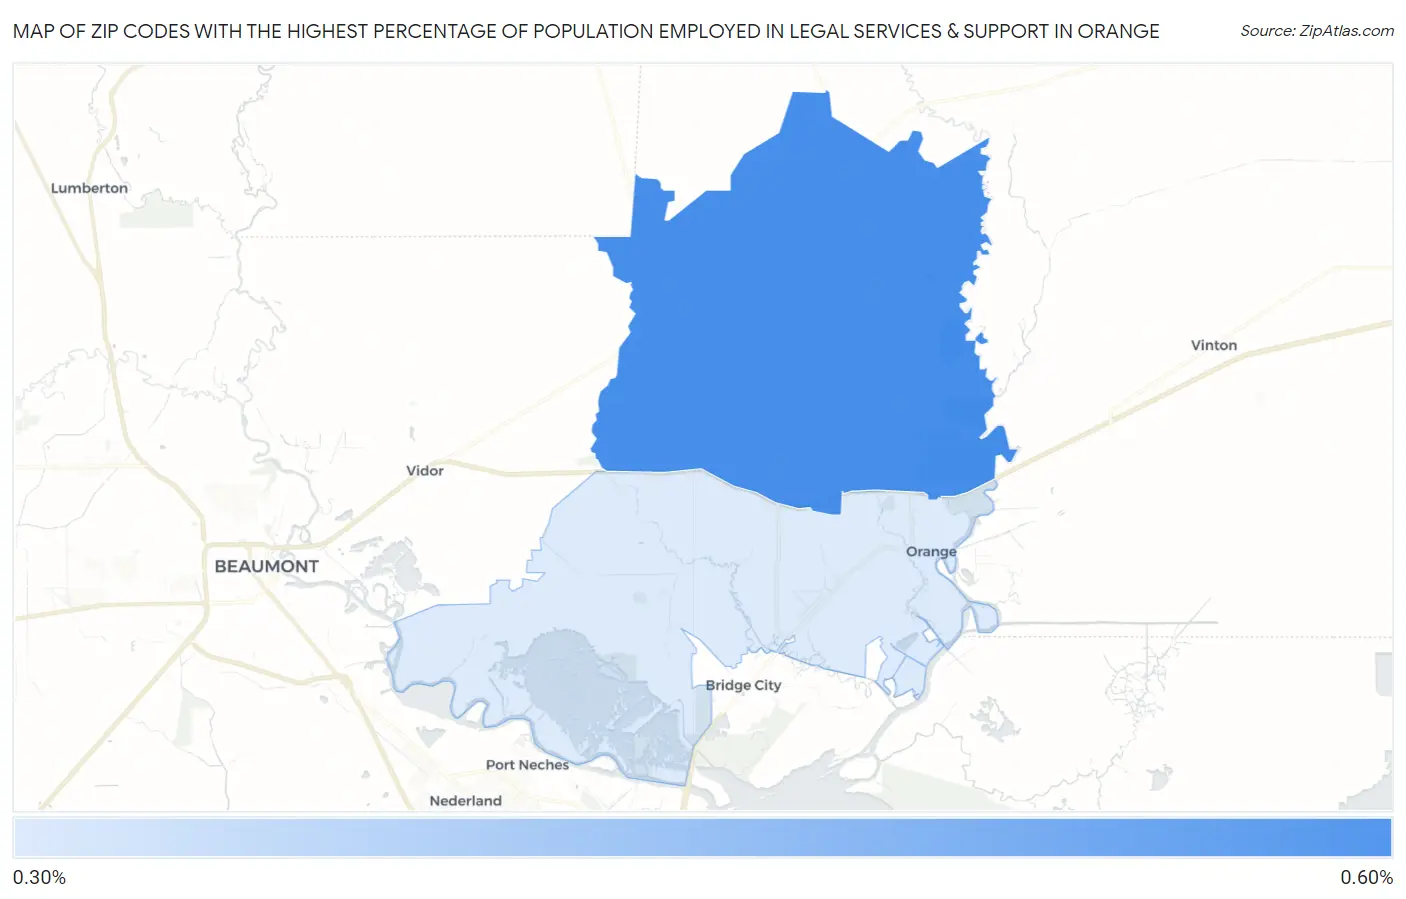
Map of Zip Codes with the Highest Percentage of Population Employed in Legal Services & Support in Orange
0.0%
0.60%
Zip Codes with the Highest Percentage of Population Employed in Legal Services & Support in Orange, TX
| Zip Code | % Employed | vs State | vs National | |
| 1. | 77632 | 0.54% | 1.0%(-0.468)#716 | 1.2%(-0.644)#12,157 |
| 2. | 77630 | 0.35% | 1.0%(-0.658)#885 | 1.2%(-0.833)#14,455 |
1
Common Questions
What are the Top Zip Codes with the Highest Percentage of Population Employed in Legal Services & Support in Orange, TX?
Top Zip Codes with the Highest Percentage of Population Employed in Legal Services & Support in Orange, TX are:
What zip code has the Highest Percentage of Population Employed in Legal Services & Support in Orange, TX?
77632 has the Highest Percentage of Population Employed in Legal Services & Support in Orange, TX with 0.54%.
What is the Percentage of Population Employed in Legal Services & Support in Orange, TX?
Percentage of Population Employed in Legal Services & Support in Orange is 0.26%.
What is the Percentage of Population Employed in Legal Services & Support in Texas?
Percentage of Population Employed in Legal Services & Support in Texas is 1.0%.
What is the Percentage of Population Employed in Legal Services & Support in the United States?
Percentage of Population Employed in Legal Services & Support in the United States is 1.2%.