Zip Codes with the Highest Percentage of Population Employed in Architecture & Engineering in Orange, TX
RELATED REPORTS & OPTIONS
Architecture & Engineering
Orange
Compare Zip Codes
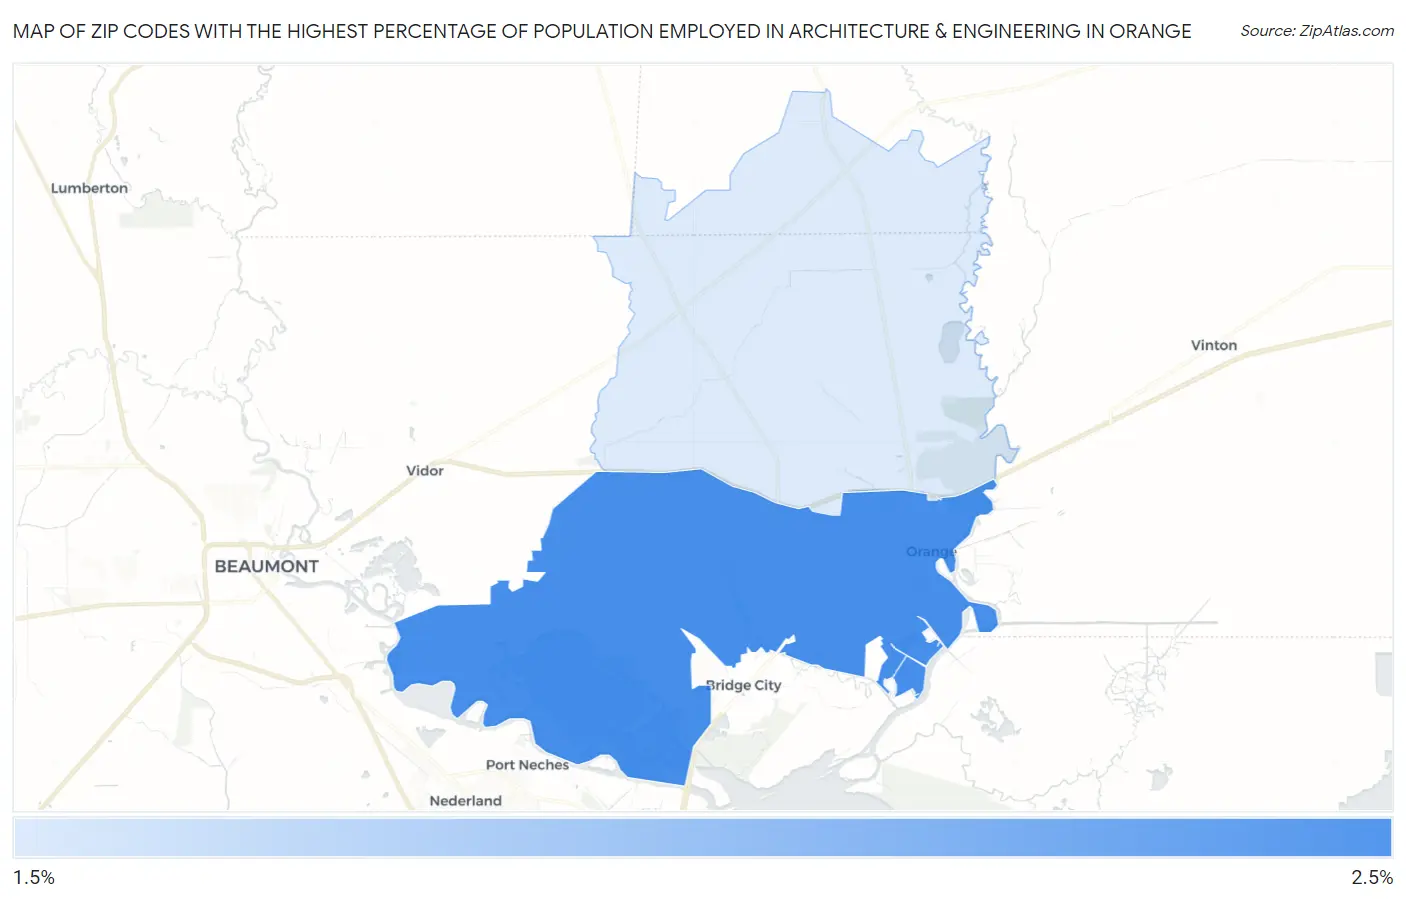
Map of Zip Codes with the Highest Percentage of Population Employed in Architecture & Engineering in Orange
0.0%
2.5%
Zip Codes with the Highest Percentage of Population Employed in Architecture & Engineering in Orange, TX
| Zip Code | % Employed | vs State | vs National | |
| 1. | 77630 | 2.4% | 2.2%(+0.182)#409 | 2.1%(+0.255)#7,463 |
| 2. | 77632 | 2.0% | 2.2%(-0.250)#534 | 2.1%(-0.177)#9,788 |
1
Common Questions
What are the Top Zip Codes with the Highest Percentage of Population Employed in Architecture & Engineering in Orange, TX?
Top Zip Codes with the Highest Percentage of Population Employed in Architecture & Engineering in Orange, TX are:
What zip code has the Highest Percentage of Population Employed in Architecture & Engineering in Orange, TX?
77630 has the Highest Percentage of Population Employed in Architecture & Engineering in Orange, TX with 2.4%.
What is the Percentage of Population Employed in Architecture & Engineering in Orange, TX?
Percentage of Population Employed in Architecture & Engineering in Orange is 0.36%.
What is the Percentage of Population Employed in Architecture & Engineering in Texas?
Percentage of Population Employed in Architecture & Engineering in Texas is 2.2%.
What is the Percentage of Population Employed in Architecture & Engineering in the United States?
Percentage of Population Employed in Architecture & Engineering in the United States is 2.1%.