Zip Codes with the Highest Percentage of Population Employed in Life, Physical & Social Science in Orange, TX
RELATED REPORTS & OPTIONS
Life, Physical & Social Science
Orange
Compare Zip Codes
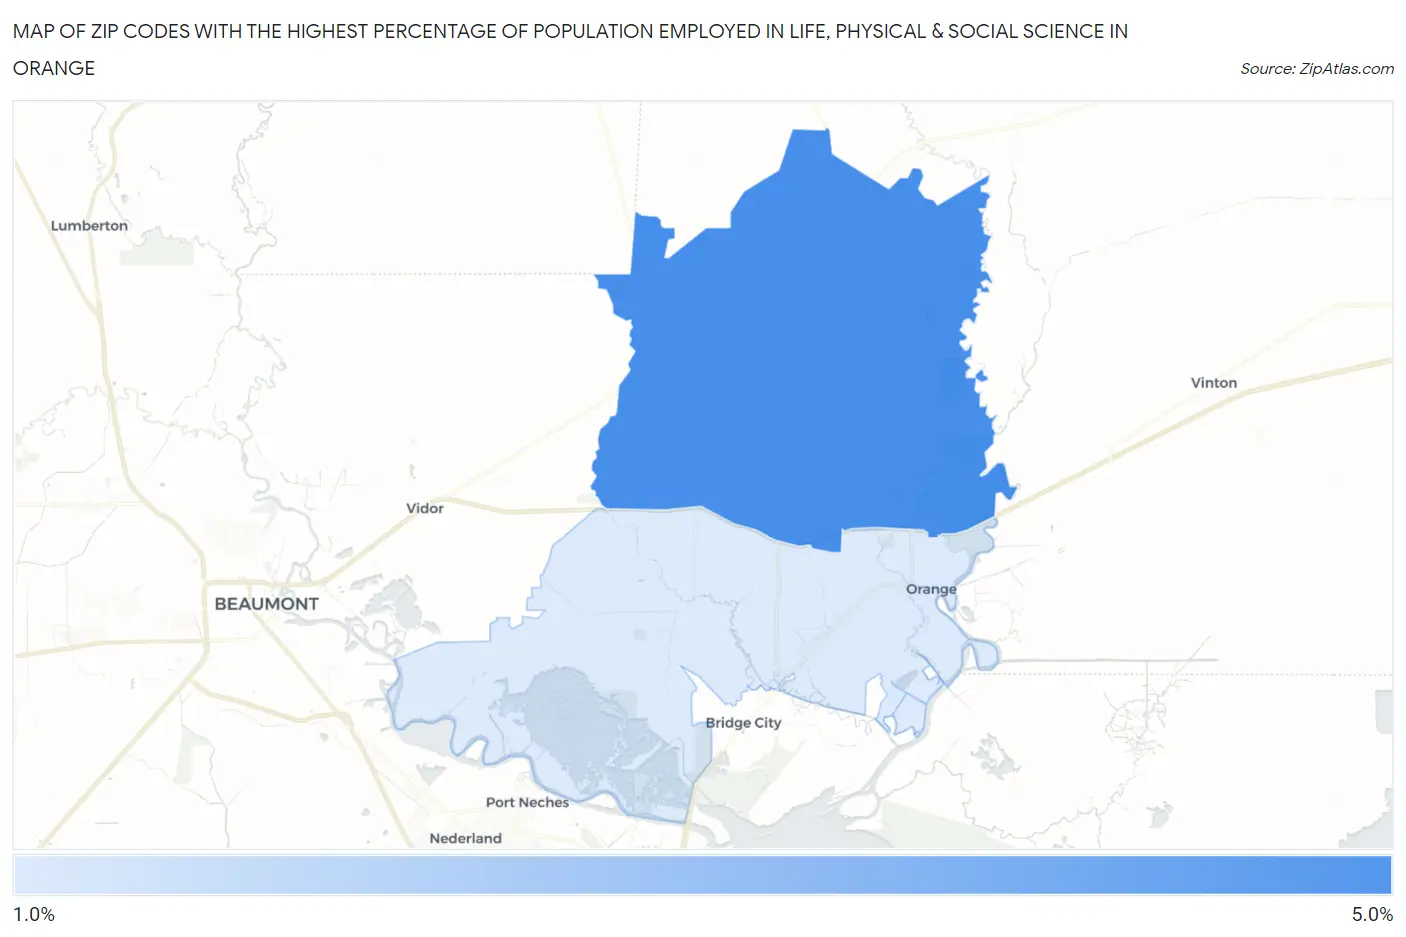
Map of Zip Codes with the Highest Percentage of Population Employed in Life, Physical & Social Science in Orange
0.0%
5.0%
Zip Codes with the Highest Percentage of Population Employed in Life, Physical & Social Science in Orange, TX
| Zip Code | % Employed | vs State | vs National | |
| 1. | 77632 | 4.2% | 0.84%(+3.39)#34 | 1.1%(+3.14)#1,033 |
| 2. | 77630 | 1.9% | 0.84%(+1.10)#134 | 1.1%(+0.849)#3,859 |
1
Common Questions
What are the Top Zip Codes with the Highest Percentage of Population Employed in Life, Physical & Social Science in Orange, TX?
Top Zip Codes with the Highest Percentage of Population Employed in Life, Physical & Social Science in Orange, TX are:
What zip code has the Highest Percentage of Population Employed in Life, Physical & Social Science in Orange, TX?
77632 has the Highest Percentage of Population Employed in Life, Physical & Social Science in Orange, TX with 4.2%.
What is the Percentage of Population Employed in Life, Physical & Social Science in Orange, TX?
Percentage of Population Employed in Life, Physical & Social Science in Orange is 5.3%.
What is the Percentage of Population Employed in Life, Physical & Social Science in Texas?
Percentage of Population Employed in Life, Physical & Social Science in Texas is 0.84%.
What is the Percentage of Population Employed in Life, Physical & Social Science in the United States?
Percentage of Population Employed in Life, Physical & Social Science in the United States is 1.1%.