Zip Codes with the Highest Percentage of Population with a Degree in Liberal Arts and History in Orange, TX
RELATED REPORTS & OPTIONS
Liberal Arts and History
Orange
Compare Zip Codes
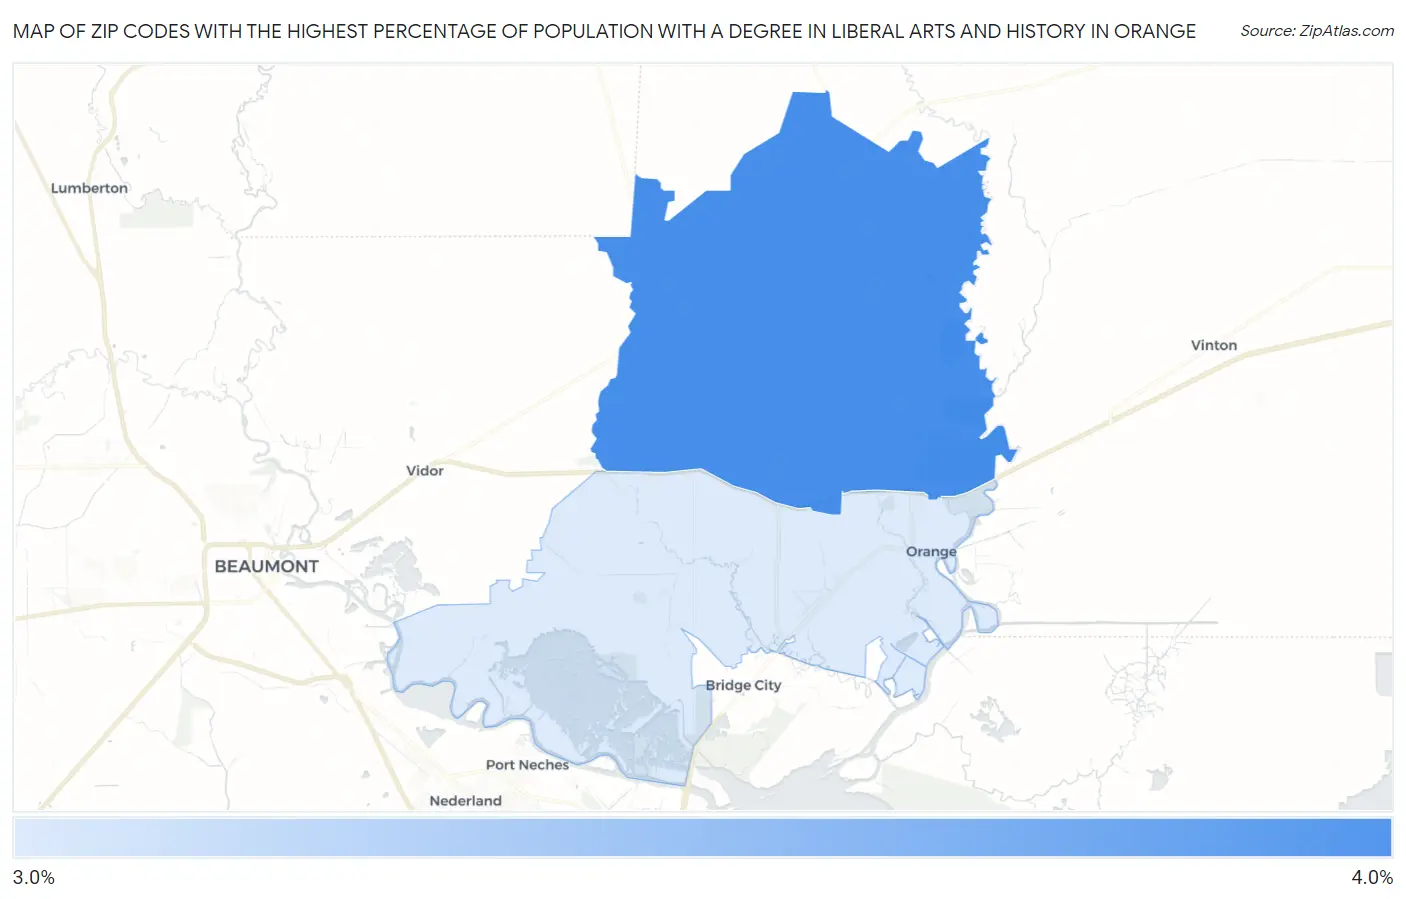
Map of Zip Codes with the Highest Percentage of Population with a Degree in Liberal Arts and History in Orange
0.0%
4.0%
Zip Codes with the Highest Percentage of Population with a Degree in Liberal Arts and History in Orange, TX
| Zip Code | % Graduates | vs State | vs National | |
| 1. | 77632 | 3.5% | 4.2%(-0.653)#898 | 4.9%(-1.37)#16,604 |
| 2. | 77630 | 3.3% | 4.2%(-0.846)#956 | 4.9%(-1.57)#17,298 |
1
Common Questions
What are the Top Zip Codes with the Highest Percentage of Population with a Degree in Liberal Arts and History in Orange, TX?
Top Zip Codes with the Highest Percentage of Population with a Degree in Liberal Arts and History in Orange, TX are:
What zip code has the Highest Percentage of Population with a Degree in Liberal Arts and History in Orange, TX?
77632 has the Highest Percentage of Population with a Degree in Liberal Arts and History in Orange, TX with 3.5%.
What is the Percentage of Population with a Degree in Liberal Arts and History in Orange, TX?
Percentage of Population with a Degree in Liberal Arts and History in Orange is 3.7%.
What is the Percentage of Population with a Degree in Liberal Arts and History in Texas?
Percentage of Population with a Degree in Liberal Arts and History in Texas is 4.2%.
What is the Percentage of Population with a Degree in Liberal Arts and History in the United States?
Percentage of Population with a Degree in Liberal Arts and History in the United States is 4.9%.