Zip Codes with the Highest Percentage of Population Employed in Office & Administration in Orange, TX
RELATED REPORTS & OPTIONS
Office & Administration
Orange
Compare Zip Codes
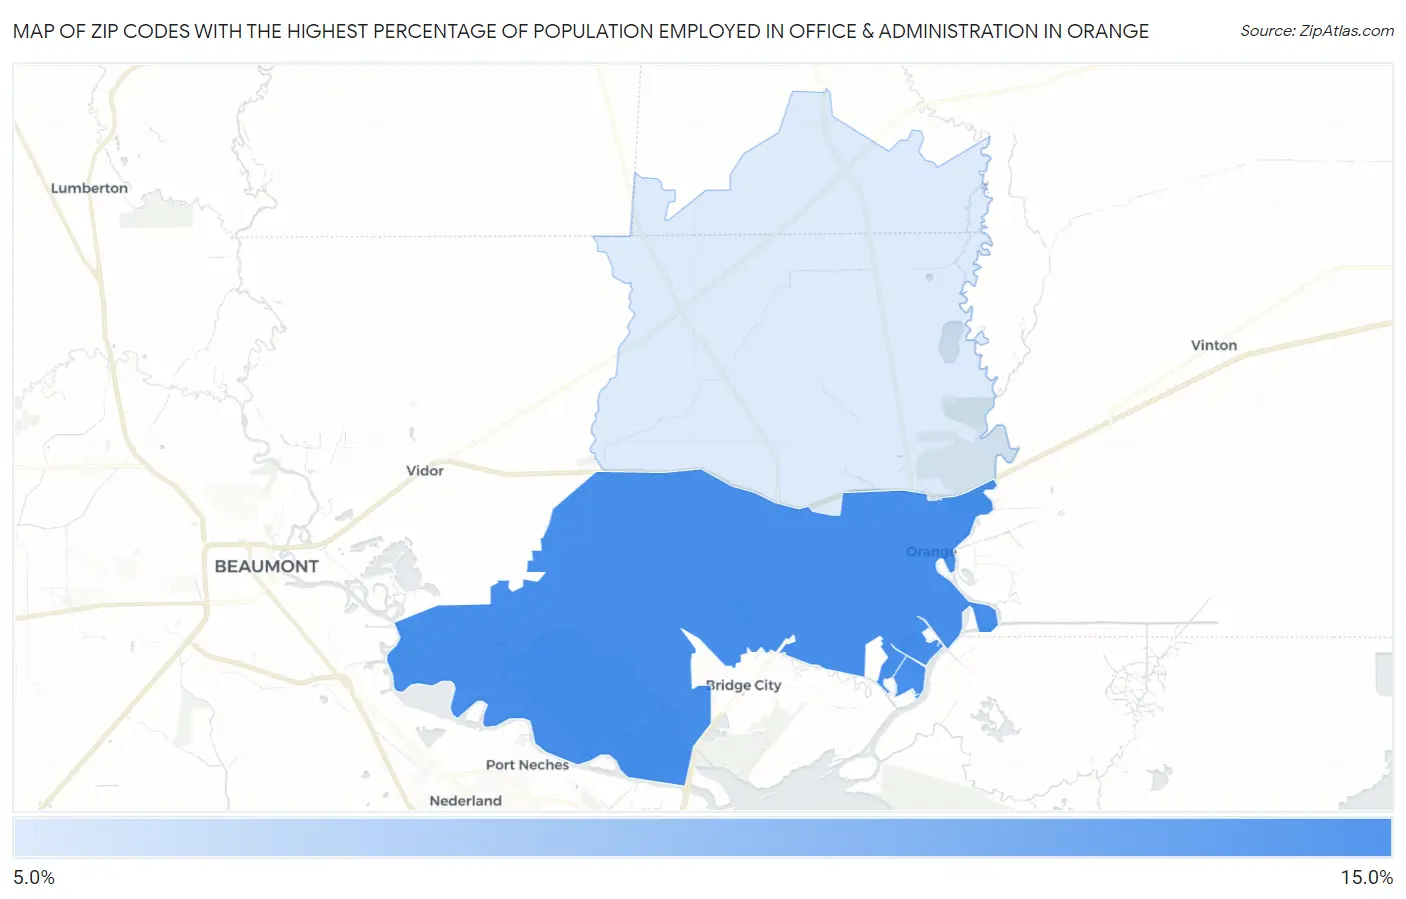
Map of Zip Codes with the Highest Percentage of Population Employed in Office & Administration in Orange
0.0%
15.0%
Zip Codes with the Highest Percentage of Population Employed in Office & Administration in Orange, TX
| Zip Code | % Employed | vs State | vs National | |
| 1. | 77630 | 10.6% | 11.0%(-0.353)#900 | 10.9%(-0.238)#15,063 |
| 2. | 77632 | 10.3% | 11.0%(-0.634)#964 | 10.9%(-0.519)#16,046 |
1
Common Questions
What are the Top Zip Codes with the Highest Percentage of Population Employed in Office & Administration in Orange, TX?
Top Zip Codes with the Highest Percentage of Population Employed in Office & Administration in Orange, TX are:
What zip code has the Highest Percentage of Population Employed in Office & Administration in Orange, TX?
77630 has the Highest Percentage of Population Employed in Office & Administration in Orange, TX with 10.6%.
What is the Percentage of Population Employed in Office & Administration in Orange, TX?
Percentage of Population Employed in Office & Administration in Orange is 9.4%.
What is the Percentage of Population Employed in Office & Administration in Texas?
Percentage of Population Employed in Office & Administration in Texas is 11.0%.
What is the Percentage of Population Employed in Office & Administration in the United States?
Percentage of Population Employed in Office & Administration in the United States is 10.9%.