Zip Codes with the Highest Percentage of Population Employed in Architecture & Engineering in Killeen, TX
RELATED REPORTS & OPTIONS
Architecture & Engineering
Killeen
Compare Zip Codes
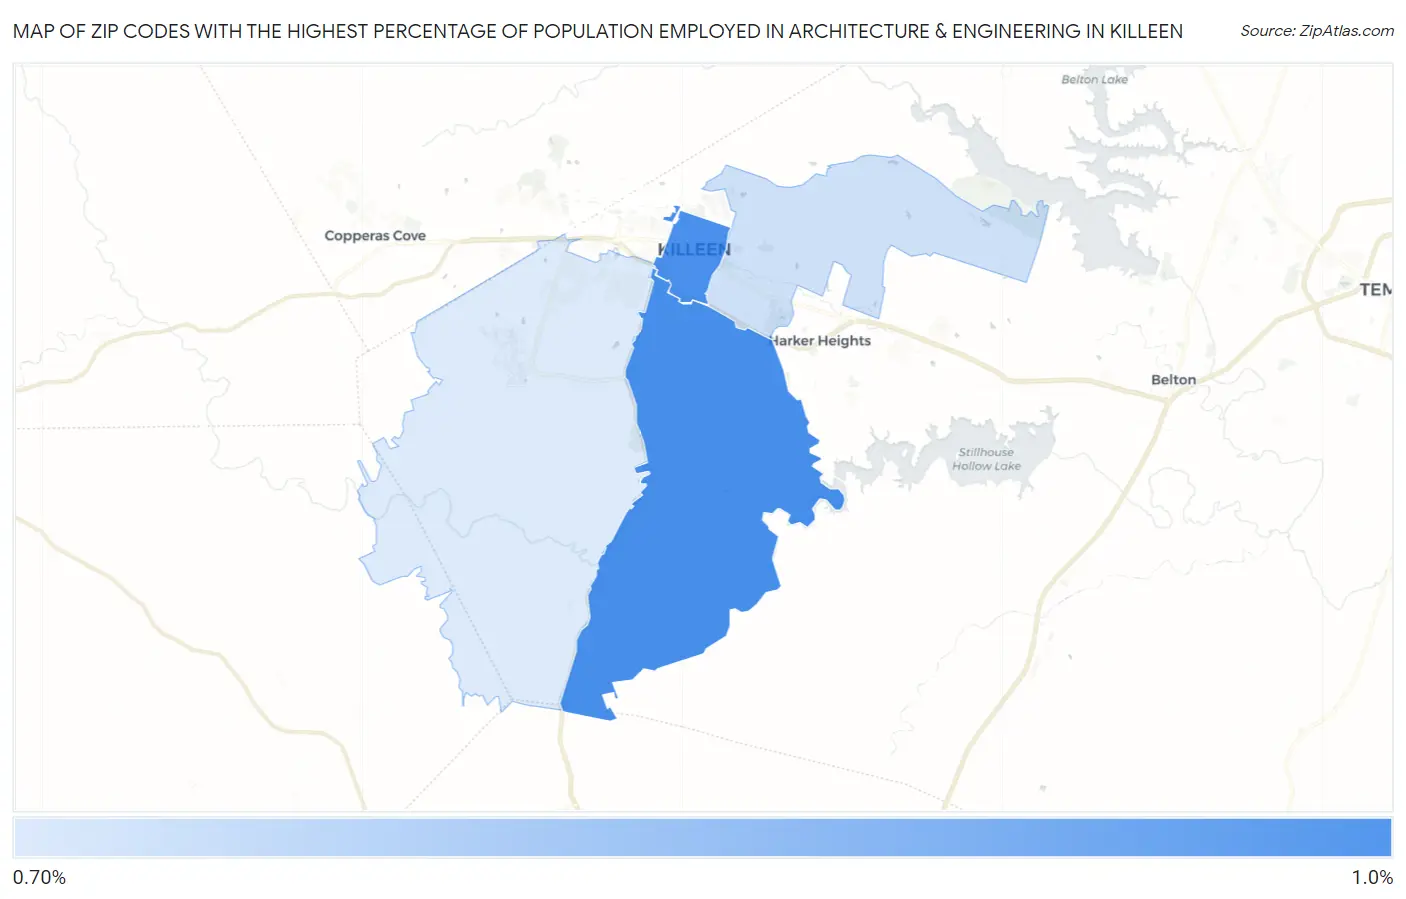
Map of Zip Codes with the Highest Percentage of Population Employed in Architecture & Engineering in Killeen
0.0%
1.0%
Zip Codes with the Highest Percentage of Population Employed in Architecture & Engineering in Killeen, TX
| Zip Code | % Employed | vs State | vs National | |
| 1. | 76542 | 0.97% | 2.2%(-1.25)#912 | 2.1%(-1.18)#16,857 |
| 2. | 76541 | 0.97% | 2.2%(-1.26)#913 | 2.1%(-1.18)#16,880 |
| 3. | 76543 | 0.79% | 2.2%(-1.43)#987 | 2.1%(-1.36)#18,208 |
| 4. | 76549 | 0.77% | 2.2%(-1.45)#995 | 2.1%(-1.38)#18,343 |
1
Common Questions
What are the Top 3 Zip Codes with the Highest Percentage of Population Employed in Architecture & Engineering in Killeen, TX?
Top 3 Zip Codes with the Highest Percentage of Population Employed in Architecture & Engineering in Killeen, TX are:
What zip code has the Highest Percentage of Population Employed in Architecture & Engineering in Killeen, TX?
76542 has the Highest Percentage of Population Employed in Architecture & Engineering in Killeen, TX with 0.97%.
What is the Percentage of Population Employed in Architecture & Engineering in Killeen, TX?
Percentage of Population Employed in Architecture & Engineering in Killeen is 0.87%.
What is the Percentage of Population Employed in Architecture & Engineering in Texas?
Percentage of Population Employed in Architecture & Engineering in Texas is 2.2%.
What is the Percentage of Population Employed in Architecture & Engineering in the United States?
Percentage of Population Employed in Architecture & Engineering in the United States is 2.1%.