Zip Codes with the Highest Percentage of Population Employed in Architecture & Engineering in Huntsville, TX
RELATED REPORTS & OPTIONS
Architecture & Engineering
Huntsville
Compare Zip Codes
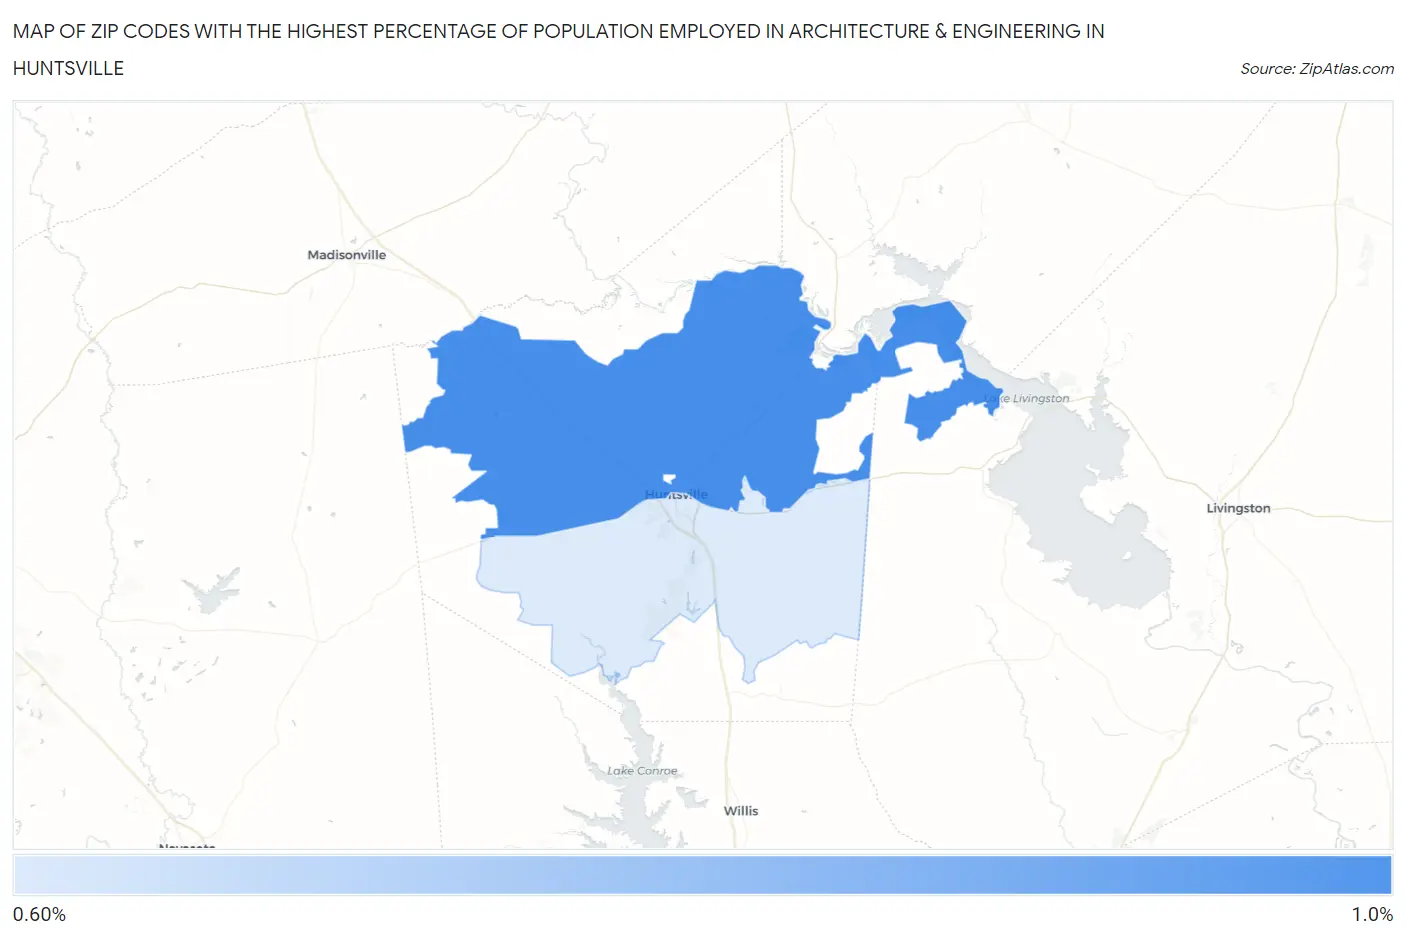
Map of Zip Codes with the Highest Percentage of Population Employed in Architecture & Engineering in Huntsville
0.0%
1.0%
Zip Codes with the Highest Percentage of Population Employed in Architecture & Engineering in Huntsville, TX
| Zip Code | % Employed | vs State | vs National | |
| 1. | 77320 | 0.92% | 2.2%(-1.31)#932 | 2.1%(-1.23)#17,236 |
| 2. | 77340 | 0.65% | 2.2%(-1.57)#1,061 | 2.1%(-1.49)#19,215 |
1
Common Questions
What are the Top Zip Codes with the Highest Percentage of Population Employed in Architecture & Engineering in Huntsville, TX?
Top Zip Codes with the Highest Percentage of Population Employed in Architecture & Engineering in Huntsville, TX are:
What zip code has the Highest Percentage of Population Employed in Architecture & Engineering in Huntsville, TX?
77320 has the Highest Percentage of Population Employed in Architecture & Engineering in Huntsville, TX with 0.92%.
What is the Percentage of Population Employed in Architecture & Engineering in Huntsville, TX?
Percentage of Population Employed in Architecture & Engineering in Huntsville is 0.57%.
What is the Percentage of Population Employed in Architecture & Engineering in Texas?
Percentage of Population Employed in Architecture & Engineering in Texas is 2.2%.
What is the Percentage of Population Employed in Architecture & Engineering in the United States?
Percentage of Population Employed in Architecture & Engineering in the United States is 2.1%.