Zip Codes with the Highest Percentage of Population Employed in Architecture & Engineering in Austin, TX
RELATED REPORTS & OPTIONS
Architecture & Engineering
Austin
Compare Zip Codes
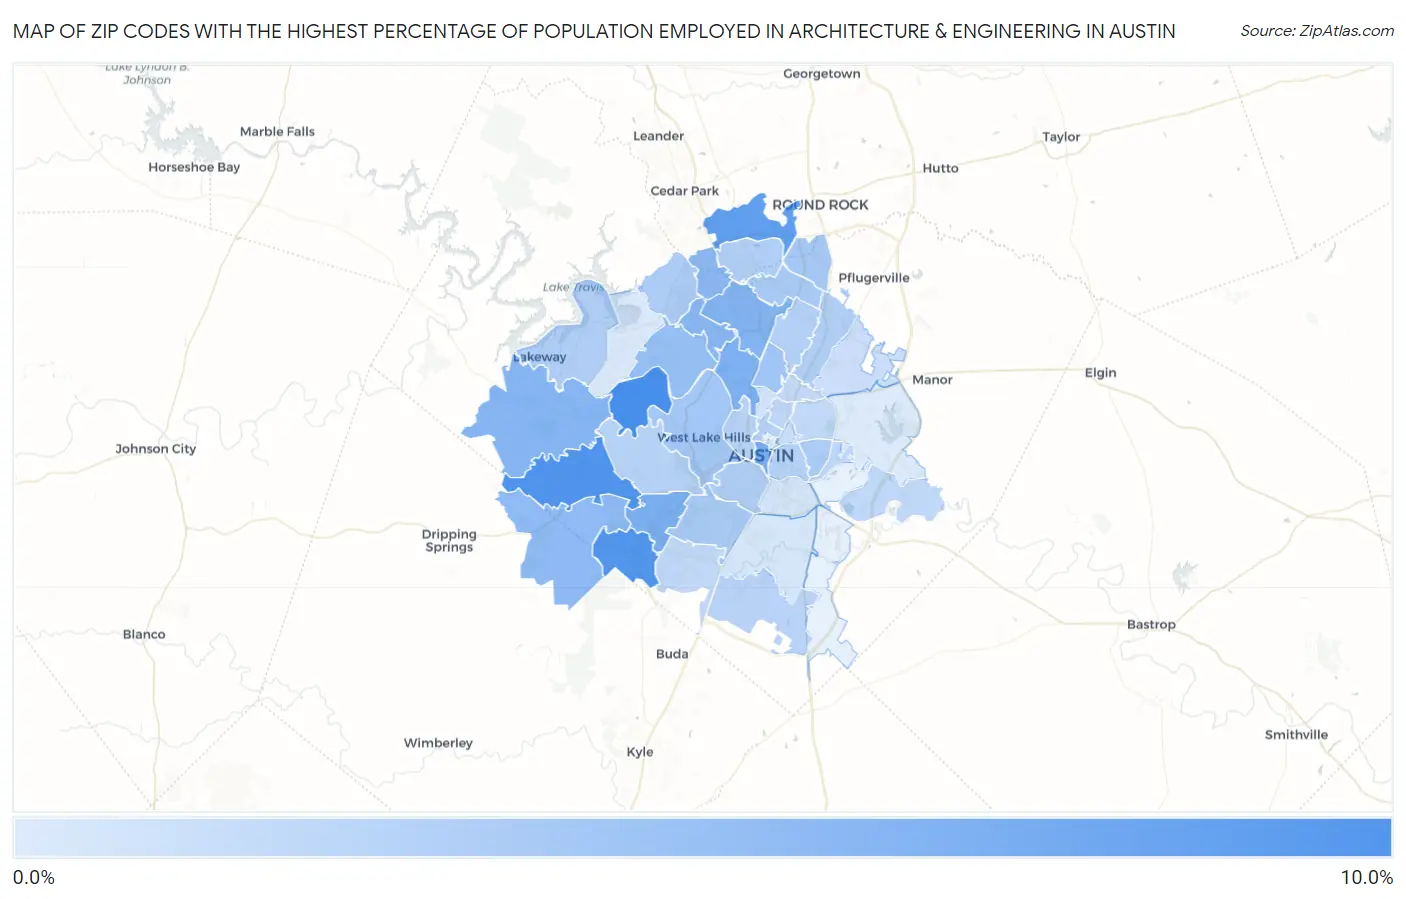
Map of Zip Codes with the Highest Percentage of Population Employed in Architecture & Engineering in Austin
0.0%
10.0%
Zip Codes with the Highest Percentage of Population Employed in Architecture & Engineering in Austin, TX
| Zip Code | % Employed | vs State | vs National | |
| 1. | 78733 | 8.8% | 2.2%(+6.59)#20 | 2.1%(+6.66)#444 |
| 2. | 78736 | 8.5% | 2.2%(+6.27)#23 | 2.1%(+6.35)#485 |
| 3. | 78739 | 8.1% | 2.2%(+5.93)#27 | 2.1%(+6.00)#548 |
| 4. | 78717 | 7.4% | 2.2%(+5.22)#34 | 2.1%(+5.29)#663 |
| 5. | 78701 | 6.3% | 2.2%(+4.05)#48 | 2.1%(+4.13)#966 |
| 6. | 78749 | 6.0% | 2.2%(+3.75)#58 | 2.1%(+3.82)#1,094 |
| 7. | 78731 | 5.9% | 2.2%(+3.72)#59 | 2.1%(+3.79)#1,104 |
| 8. | 78759 | 5.6% | 2.2%(+3.40)#68 | 2.1%(+3.48)#1,266 |
| 9. | 78738 | 5.5% | 2.2%(+3.30)#71 | 2.1%(+3.37)#1,316 |
| 10. | 78750 | 5.3% | 2.2%(+3.10)#78 | 2.1%(+3.17)#1,437 |
| 11. | 78737 | 5.1% | 2.2%(+2.89)#88 | 2.1%(+2.96)#1,589 |
| 12. | 78730 | 4.7% | 2.2%(+2.50)#107 | 2.1%(+2.57)#1,909 |
| 13. | 78757 | 4.1% | 2.2%(+1.89)#134 | 2.1%(+1.96)#2,601 |
| 14. | 78746 | 4.1% | 2.2%(+1.85)#138 | 2.1%(+1.93)#2,653 |
| 15. | 78728 | 3.9% | 2.2%(+1.70)#156 | 2.1%(+1.78)#2,889 |
| 16. | 78745 | 3.8% | 2.2%(+1.61)#167 | 2.1%(+1.68)#3,036 |
| 17. | 78727 | 3.7% | 2.2%(+1.52)#176 | 2.1%(+1.60)#3,203 |
| 18. | 78721 | 3.5% | 2.2%(+1.33)#210 | 2.1%(+1.40)#3,618 |
| 19. | 78726 | 3.5% | 2.2%(+1.32)#212 | 2.1%(+1.40)#3,621 |
| 20. | 78734 | 3.4% | 2.2%(+1.20)#224 | 2.1%(+1.27)#3,923 |
| 21. | 78704 | 3.4% | 2.2%(+1.16)#227 | 2.1%(+1.24)#3,986 |
| 22. | 78729 | 3.3% | 2.2%(+1.08)#240 | 2.1%(+1.15)#4,187 |
| 23. | 78753 | 3.3% | 2.2%(+1.07)#242 | 2.1%(+1.14)#4,215 |
| 24. | 78758 | 3.3% | 2.2%(+1.03)#250 | 2.1%(+1.11)#4,310 |
| 25. | 78702 | 3.1% | 2.2%(+0.906)#273 | 2.1%(+0.979)#4,659 |
| 26. | 78705 | 3.1% | 2.2%(+0.903)#275 | 2.1%(+0.976)#4,673 |
| 27. | 78735 | 3.0% | 2.2%(+0.823)#288 | 2.1%(+0.896)#4,906 |
| 28. | 78747 | 3.0% | 2.2%(+0.782)#297 | 2.1%(+0.855)#5,047 |
| 29. | 78703 | 3.0% | 2.2%(+0.776)#299 | 2.1%(+0.849)#5,062 |
| 30. | 78751 | 2.8% | 2.2%(+0.532)#332 | 2.1%(+0.605)#5,947 |
| 31. | 78725 | 2.6% | 2.2%(+0.365)#362 | 2.1%(+0.438)#6,636 |
| 32. | 78723 | 2.5% | 2.2%(+0.326)#369 | 2.1%(+0.399)#6,795 |
| 33. | 78748 | 2.5% | 2.2%(+0.267)#383 | 2.1%(+0.340)#7,044 |
| 34. | 78752 | 2.5% | 2.2%(+0.239)#388 | 2.1%(+0.312)#7,173 |
| 35. | 78722 | 2.1% | 2.2%(-0.073)#476 | 2.1%(+0.000)#8,763 |
| 36. | 78754 | 2.1% | 2.2%(-0.143)#502 | 2.1%(-0.070)#9,158 |
| 37. | 78756 | 1.7% | 2.2%(-0.563)#645 | 2.1%(-0.490)#11,771 |
| 38. | 78741 | 1.6% | 2.2%(-0.611)#663 | 2.1%(-0.538)#12,112 |
| 39. | 78744 | 1.5% | 2.2%(-0.703)#700 | 2.1%(-0.630)#12,742 |
| 40. | 78732 | 1.2% | 2.2%(-0.977)#793 | 2.1%(-0.904)#14,714 |
| 41. | 78724 | 1.1% | 2.2%(-1.09)#831 | 2.1%(-1.01)#15,585 |
1
Common Questions
What are the Top 10 Zip Codes with the Highest Percentage of Population Employed in Architecture & Engineering in Austin, TX?
Top 10 Zip Codes with the Highest Percentage of Population Employed in Architecture & Engineering in Austin, TX are:
What zip code has the Highest Percentage of Population Employed in Architecture & Engineering in Austin, TX?
78733 has the Highest Percentage of Population Employed in Architecture & Engineering in Austin, TX with 8.8%.
What is the Percentage of Population Employed in Architecture & Engineering in Austin, TX?
Percentage of Population Employed in Architecture & Engineering in Austin is 3.5%.
What is the Percentage of Population Employed in Architecture & Engineering in Texas?
Percentage of Population Employed in Architecture & Engineering in Texas is 2.2%.
What is the Percentage of Population Employed in Architecture & Engineering in the United States?
Percentage of Population Employed in Architecture & Engineering in the United States is 2.1%.