Zip Codes with the Highest Percentage of Population Employed in Architecture & Engineering in Port Arthur, TX
RELATED REPORTS & OPTIONS
Architecture & Engineering
Port Arthur
Compare Zip Codes
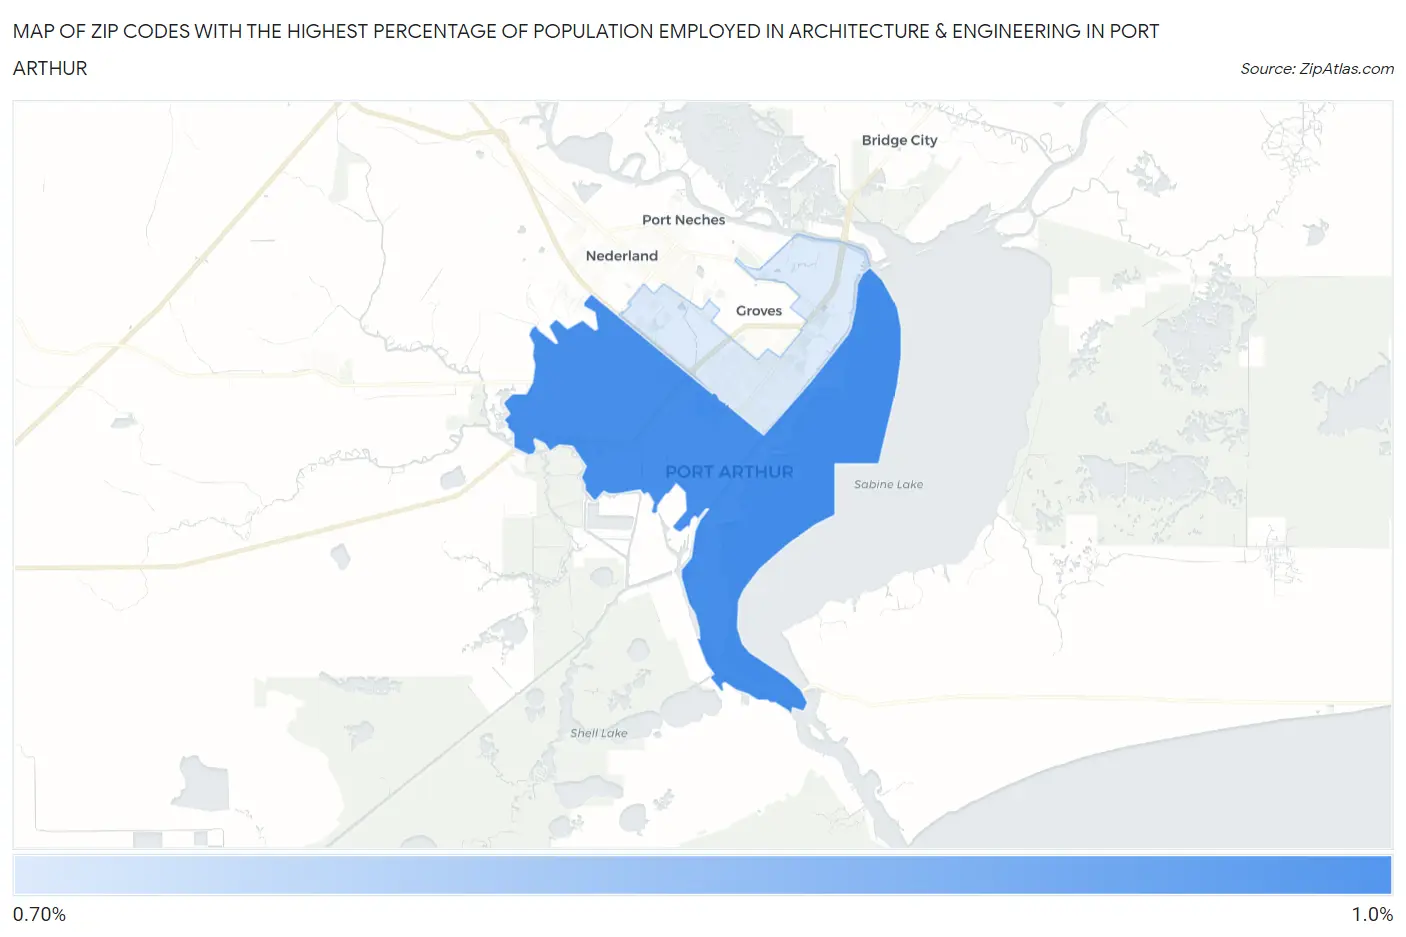
Map of Zip Codes with the Highest Percentage of Population Employed in Architecture & Engineering in Port Arthur
0.0%
1.0%
Zip Codes with the Highest Percentage of Population Employed in Architecture & Engineering in Port Arthur, TX
| Zip Code | % Employed | vs State | vs National | |
| 1. | 77640 | 0.93% | 2.2%(-1.29)#926 | 2.1%(-1.22)#17,116 |
| 2. | 77642 | 0.71% | 2.2%(-1.51)#1,026 | 2.1%(-1.44)#18,825 |
1
Common Questions
What are the Top Zip Codes with the Highest Percentage of Population Employed in Architecture & Engineering in Port Arthur, TX?
Top Zip Codes with the Highest Percentage of Population Employed in Architecture & Engineering in Port Arthur, TX are:
What zip code has the Highest Percentage of Population Employed in Architecture & Engineering in Port Arthur, TX?
77640 has the Highest Percentage of Population Employed in Architecture & Engineering in Port Arthur, TX with 0.93%.
What is the Percentage of Population Employed in Architecture & Engineering in Port Arthur, TX?
Percentage of Population Employed in Architecture & Engineering in Port Arthur is 0.77%.
What is the Percentage of Population Employed in Architecture & Engineering in Texas?
Percentage of Population Employed in Architecture & Engineering in Texas is 2.2%.
What is the Percentage of Population Employed in Architecture & Engineering in the United States?
Percentage of Population Employed in Architecture & Engineering in the United States is 2.1%.