Zip Codes with the Highest Percentage of Population Employed in Architecture & Engineering in Rowlett, TX
RELATED REPORTS & OPTIONS
Architecture & Engineering
Rowlett
Compare Zip Codes
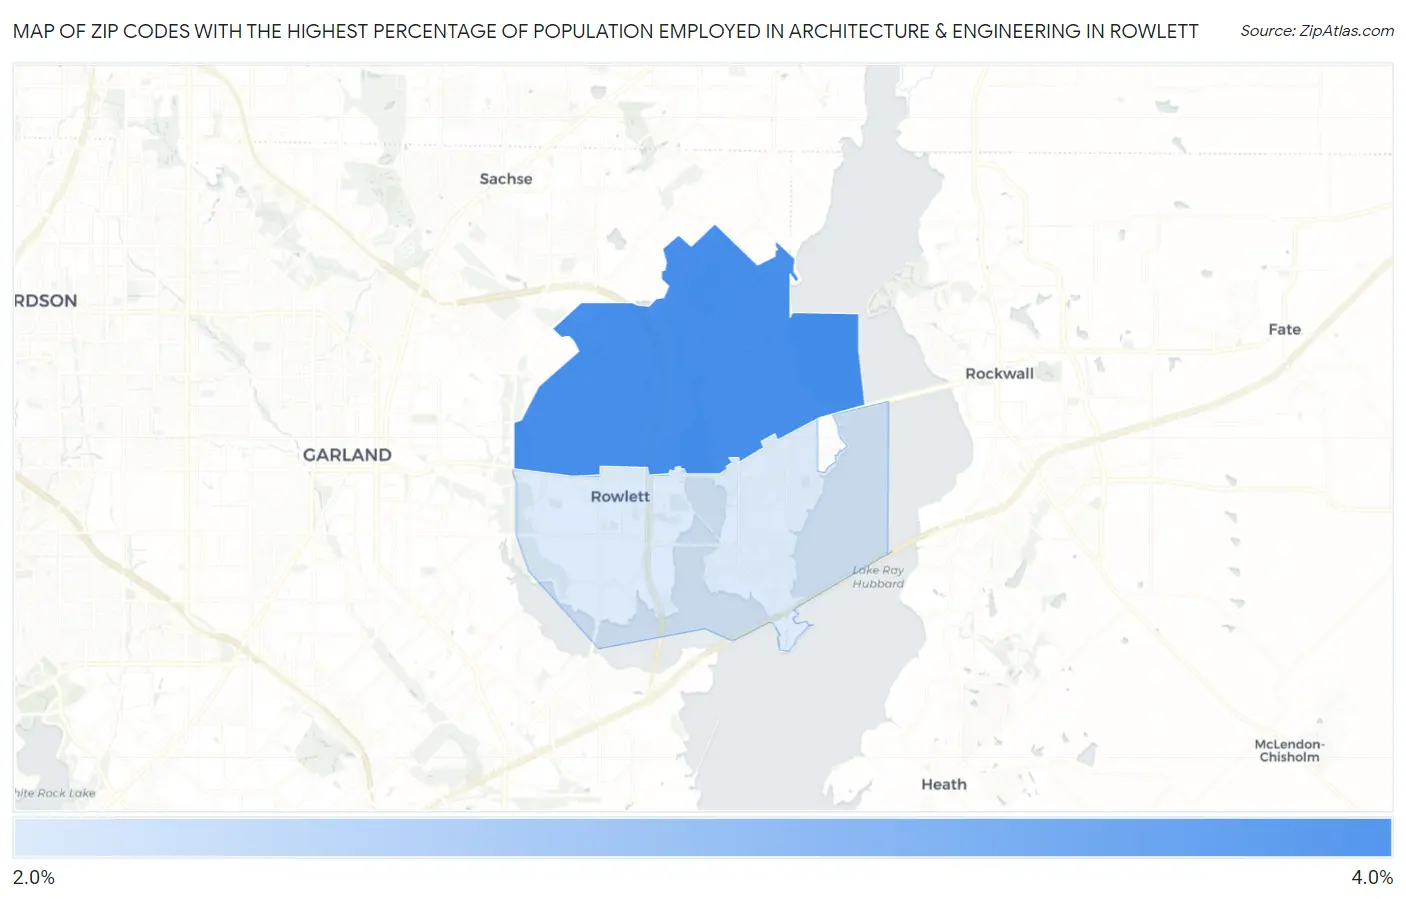
Map of Zip Codes with the Highest Percentage of Population Employed in Architecture & Engineering in Rowlett
0.0%
4.0%
Zip Codes with the Highest Percentage of Population Employed in Architecture & Engineering in Rowlett, TX
| Zip Code | % Employed | vs State | vs National | |
| 1. | 75089 | 3.5% | 2.2%(+1.26)#221 | 2.1%(+1.33)#3,787 |
| 2. | 75088 | 2.4% | 2.2%(+0.203)#399 | 2.1%(+0.276)#7,353 |
1
Common Questions
What are the Top Zip Codes with the Highest Percentage of Population Employed in Architecture & Engineering in Rowlett, TX?
Top Zip Codes with the Highest Percentage of Population Employed in Architecture & Engineering in Rowlett, TX are:
What zip code has the Highest Percentage of Population Employed in Architecture & Engineering in Rowlett, TX?
75089 has the Highest Percentage of Population Employed in Architecture & Engineering in Rowlett, TX with 3.5%.
What is the Percentage of Population Employed in Architecture & Engineering in Rowlett, TX?
Percentage of Population Employed in Architecture & Engineering in Rowlett is 3.0%.
What is the Percentage of Population Employed in Architecture & Engineering in Texas?
Percentage of Population Employed in Architecture & Engineering in Texas is 2.2%.
What is the Percentage of Population Employed in Architecture & Engineering in the United States?
Percentage of Population Employed in Architecture & Engineering in the United States is 2.1%.