Zip Codes with the Highest Percentage of Population Employed in Architecture & Engineering in Willis, TX
RELATED REPORTS & OPTIONS
Architecture & Engineering
Willis
Compare Zip Codes
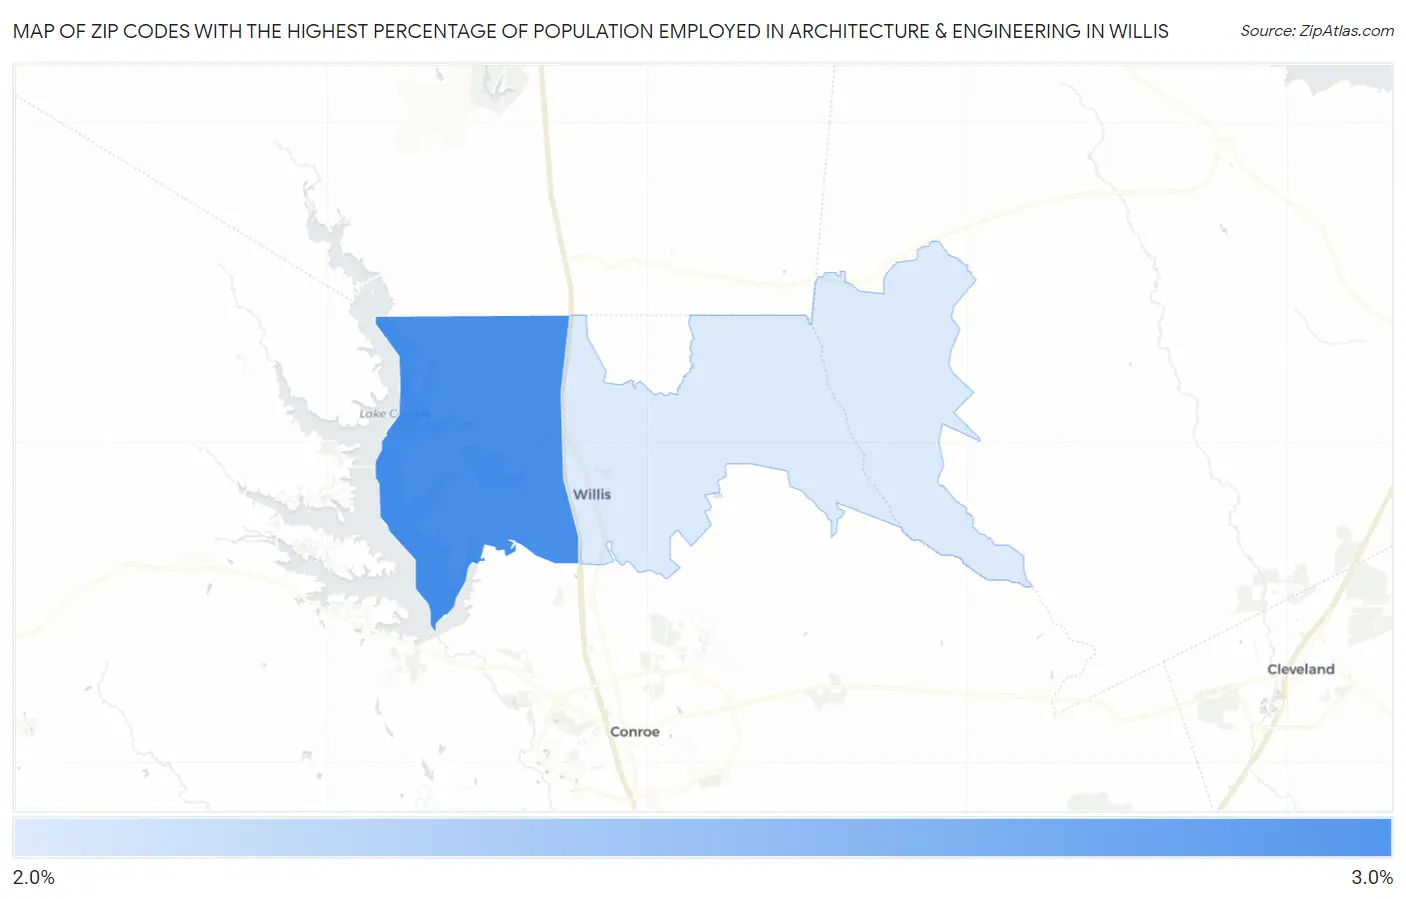
Map of Zip Codes with the Highest Percentage of Population Employed in Architecture & Engineering in Willis
0.0%
3.0%
Zip Codes with the Highest Percentage of Population Employed in Architecture & Engineering in Willis, TX
| Zip Code | % Employed | vs State | vs National | |
| 1. | 77318 | 2.7% | 2.2%(+0.505)#338 | 2.1%(+0.578)#6,054 |
| 2. | 77378 | 2.5% | 2.2%(+0.259)#385 | 2.1%(+0.332)#7,082 |
1
Common Questions
What are the Top Zip Codes with the Highest Percentage of Population Employed in Architecture & Engineering in Willis, TX?
Top Zip Codes with the Highest Percentage of Population Employed in Architecture & Engineering in Willis, TX are:
What zip code has the Highest Percentage of Population Employed in Architecture & Engineering in Willis, TX?
77318 has the Highest Percentage of Population Employed in Architecture & Engineering in Willis, TX with 2.7%.
What is the Percentage of Population Employed in Architecture & Engineering in Texas?
Percentage of Population Employed in Architecture & Engineering in Texas is 2.2%.
What is the Percentage of Population Employed in Architecture & Engineering in the United States?
Percentage of Population Employed in Architecture & Engineering in the United States is 2.1%.