Zip Codes with the Highest Percentage of Population Employed in Architecture & Engineering in Odessa, TX
RELATED REPORTS & OPTIONS
Architecture & Engineering
Odessa
Compare Zip Codes
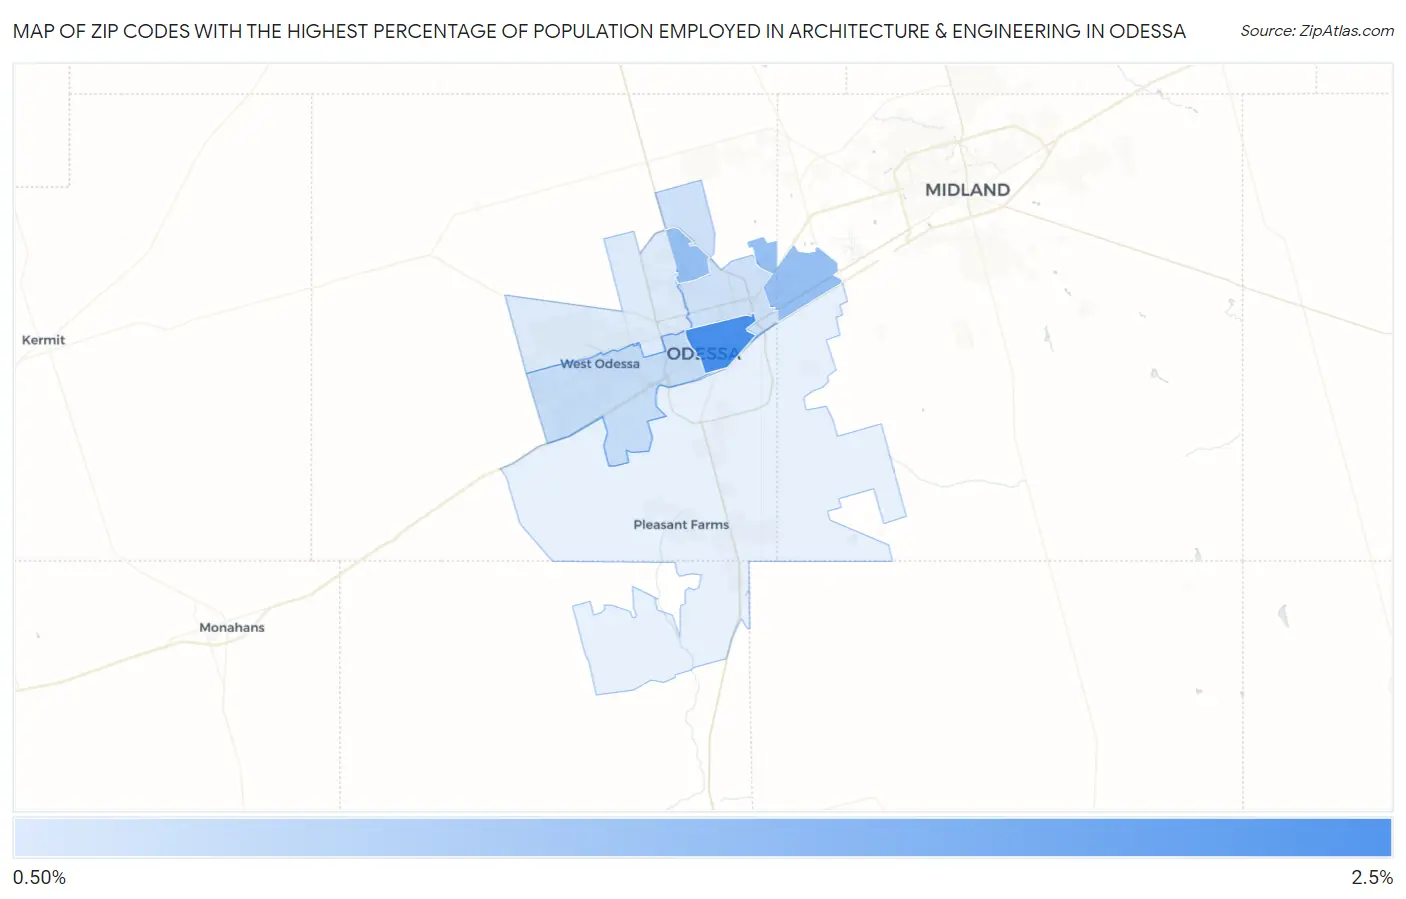
Map of Zip Codes with the Highest Percentage of Population Employed in Architecture & Engineering in Odessa
0.0%
2.5%
Zip Codes with the Highest Percentage of Population Employed in Architecture & Engineering in Odessa, TX
| Zip Code | % Employed | vs State | vs National | |
| 1. | 79761 | 2.1% | 2.2%(-0.152)#504 | 2.1%(-0.079)#9,205 |
| 2. | 79765 | 1.4% | 2.2%(-0.872)#757 | 2.1%(-0.799)#13,955 |
| 3. | 79763 | 0.91% | 2.2%(-1.31)#935 | 2.1%(-1.24)#17,288 |
| 4. | 79762 | 0.82% | 2.2%(-1.40)#972 | 2.1%(-1.33)#17,961 |
| 5. | 79764 | 0.70% | 2.2%(-1.52)#1,037 | 2.1%(-1.45)#18,896 |
1
Common Questions
What are the Top 5 Zip Codes with the Highest Percentage of Population Employed in Architecture & Engineering in Odessa, TX?
Top 5 Zip Codes with the Highest Percentage of Population Employed in Architecture & Engineering in Odessa, TX are:
What zip code has the Highest Percentage of Population Employed in Architecture & Engineering in Odessa, TX?
79761 has the Highest Percentage of Population Employed in Architecture & Engineering in Odessa, TX with 2.1%.
What is the Percentage of Population Employed in Architecture & Engineering in Odessa, TX?
Percentage of Population Employed in Architecture & Engineering in Odessa is 1.5%.
What is the Percentage of Population Employed in Architecture & Engineering in Texas?
Percentage of Population Employed in Architecture & Engineering in Texas is 2.2%.
What is the Percentage of Population Employed in Architecture & Engineering in the United States?
Percentage of Population Employed in Architecture & Engineering in the United States is 2.1%.