Zip Codes with the Highest Percentage of Population Employed in Architecture & Engineering in Utah
RELATED REPORTS & OPTIONS
Architecture & Engineering
Utah
Compare Zip Codes
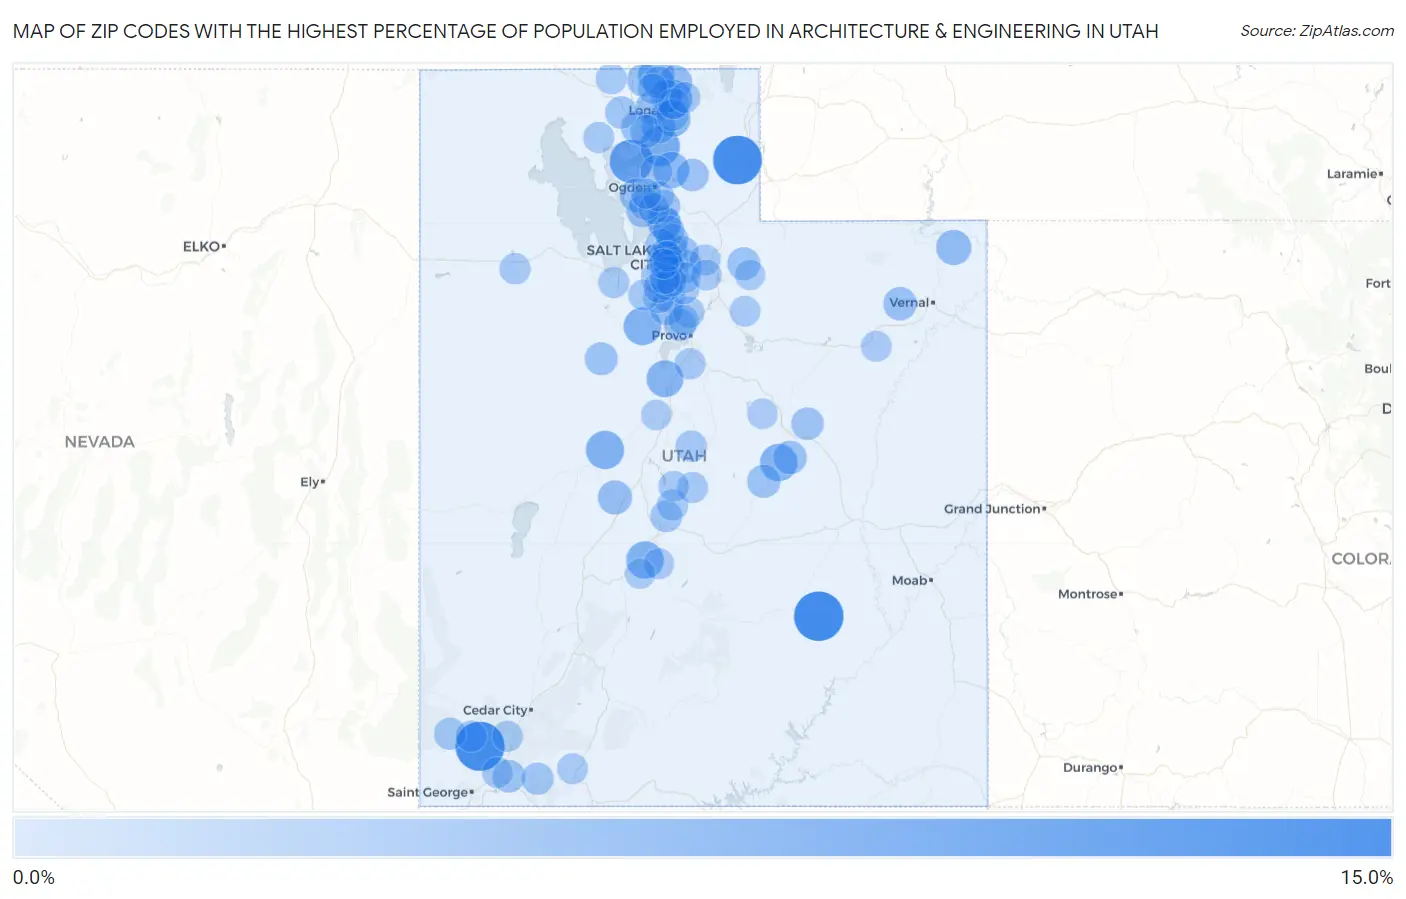
Map of Zip Codes with the Highest Percentage of Population Employed in Architecture & Engineering in Utah
0.0%
15.0%
Zip Codes with the Highest Percentage of Population Employed in Architecture & Engineering in Utah
| Zip Code | % Employed | vs State | vs National | |
| 1. | 84734 | 13.9% | 2.2%(+11.7)#1 | 2.1%(+11.7)#176 |
| 2. | 84781 | 13.5% | 2.2%(+11.4)#2 | 2.1%(+11.4)#182 |
| 3. | 84086 | 13.4% | 2.2%(+11.2)#3 | 2.1%(+11.2)#186 |
| 4. | 84340 | 9.9% | 2.2%(+7.76)#4 | 2.1%(+7.77)#348 |
| 5. | 84324 | 7.8% | 2.2%(+5.63)#5 | 2.1%(+5.64)#611 |
| 6. | 84640 | 6.8% | 2.2%(+4.62)#6 | 2.1%(+4.63)#804 |
| 7. | 84013 | 6.5% | 2.2%(+4.38)#7 | 2.1%(+4.39)#873 |
| 8. | 84711 | 6.4% | 2.2%(+4.20)#8 | 2.1%(+4.21)#941 |
| 9. | 84518 | 6.3% | 2.2%(+4.11)#9 | 2.1%(+4.12)#967 |
| 10. | 84318 | 6.2% | 2.2%(+4.09)#10 | 2.1%(+4.10)#979 |
| 11. | 84633 | 6.0% | 2.2%(+3.80)#11 | 2.1%(+3.81)#1,100 |
| 12. | 84308 | 5.8% | 2.2%(+3.68)#12 | 2.1%(+3.69)#1,162 |
| 13. | 84310 | 5.6% | 2.2%(+3.45)#13 | 2.1%(+3.46)#1,279 |
| 14. | 84326 | 5.5% | 2.2%(+3.33)#14 | 2.1%(+3.34)#1,329 |
| 15. | 84023 | 4.9% | 2.2%(+2.76)#15 | 2.1%(+2.77)#1,713 |
| 16. | 84333 | 4.6% | 2.2%(+2.39)#16 | 2.1%(+2.40)#2,070 |
| 17. | 84339 | 4.4% | 2.2%(+2.26)#17 | 2.1%(+2.27)#2,229 |
| 18. | 84636 | 4.4% | 2.2%(+2.21)#18 | 2.1%(+2.22)#2,303 |
| 19. | 84101 | 4.2% | 2.2%(+1.99)#19 | 2.1%(+2.00)#2,557 |
| 20. | 84325 | 4.1% | 2.2%(+1.95)#20 | 2.1%(+1.96)#2,609 |
| 21. | 84109 | 4.0% | 2.2%(+1.87)#21 | 2.1%(+1.87)#2,732 |
| 22. | 84521 | 4.0% | 2.2%(+1.84)#22 | 2.1%(+1.85)#2,762 |
| 23. | 84315 | 4.0% | 2.2%(+1.81)#23 | 2.1%(+1.82)#2,812 |
| 24. | 84037 | 3.9% | 2.2%(+1.79)#24 | 2.1%(+1.79)#2,862 |
| 25. | 84039 | 3.9% | 2.2%(+1.73)#25 | 2.1%(+1.74)#2,953 |
| 26. | 84305 | 3.8% | 2.2%(+1.68)#26 | 2.1%(+1.68)#3,032 |
| 27. | 84513 | 3.8% | 2.2%(+1.67)#27 | 2.1%(+1.68)#3,045 |
| 28. | 84105 | 3.8% | 2.2%(+1.66)#28 | 2.1%(+1.67)#3,061 |
| 29. | 84103 | 3.8% | 2.2%(+1.65)#29 | 2.1%(+1.66)#3,067 |
| 30. | 84301 | 3.8% | 2.2%(+1.62)#30 | 2.1%(+1.62)#3,144 |
| 31. | 84335 | 3.7% | 2.2%(+1.59)#31 | 2.1%(+1.60)#3,199 |
| 32. | 84055 | 3.7% | 2.2%(+1.50)#32 | 2.1%(+1.51)#3,381 |
| 33. | 84080 | 3.6% | 2.2%(+1.46)#33 | 2.1%(+1.47)#3,480 |
| 34. | 84302 | 3.6% | 2.2%(+1.42)#34 | 2.1%(+1.43)#3,557 |
| 35. | 84020 | 3.5% | 2.2%(+1.33)#35 | 2.1%(+1.34)#3,757 |
| 36. | 84025 | 3.5% | 2.2%(+1.32)#36 | 2.1%(+1.33)#3,794 |
| 37. | 84745 | 3.5% | 2.2%(+1.32)#37 | 2.1%(+1.32)#3,806 |
| 38. | 84108 | 3.5% | 2.2%(+1.31)#38 | 2.1%(+1.32)#3,820 |
| 39. | 84043 | 3.4% | 2.2%(+1.28)#39 | 2.1%(+1.28)#3,894 |
| 40. | 84040 | 3.4% | 2.2%(+1.22)#40 | 2.1%(+1.23)#3,993 |
| 41. | 84542 | 3.4% | 2.2%(+1.22)#41 | 2.1%(+1.23)#4,009 |
| 42. | 84317 | 3.4% | 2.2%(+1.20)#42 | 2.1%(+1.21)#4,045 |
| 43. | 84338 | 3.3% | 2.2%(+1.18)#43 | 2.1%(+1.18)#4,107 |
| 44. | 84111 | 3.3% | 2.2%(+1.11)#44 | 2.1%(+1.12)#4,267 |
| 45. | 84337 | 3.3% | 2.2%(+1.11)#45 | 2.1%(+1.12)#4,271 |
| 46. | 84059 | 3.2% | 2.2%(+1.09)#46 | 2.1%(+1.10)#4,334 |
| 47. | 84075 | 3.2% | 2.2%(+1.07)#47 | 2.1%(+1.08)#4,397 |
| 48. | 84767 | 3.2% | 2.2%(+1.04)#48 | 2.1%(+1.05)#4,476 |
| 49. | 84414 | 3.2% | 2.2%(+1.03)#49 | 2.1%(+1.04)#4,496 |
| 50. | 84054 | 3.2% | 2.2%(+0.998)#50 | 2.1%(+1.01)#4,583 |
| 51. | 84015 | 3.1% | 2.2%(+0.961)#51 | 2.1%(+0.970)#4,694 |
| 52. | 84332 | 3.1% | 2.2%(+0.942)#52 | 2.1%(+0.951)#4,744 |
| 53. | 84107 | 3.1% | 2.2%(+0.932)#53 | 2.1%(+0.940)#4,768 |
| 54. | 84010 | 3.1% | 2.2%(+0.913)#54 | 2.1%(+0.922)#4,808 |
| 55. | 84725 | 3.0% | 2.2%(+0.861)#55 | 2.1%(+0.870)#4,991 |
| 56. | 84652 | 3.0% | 2.2%(+0.846)#56 | 2.1%(+0.855)#5,046 |
| 57. | 84124 | 2.8% | 2.2%(+0.673)#57 | 2.1%(+0.682)#5,657 |
| 58. | 84014 | 2.8% | 2.2%(+0.620)#58 | 2.1%(+0.629)#5,873 |
| 59. | 84722 | 2.7% | 2.2%(+0.528)#59 | 2.1%(+0.537)#6,216 |
| 60. | 84667 | 2.7% | 2.2%(+0.526)#60 | 2.1%(+0.535)#6,226 |
| 61. | 84065 | 2.7% | 2.2%(+0.493)#61 | 2.1%(+0.502)#6,360 |
| 62. | 84029 | 2.6% | 2.2%(+0.452)#62 | 2.1%(+0.461)#6,535 |
| 63. | 84084 | 2.6% | 2.2%(+0.448)#63 | 2.1%(+0.457)#6,555 |
| 64. | 84622 | 2.6% | 2.2%(+0.447)#64 | 2.1%(+0.456)#6,559 |
| 65. | 84062 | 2.6% | 2.2%(+0.430)#65 | 2.1%(+0.439)#6,627 |
| 66. | 84096 | 2.5% | 2.2%(+0.389)#66 | 2.1%(+0.398)#6,803 |
| 67. | 84653 | 2.5% | 2.2%(+0.369)#67 | 2.1%(+0.377)#6,877 |
| 68. | 84074 | 2.5% | 2.2%(+0.358)#68 | 2.1%(+0.367)#6,930 |
| 69. | 84098 | 2.5% | 2.2%(+0.347)#69 | 2.1%(+0.356)#6,972 |
| 70. | 84665 | 2.5% | 2.2%(+0.342)#70 | 2.1%(+0.351)#6,996 |
| 71. | 84746 | 2.5% | 2.2%(+0.337)#71 | 2.1%(+0.346)#7,011 |
| 72. | 84341 | 2.5% | 2.2%(+0.326)#72 | 2.1%(+0.335)#7,073 |
| 73. | 84041 | 2.5% | 2.2%(+0.319)#73 | 2.1%(+0.328)#7,098 |
| 74. | 84307 | 2.5% | 2.2%(+0.311)#74 | 2.1%(+0.320)#7,139 |
| 75. | 84106 | 2.5% | 2.2%(+0.304)#75 | 2.1%(+0.313)#7,168 |
| 76. | 84321 | 2.5% | 2.2%(+0.300)#76 | 2.1%(+0.309)#7,189 |
| 77. | 84331 | 2.4% | 2.2%(+0.281)#77 | 2.1%(+0.290)#7,286 |
| 78. | 84720 | 2.4% | 2.2%(+0.280)#78 | 2.1%(+0.289)#7,292 |
| 79. | 84092 | 2.4% | 2.2%(+0.269)#79 | 2.1%(+0.278)#7,343 |
| 80. | 84094 | 2.4% | 2.2%(+0.257)#80 | 2.1%(+0.266)#7,411 |
| 81. | 84758 | 2.4% | 2.2%(+0.251)#81 | 2.1%(+0.260)#7,440 |
| 82. | 84701 | 2.4% | 2.2%(+0.211)#82 | 2.1%(+0.220)#7,625 |
| 83. | 84052 | 2.4% | 2.2%(+0.199)#83 | 2.1%(+0.208)#7,684 |
| 84. | 84121 | 2.4% | 2.2%(+0.196)#84 | 2.1%(+0.205)#7,701 |
| 85. | 84060 | 2.4% | 2.2%(+0.195)#85 | 2.1%(+0.204)#7,704 |
| 86. | 84634 | 2.3% | 2.2%(+0.141)#86 | 2.1%(+0.150)#7,945 |
| 87. | 84095 | 2.3% | 2.2%(+0.129)#87 | 2.1%(+0.138)#8,016 |
| 88. | 84032 | 2.3% | 2.2%(+0.112)#88 | 2.1%(+0.121)#8,100 |
| 89. | 84093 | 2.3% | 2.2%(+0.100)#89 | 2.1%(+0.109)#8,154 |
| 90. | 84047 | 2.2% | 2.2%(+0.084)#90 | 2.1%(+0.093)#8,238 |
| 91. | 84405 | 2.2% | 2.2%(+0.067)#91 | 2.1%(+0.076)#8,342 |
| 92. | 84042 | 2.2% | 2.2%(+0.021)#92 | 2.1%(+0.030)#8,608 |
| 93. | 84526 | 2.2% | 2.2%(+0.012)#93 | 2.1%(+0.021)#8,659 |
| 94. | 84648 | 2.2% | 2.2%(+0.012)#94 | 2.1%(+0.021)#8,661 |
| 95. | 84102 | 2.1% | 2.2%(-0.025)#95 | 2.1%(-0.016)#8,846 |
| 96. | 84036 | 2.1% | 2.2%(-0.048)#96 | 2.1%(-0.040)#8,982 |
| 97. | 84754 | 2.1% | 2.2%(-0.056)#97 | 2.1%(-0.047)#9,028 |
| 98. | 84115 | 2.1% | 2.2%(-0.070)#98 | 2.1%(-0.061)#9,119 |
| 99. | 84067 | 2.1% | 2.2%(-0.087)#99 | 2.1%(-0.078)#9,200 |
| 100. | 84327 | 2.1% | 2.2%(-0.099)#100 | 2.1%(-0.090)#9,262 |
Common Questions
What are the Top 10 Zip Codes with the Highest Percentage of Population Employed in Architecture & Engineering in Utah?
Top 10 Zip Codes with the Highest Percentage of Population Employed in Architecture & Engineering in Utah are:
What zip code has the Highest Percentage of Population Employed in Architecture & Engineering in Utah?
84734 has the Highest Percentage of Population Employed in Architecture & Engineering in Utah with 13.9%.
What is the Percentage of Population Employed in Architecture & Engineering in the State of Utah?
Percentage of Population Employed in Architecture & Engineering in Utah is 2.2%.
What is the Percentage of Population Employed in Architecture & Engineering in the United States?
Percentage of Population Employed in Architecture & Engineering in the United States is 2.1%.