Zip Codes with the Highest Percentage of Population Employed in Architecture & Engineering in Victoria, TX
RELATED REPORTS & OPTIONS
Architecture & Engineering
Victoria
Compare Zip Codes
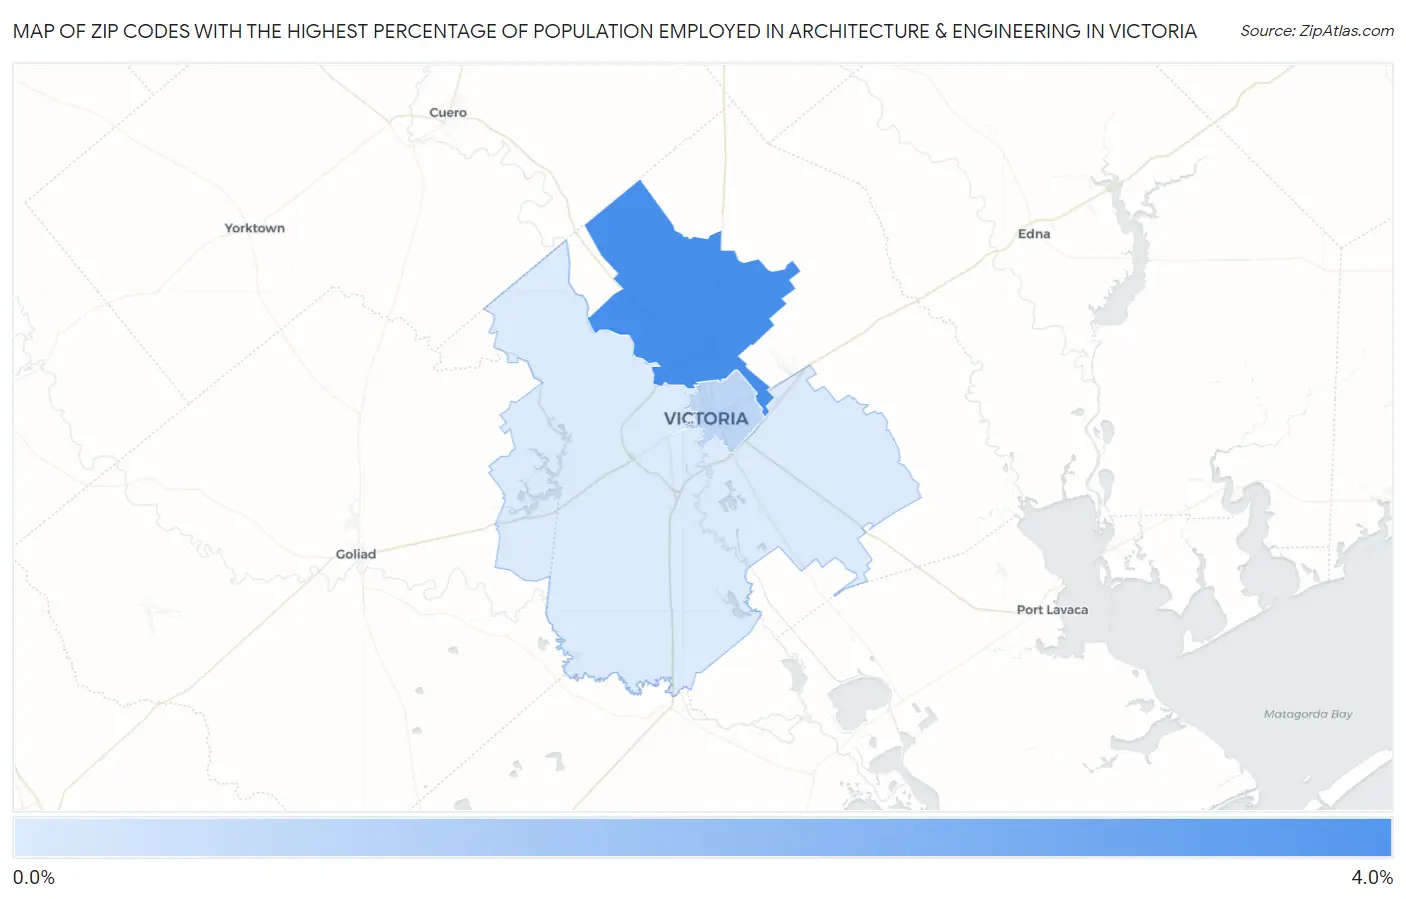
Map of Zip Codes with the Highest Percentage of Population Employed in Architecture & Engineering in Victoria
0.0%
4.0%
Zip Codes with the Highest Percentage of Population Employed in Architecture & Engineering in Victoria, TX
| Zip Code | % Employed | vs State | vs National | |
| 1. | 77904 | 3.7% | 2.2%(+1.50)#179 | 2.1%(+1.58)#3,246 |
| 2. | 77901 | 1.1% | 2.2%(-1.13)#850 | 2.1%(-1.06)#15,953 |
| 3. | 77905 | 0.36% | 2.2%(-1.86)#1,200 | 2.1%(-1.79)#21,208 |
1
Common Questions
What are the Top Zip Codes with the Highest Percentage of Population Employed in Architecture & Engineering in Victoria, TX?
Top Zip Codes with the Highest Percentage of Population Employed in Architecture & Engineering in Victoria, TX are:
What zip code has the Highest Percentage of Population Employed in Architecture & Engineering in Victoria, TX?
77904 has the Highest Percentage of Population Employed in Architecture & Engineering in Victoria, TX with 3.7%.
What is the Percentage of Population Employed in Architecture & Engineering in Victoria, TX?
Percentage of Population Employed in Architecture & Engineering in Victoria is 2.3%.
What is the Percentage of Population Employed in Architecture & Engineering in Texas?
Percentage of Population Employed in Architecture & Engineering in Texas is 2.2%.
What is the Percentage of Population Employed in Architecture & Engineering in the United States?
Percentage of Population Employed in Architecture & Engineering in the United States is 2.1%.