Zip Codes with the Highest Percentage of Population Employed in Architecture & Engineering in Spring, TX
RELATED REPORTS & OPTIONS
Architecture & Engineering
Spring
Compare Zip Codes
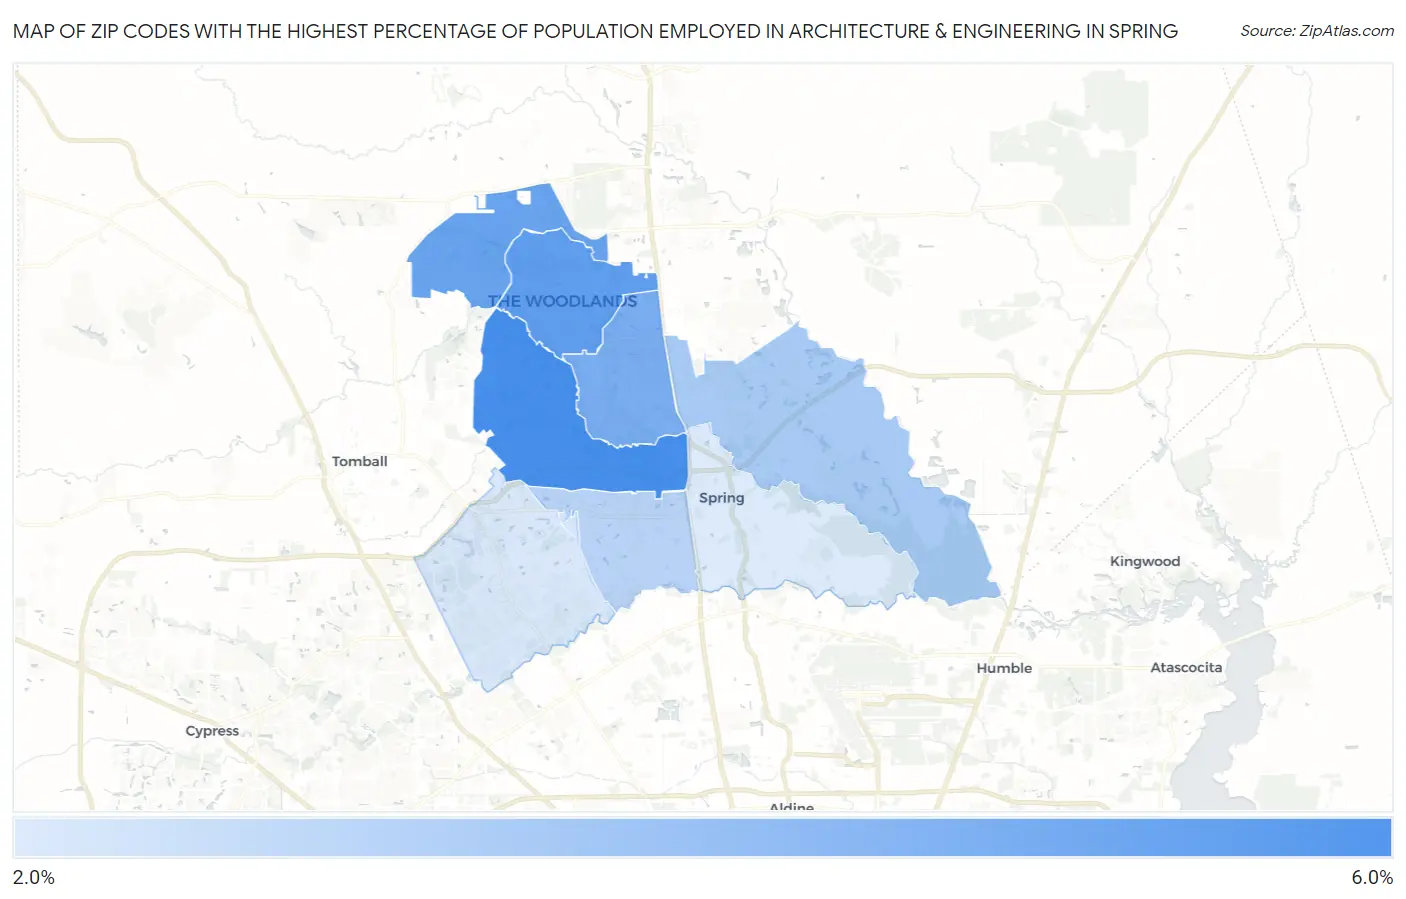
Map of Zip Codes with the Highest Percentage of Population Employed in Architecture & Engineering in Spring
0.0%
6.0%
Zip Codes with the Highest Percentage of Population Employed in Architecture & Engineering in Spring, TX
| Zip Code | % Employed | vs State | vs National | |
| 1. | 77389 | 5.8% | 2.2%(+3.54)#64 | 2.1%(+3.62)#1,186 |
| 2. | 77381 | 5.2% | 2.2%(+2.97)#83 | 2.1%(+3.04)#1,522 |
| 3. | 77382 | 4.9% | 2.2%(+2.73)#96 | 2.1%(+2.80)#1,698 |
| 4. | 77380 | 4.6% | 2.2%(+2.38)#112 | 2.1%(+2.45)#2,019 |
| 5. | 77386 | 3.5% | 2.2%(+1.30)#215 | 2.1%(+1.37)#3,676 |
| 6. | 77388 | 3.1% | 2.2%(+0.898)#278 | 2.1%(+0.971)#4,693 |
| 7. | 77379 | 2.4% | 2.2%(+0.182)#410 | 2.1%(+0.255)#7,466 |
| 8. | 77373 | 2.3% | 2.2%(+0.070)#431 | 2.1%(+0.143)#7,991 |
1
Common Questions
What are the Top 5 Zip Codes with the Highest Percentage of Population Employed in Architecture & Engineering in Spring, TX?
Top 5 Zip Codes with the Highest Percentage of Population Employed in Architecture & Engineering in Spring, TX are:
What zip code has the Highest Percentage of Population Employed in Architecture & Engineering in Spring, TX?
77389 has the Highest Percentage of Population Employed in Architecture & Engineering in Spring, TX with 5.8%.
What is the Percentage of Population Employed in Architecture & Engineering in Spring, TX?
Percentage of Population Employed in Architecture & Engineering in Spring is 2.1%.
What is the Percentage of Population Employed in Architecture & Engineering in Texas?
Percentage of Population Employed in Architecture & Engineering in Texas is 2.2%.
What is the Percentage of Population Employed in Architecture & Engineering in the United States?
Percentage of Population Employed in Architecture & Engineering in the United States is 2.1%.