Zip Codes with the Highest Percentage of Population Employed in Architecture & Engineering in Missouri City, TX
RELATED REPORTS & OPTIONS
Architecture & Engineering
Missouri City
Compare Zip Codes
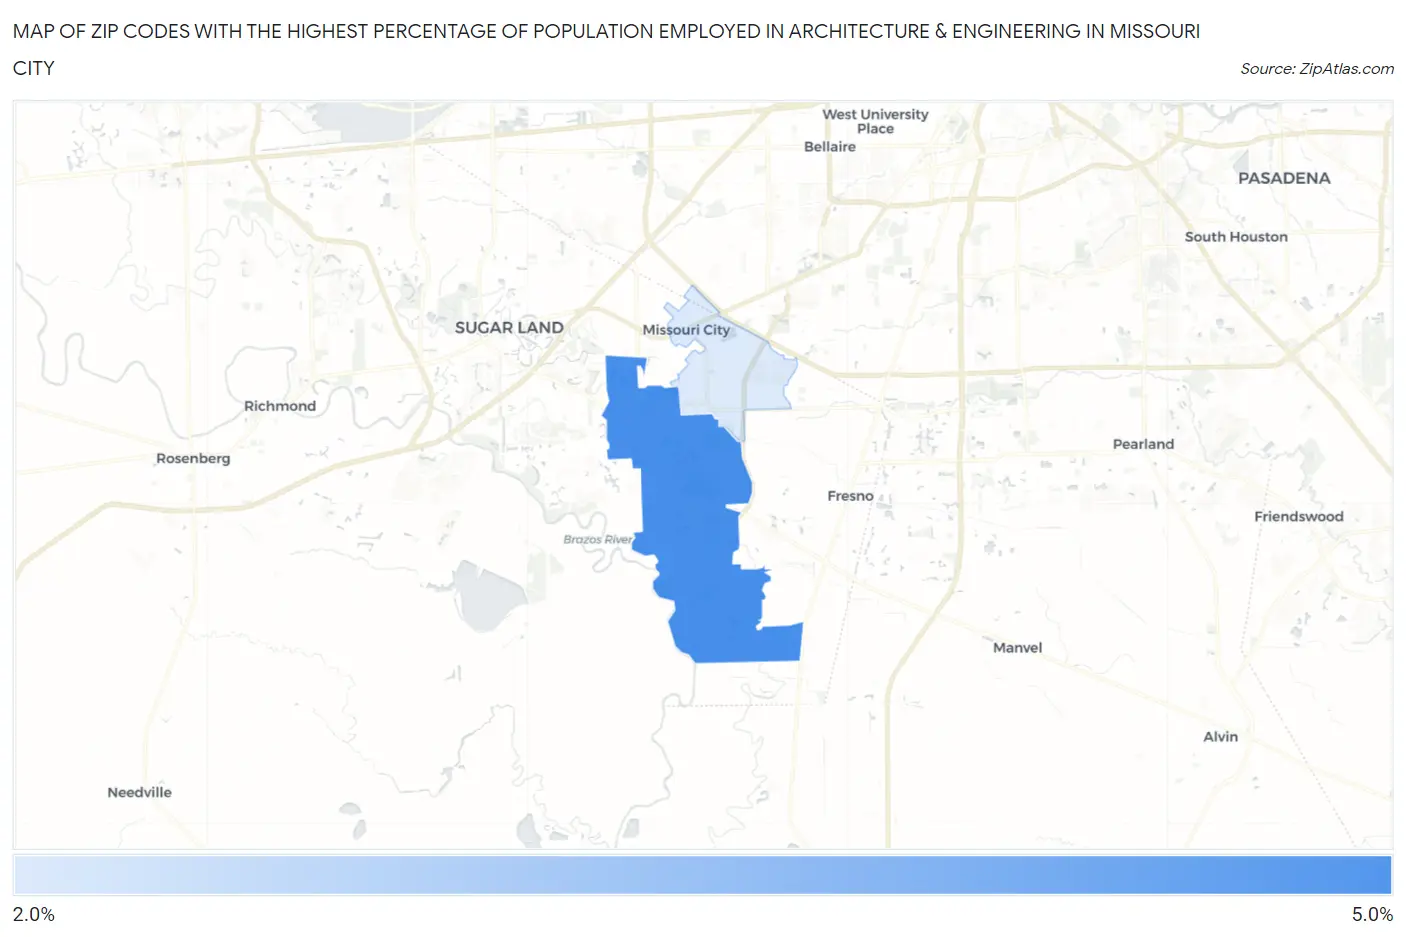
Map of Zip Codes with the Highest Percentage of Population Employed in Architecture & Engineering in Missouri City
0.0%
5.0%
Zip Codes with the Highest Percentage of Population Employed in Architecture & Engineering in Missouri City, TX
| Zip Code | % Employed | vs State | vs National | |
| 1. | 77459 | 5.0% | 2.2%(+2.76)#93 | 2.1%(+2.83)#1,677 |
| 2. | 77489 | 2.0% | 2.2%(-0.218)#523 | 2.1%(-0.145)#9,575 |
1
Common Questions
What are the Top Zip Codes with the Highest Percentage of Population Employed in Architecture & Engineering in Missouri City, TX?
Top Zip Codes with the Highest Percentage of Population Employed in Architecture & Engineering in Missouri City, TX are:
What zip code has the Highest Percentage of Population Employed in Architecture & Engineering in Missouri City, TX?
77459 has the Highest Percentage of Population Employed in Architecture & Engineering in Missouri City, TX with 5.0%.
What is the Percentage of Population Employed in Architecture & Engineering in Missouri City, TX?
Percentage of Population Employed in Architecture & Engineering in Missouri City is 3.8%.
What is the Percentage of Population Employed in Architecture & Engineering in Texas?
Percentage of Population Employed in Architecture & Engineering in Texas is 2.2%.
What is the Percentage of Population Employed in Architecture & Engineering in the United States?
Percentage of Population Employed in Architecture & Engineering in the United States is 2.1%.