Zip Codes with the Highest Percentage of Population Employed in Architecture & Engineering in Grand Prairie, TX
RELATED REPORTS & OPTIONS
Architecture & Engineering
Grand Prairie
Compare Zip Codes
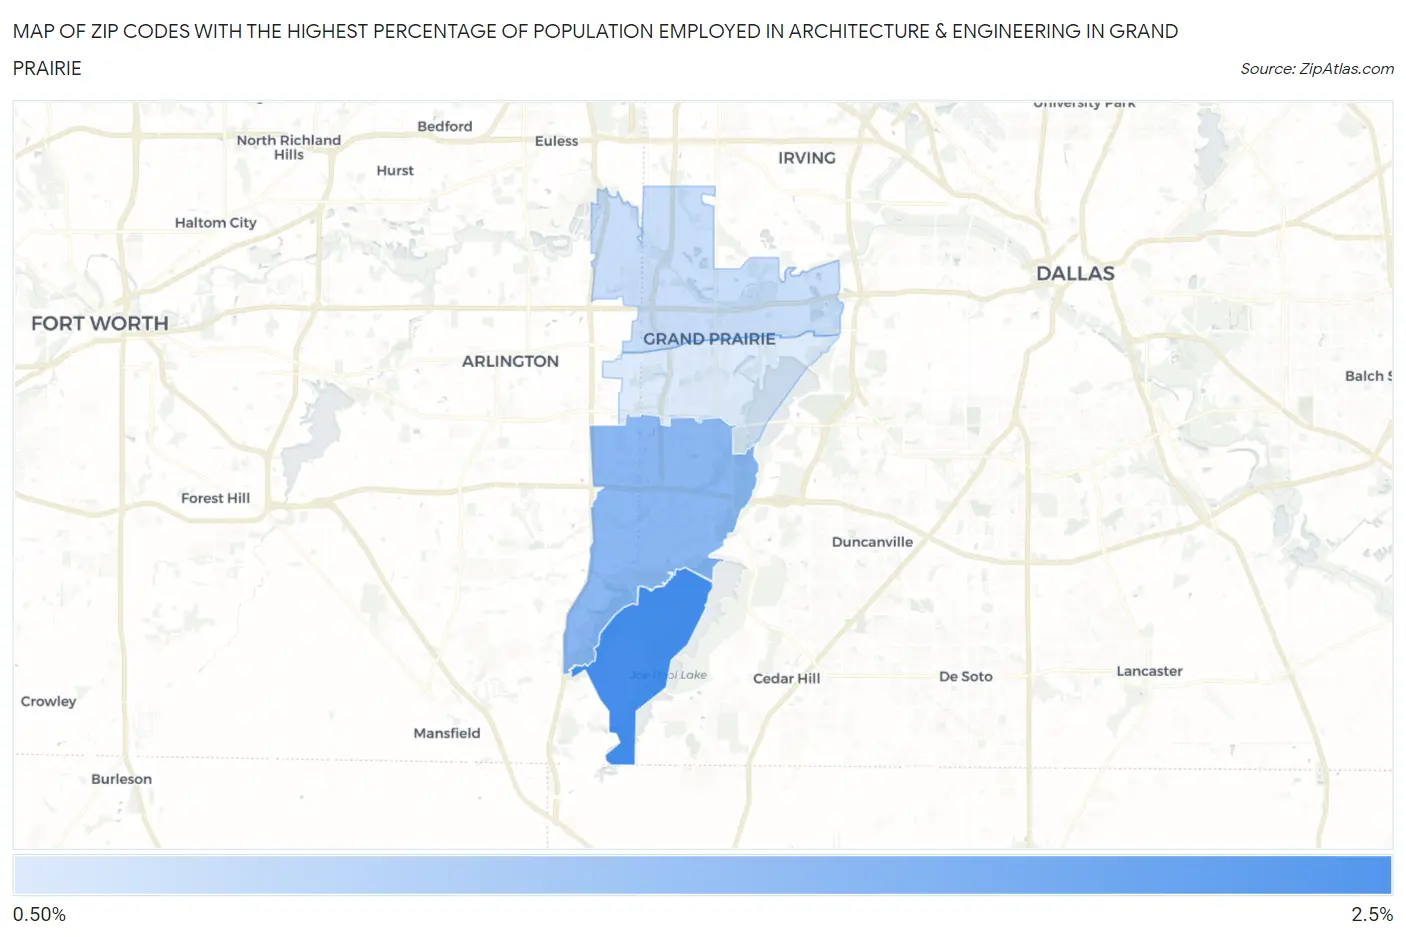
Map of Zip Codes with the Highest Percentage of Population Employed in Architecture & Engineering in Grand Prairie
0.0%
2.5%
Zip Codes with the Highest Percentage of Population Employed in Architecture & Engineering in Grand Prairie, TX
| Zip Code | % Employed | vs State | vs National | |
| 1. | 75054 | 2.4% | 2.2%(+0.201)#400 | 2.1%(+0.274)#7,360 |
| 2. | 75052 | 1.9% | 2.2%(-0.284)#547 | 2.1%(-0.211)#9,994 |
| 3. | 75050 | 1.5% | 2.2%(-0.746)#716 | 2.1%(-0.673)#13,049 |
| 4. | 75051 | 1.3% | 2.2%(-0.898)#765 | 2.1%(-0.825)#14,149 |
1
Common Questions
What are the Top 3 Zip Codes with the Highest Percentage of Population Employed in Architecture & Engineering in Grand Prairie, TX?
Top 3 Zip Codes with the Highest Percentage of Population Employed in Architecture & Engineering in Grand Prairie, TX are:
What zip code has the Highest Percentage of Population Employed in Architecture & Engineering in Grand Prairie, TX?
75054 has the Highest Percentage of Population Employed in Architecture & Engineering in Grand Prairie, TX with 2.4%.
What is the Percentage of Population Employed in Architecture & Engineering in Grand Prairie, TX?
Percentage of Population Employed in Architecture & Engineering in Grand Prairie is 1.8%.
What is the Percentage of Population Employed in Architecture & Engineering in Texas?
Percentage of Population Employed in Architecture & Engineering in Texas is 2.2%.
What is the Percentage of Population Employed in Architecture & Engineering in the United States?
Percentage of Population Employed in Architecture & Engineering in the United States is 2.1%.