Zip Codes with the Highest Percentage of Population Employed in Architecture & Engineering in Waxahachie, TX
RELATED REPORTS & OPTIONS
Architecture & Engineering
Waxahachie
Compare Zip Codes
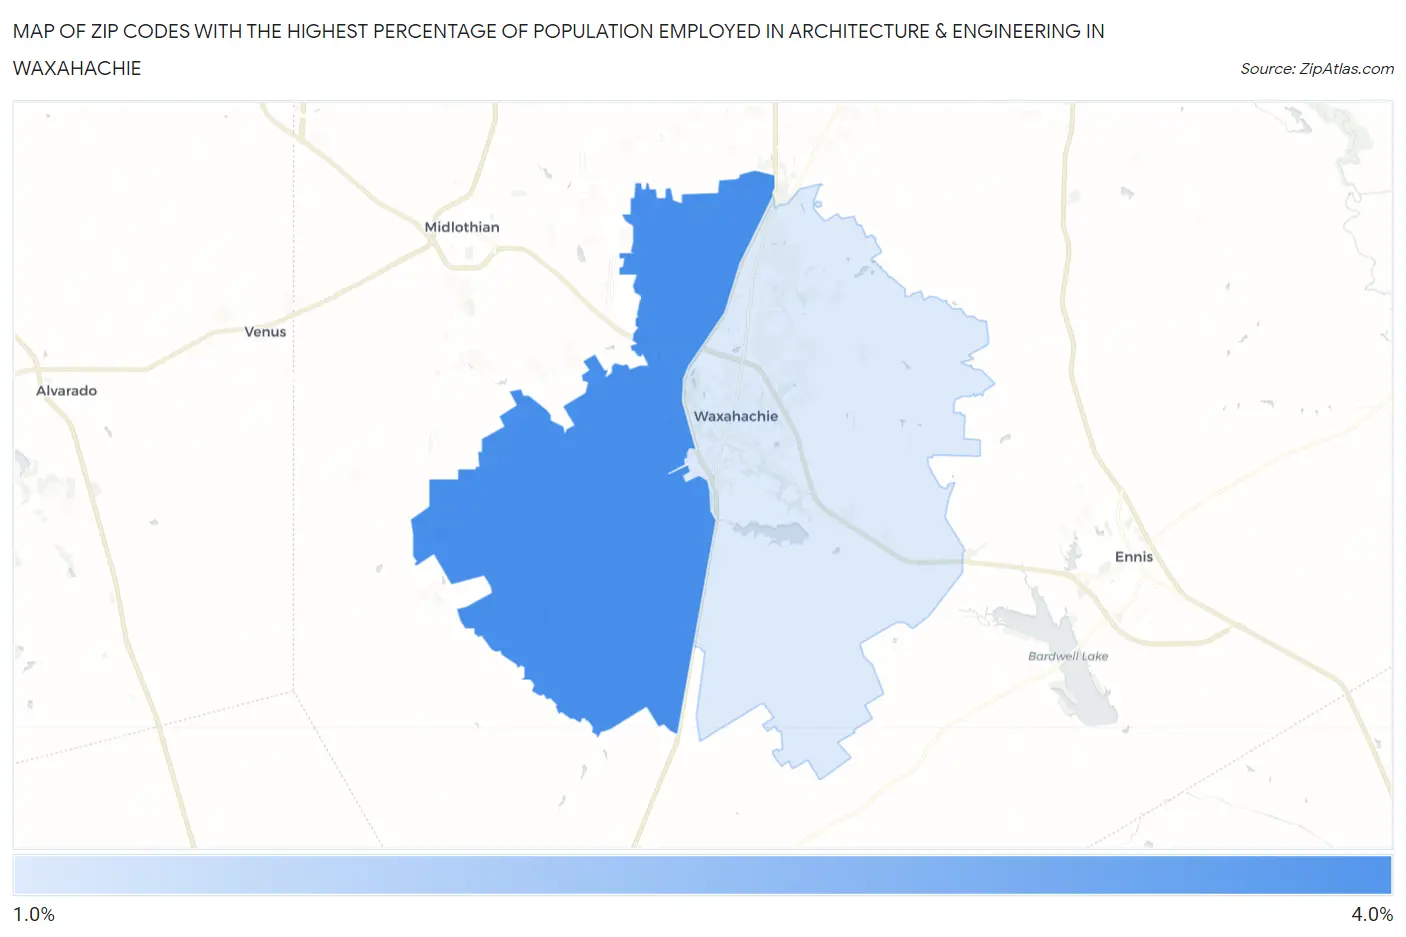
Map of Zip Codes with the Highest Percentage of Population Employed in Architecture & Engineering in Waxahachie
0.0%
4.0%
Zip Codes with the Highest Percentage of Population Employed in Architecture & Engineering in Waxahachie, TX
| Zip Code | % Employed | vs State | vs National | |
| 1. | 75167 | 3.3% | 2.2%(+1.05)#247 | 2.1%(+1.12)#4,263 |
| 2. | 75165 | 1.5% | 2.2%(-0.752)#718 | 2.1%(-0.679)#13,097 |
1
Common Questions
What are the Top Zip Codes with the Highest Percentage of Population Employed in Architecture & Engineering in Waxahachie, TX?
Top Zip Codes with the Highest Percentage of Population Employed in Architecture & Engineering in Waxahachie, TX are:
What zip code has the Highest Percentage of Population Employed in Architecture & Engineering in Waxahachie, TX?
75167 has the Highest Percentage of Population Employed in Architecture & Engineering in Waxahachie, TX with 3.3%.
What is the Percentage of Population Employed in Architecture & Engineering in Waxahachie, TX?
Percentage of Population Employed in Architecture & Engineering in Waxahachie is 1.6%.
What is the Percentage of Population Employed in Architecture & Engineering in Texas?
Percentage of Population Employed in Architecture & Engineering in Texas is 2.2%.
What is the Percentage of Population Employed in Architecture & Engineering in the United States?
Percentage of Population Employed in Architecture & Engineering in the United States is 2.1%.