Zip Codes with the Highest Percentage of Population Employed in Architecture & Engineering in Oklahoma
RELATED REPORTS & OPTIONS
Architecture & Engineering
Oklahoma
Compare Zip Codes
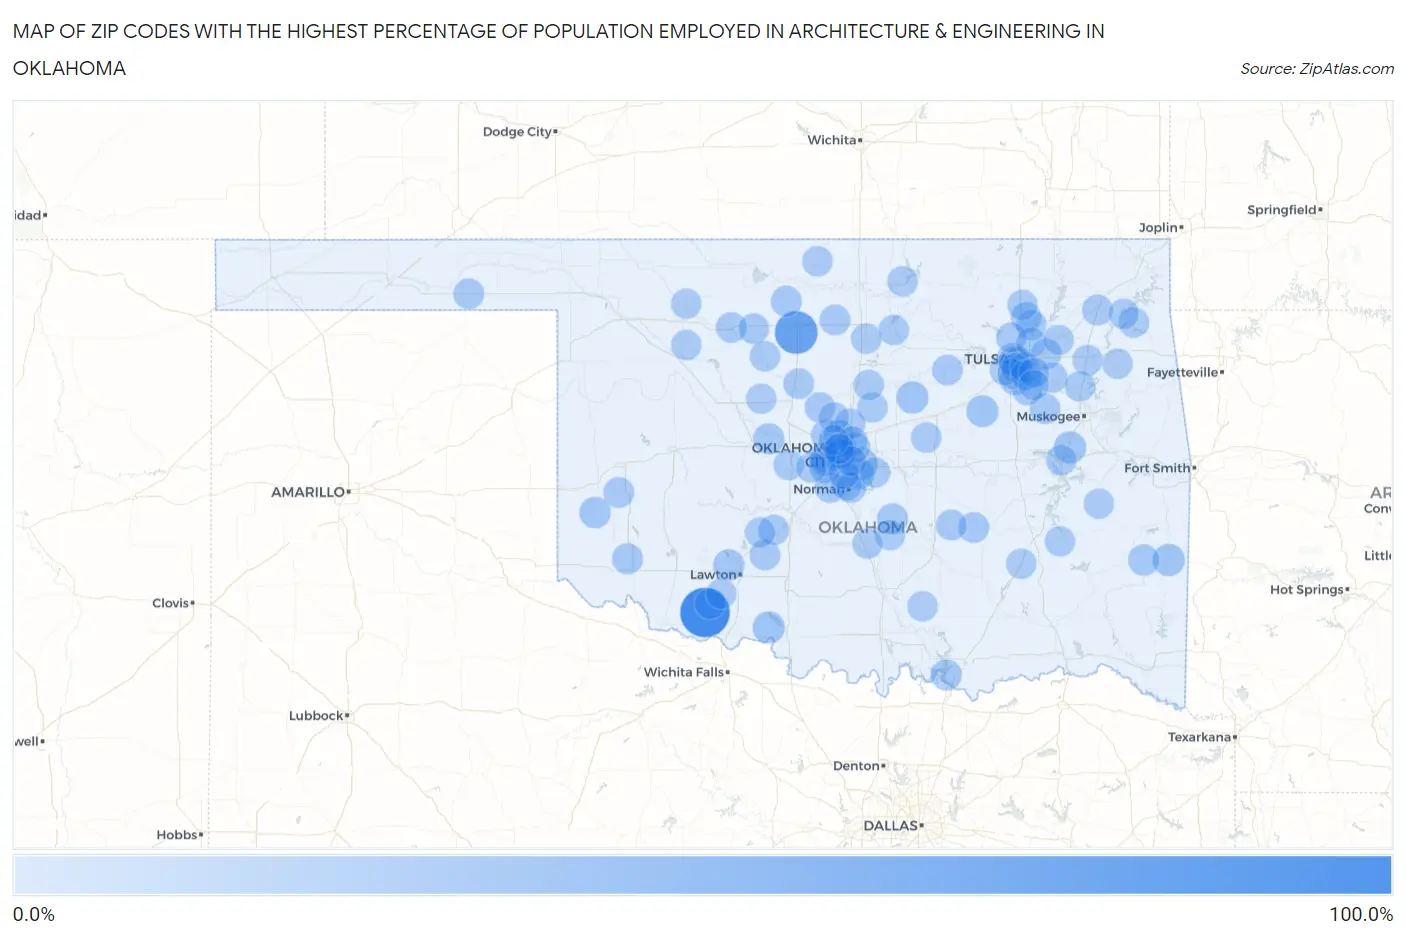
Map of Zip Codes with the Highest Percentage of Population Employed in Architecture & Engineering in Oklahoma
0.0%
100.0%
Zip Codes with the Highest Percentage of Population Employed in Architecture & Engineering in Oklahoma
| Zip Code | % Employed | vs State | vs National | |
| 1. | 73553 | 100.0% | 1.8%(+98.2)#1 | 2.1%(+97.9)#5 |
| 2. | 73705 | 65.4% | 1.8%(+63.5)#2 | 2.1%(+63.2)#9 |
| 3. | 73150 | 14.5% | 1.8%(+12.7)#3 | 2.1%(+12.4)#156 |
| 4. | 74939 | 12.1% | 1.8%(+10.3)#4 | 2.1%(+9.97)#236 |
| 5. | 74459 | 12.0% | 1.8%(+10.2)#5 | 2.1%(+9.85)#240 |
| 6. | 73548 | 11.7% | 1.8%(+9.89)#6 | 2.1%(+9.58)#252 |
| 7. | 74824 | 11.7% | 1.8%(+9.83)#7 | 2.1%(+9.52)#253 |
| 8. | 73102 | 10.7% | 1.8%(+8.91)#8 | 2.1%(+8.60)#295 |
| 9. | 74071 | 10.0% | 1.8%(+8.16)#9 | 2.1%(+7.85)#341 |
| 10. | 74103 | 8.9% | 1.8%(+7.07)#10 | 2.1%(+6.75)#433 |
| 11. | 73673 | 8.5% | 1.8%(+6.62)#11 | 2.1%(+6.31)#487 |
| 12. | 73503 | 7.4% | 1.8%(+5.59)#12 | 2.1%(+5.28)#667 |
| 13. | 74577 | 7.3% | 1.8%(+5.43)#13 | 2.1%(+5.12)#694 |
| 14. | 73014 | 7.0% | 1.8%(+5.19)#14 | 2.1%(+4.88)#743 |
| 15. | 74731 | 6.6% | 1.8%(+4.73)#15 | 2.1%(+4.42)#863 |
| 16. | 73165 | 6.0% | 1.8%(+4.21)#16 | 2.1%(+3.90)#1,060 |
| 17. | 73169 | 5.9% | 1.8%(+4.06)#17 | 2.1%(+3.75)#1,133 |
| 18. | 74878 | 5.7% | 1.8%(+3.89)#18 | 2.1%(+3.58)#1,205 |
| 19. | 73556 | 5.5% | 1.8%(+3.62)#19 | 2.1%(+3.31)#1,359 |
| 20. | 73103 | 5.4% | 1.8%(+3.60)#20 | 2.1%(+3.29)#1,368 |
| 21. | 73743 | 5.4% | 1.8%(+3.57)#21 | 2.1%(+3.26)#1,385 |
| 22. | 74332 | 5.4% | 1.8%(+3.55)#22 | 2.1%(+3.23)#1,398 |
| 23. | 73627 | 5.4% | 1.8%(+3.52)#23 | 2.1%(+3.21)#1,415 |
| 24. | 73528 | 5.2% | 1.8%(+3.35)#24 | 2.1%(+3.04)#1,524 |
| 25. | 74827 | 5.2% | 1.8%(+3.32)#25 | 2.1%(+3.01)#1,556 |
| 26. | 73738 | 4.8% | 1.8%(+2.98)#26 | 2.1%(+2.67)#1,819 |
| 27. | 73128 | 4.8% | 1.8%(+2.93)#27 | 2.1%(+2.62)#1,860 |
| 28. | 73065 | 4.7% | 1.8%(+2.84)#28 | 2.1%(+2.53)#1,957 |
| 29. | 73105 | 4.6% | 1.8%(+2.79)#29 | 2.1%(+2.48)#1,997 |
| 30. | 74867 | 4.4% | 1.8%(+2.57)#30 | 2.1%(+2.26)#2,242 |
| 31. | 73729 | 4.3% | 1.8%(+2.51)#31 | 2.1%(+2.20)#2,322 |
| 32. | 74436 | 4.2% | 1.8%(+2.37)#32 | 2.1%(+2.06)#2,477 |
| 33. | 73142 | 4.2% | 1.8%(+2.32)#33 | 2.1%(+2.00)#2,549 |
| 34. | 73734 | 4.0% | 1.8%(+2.15)#34 | 2.1%(+1.84)#2,790 |
| 35. | 73931 | 4.0% | 1.8%(+2.15)#35 | 2.1%(+1.83)#2,793 |
| 36. | 74082 | 4.0% | 1.8%(+2.14)#36 | 2.1%(+1.83)#2,805 |
| 37. | 73058 | 3.9% | 1.8%(+2.11)#37 | 2.1%(+1.80)#2,851 |
| 38. | 74037 | 3.9% | 1.8%(+2.02)#38 | 2.1%(+1.71)#2,994 |
| 39. | 73768 | 3.7% | 1.8%(+1.84)#39 | 2.1%(+1.53)#3,334 |
| 40. | 73013 | 3.7% | 1.8%(+1.84)#40 | 2.1%(+1.53)#3,338 |
| 41. | 73567 | 3.7% | 1.8%(+1.82)#41 | 2.1%(+1.51)#3,374 |
| 42. | 73104 | 3.7% | 1.8%(+1.82)#42 | 2.1%(+1.51)#3,378 |
| 43. | 74869 | 3.6% | 1.8%(+1.81)#43 | 2.1%(+1.50)#3,405 |
| 44. | 73034 | 3.6% | 1.8%(+1.76)#44 | 2.1%(+1.45)#3,512 |
| 45. | 73016 | 3.6% | 1.8%(+1.73)#45 | 2.1%(+1.41)#3,582 |
| 46. | 73179 | 3.5% | 1.8%(+1.71)#46 | 2.1%(+1.40)#3,619 |
| 47. | 73718 | 3.5% | 1.8%(+1.71)#47 | 2.1%(+1.40)#3,624 |
| 48. | 74052 | 3.5% | 1.8%(+1.70)#48 | 2.1%(+1.39)#3,633 |
| 49. | 73017 | 3.5% | 1.8%(+1.66)#49 | 2.1%(+1.35)#3,748 |
| 50. | 73077 | 3.5% | 1.8%(+1.65)#50 | 2.1%(+1.34)#3,768 |
| 51. | 73069 | 3.5% | 1.8%(+1.62)#51 | 2.1%(+1.31)#3,833 |
| 52. | 74021 | 3.4% | 1.8%(+1.60)#52 | 2.1%(+1.29)#3,873 |
| 53. | 73090 | 3.4% | 1.8%(+1.60)#53 | 2.1%(+1.29)#3,891 |
| 54. | 74831 | 3.4% | 1.8%(+1.60)#54 | 2.1%(+1.28)#3,893 |
| 55. | 74114 | 3.4% | 1.8%(+1.53)#55 | 2.1%(+1.22)#4,027 |
| 56. | 74008 | 3.3% | 1.8%(+1.49)#56 | 2.1%(+1.18)#4,132 |
| 57. | 73027 | 3.3% | 1.8%(+1.45)#57 | 2.1%(+1.14)#4,219 |
| 58. | 74452 | 3.3% | 1.8%(+1.44)#58 | 2.1%(+1.13)#4,257 |
| 59. | 73071 | 3.2% | 1.8%(+1.40)#59 | 2.1%(+1.09)#4,348 |
| 60. | 74015 | 3.2% | 1.8%(+1.38)#60 | 2.1%(+1.06)#4,428 |
| 61. | 74050 | 3.2% | 1.8%(+1.34)#61 | 2.1%(+1.03)#4,511 |
| 62. | 74014 | 3.2% | 1.8%(+1.32)#62 | 2.1%(+1.01)#4,585 |
| 63. | 74119 | 3.2% | 1.8%(+1.32)#63 | 2.1%(+1.01)#4,587 |
| 64. | 74105 | 3.0% | 1.8%(+1.21)#64 | 2.1%(+0.899)#4,897 |
| 65. | 74604 | 3.0% | 1.8%(+1.19)#65 | 2.1%(+0.874)#4,978 |
| 66. | 73064 | 3.0% | 1.8%(+1.15)#66 | 2.1%(+0.842)#5,085 |
| 67. | 73838 | 3.0% | 1.8%(+1.11)#67 | 2.1%(+0.802)#5,234 |
| 68. | 74132 | 2.9% | 1.8%(+1.10)#68 | 2.1%(+0.793)#5,267 |
| 69. | 73061 | 2.9% | 1.8%(+1.09)#69 | 2.1%(+0.778)#5,328 |
| 70. | 74145 | 2.9% | 1.8%(+1.09)#70 | 2.1%(+0.776)#5,337 |
| 71. | 73759 | 2.9% | 1.8%(+1.09)#71 | 2.1%(+0.775)#5,341 |
| 72. | 74061 | 2.9% | 1.8%(+1.07)#72 | 2.1%(+0.763)#5,385 |
| 73. | 74133 | 2.9% | 1.8%(+1.07)#73 | 2.1%(+0.759)#5,389 |
| 74. | 73540 | 2.9% | 1.8%(+1.02)#74 | 2.1%(+0.708)#5,560 |
| 75. | 74012 | 2.8% | 1.8%(+0.983)#75 | 2.1%(+0.672)#5,702 |
| 76. | 74337 | 2.8% | 1.8%(+0.979)#76 | 2.1%(+0.668)#5,720 |
| 77. | 74546 | 2.8% | 1.8%(+0.979)#77 | 2.1%(+0.668)#5,723 |
| 78. | 73860 | 2.8% | 1.8%(+0.971)#78 | 2.1%(+0.660)#5,760 |
| 79. | 73025 | 2.8% | 1.8%(+0.936)#79 | 2.1%(+0.625)#5,884 |
| 80. | 74342 | 2.7% | 1.8%(+0.904)#80 | 2.1%(+0.592)#5,995 |
| 81. | 73160 | 2.7% | 1.8%(+0.869)#81 | 2.1%(+0.558)#6,125 |
| 82. | 74426 | 2.7% | 1.8%(+0.867)#82 | 2.1%(+0.556)#6,134 |
| 83. | 74553 | 2.7% | 1.8%(+0.859)#83 | 2.1%(+0.548)#6,175 |
| 84. | 74011 | 2.7% | 1.8%(+0.850)#84 | 2.1%(+0.539)#6,212 |
| 85. | 74073 | 2.7% | 1.8%(+0.833)#85 | 2.1%(+0.522)#6,280 |
| 86. | 73074 | 2.7% | 1.8%(+0.815)#86 | 2.1%(+0.504)#6,353 |
| 87. | 73141 | 2.6% | 1.8%(+0.801)#87 | 2.1%(+0.490)#6,412 |
| 88. | 73764 | 2.6% | 1.8%(+0.793)#88 | 2.1%(+0.482)#6,438 |
| 89. | 74856 | 2.6% | 1.8%(+0.780)#89 | 2.1%(+0.469)#6,500 |
| 90. | 73151 | 2.6% | 1.8%(+0.773)#90 | 2.1%(+0.462)#6,528 |
| 91. | 73145 | 2.6% | 1.8%(+0.771)#91 | 2.1%(+0.459)#6,539 |
| 92. | 74055 | 2.6% | 1.8%(+0.759)#92 | 2.1%(+0.448)#6,581 |
| 93. | 74019 | 2.6% | 1.8%(+0.738)#93 | 2.1%(+0.426)#6,679 |
| 94. | 74340 | 2.6% | 1.8%(+0.726)#94 | 2.1%(+0.415)#6,732 |
| 95. | 74552 | 2.6% | 1.8%(+0.719)#95 | 2.1%(+0.408)#6,754 |
| 96. | 73029 | 2.5% | 1.8%(+0.703)#96 | 2.1%(+0.392)#6,831 |
| 97. | 74467 | 2.5% | 1.8%(+0.692)#97 | 2.1%(+0.381)#6,871 |
| 98. | 73120 | 2.5% | 1.8%(+0.681)#98 | 2.1%(+0.370)#6,914 |
| 99. | 73118 | 2.5% | 1.8%(+0.679)#99 | 2.1%(+0.368)#6,926 |
| 100. | 74857 | 2.5% | 1.8%(+0.669)#100 | 2.1%(+0.358)#6,956 |
Common Questions
What are the Top 10 Zip Codes with the Highest Percentage of Population Employed in Architecture & Engineering in Oklahoma?
Top 10 Zip Codes with the Highest Percentage of Population Employed in Architecture & Engineering in Oklahoma are:
What zip code has the Highest Percentage of Population Employed in Architecture & Engineering in Oklahoma?
73553 has the Highest Percentage of Population Employed in Architecture & Engineering in Oklahoma with 100.0%.
What is the Percentage of Population Employed in Architecture & Engineering in the State of Oklahoma?
Percentage of Population Employed in Architecture & Engineering in Oklahoma is 1.8%.
What is the Percentage of Population Employed in Architecture & Engineering in the United States?
Percentage of Population Employed in Architecture & Engineering in the United States is 2.1%.