Zip Codes with the Highest Percentage of Population Employed in Architecture & Engineering in Leander, TX
RELATED REPORTS & OPTIONS
Architecture & Engineering
Leander
Compare Zip Codes
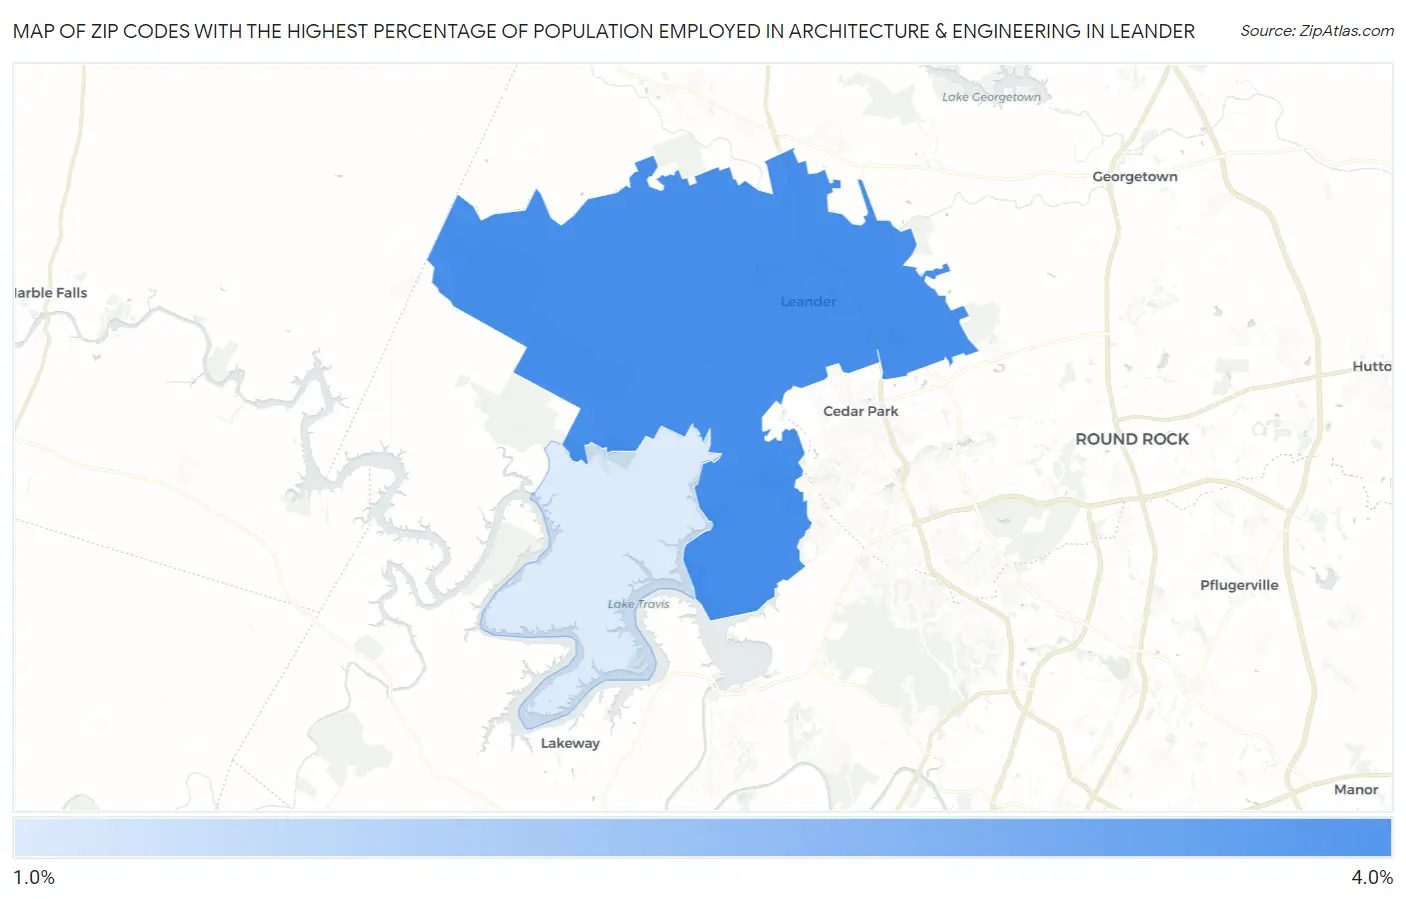
Map of Zip Codes with the Highest Percentage of Population Employed in Architecture & Engineering in Leander
0.0%
4.0%
Zip Codes with the Highest Percentage of Population Employed in Architecture & Engineering in Leander, TX
| Zip Code | % Employed | vs State | vs National | |
| 1. | 78641 | 3.6% | 2.2%(+1.39)#199 | 2.1%(+1.46)#3,496 |
| 2. | 78645 | 1.3% | 2.2%(-0.898)#766 | 2.1%(-0.825)#14,151 |
1
Common Questions
What are the Top Zip Codes with the Highest Percentage of Population Employed in Architecture & Engineering in Leander, TX?
Top Zip Codes with the Highest Percentage of Population Employed in Architecture & Engineering in Leander, TX are:
What zip code has the Highest Percentage of Population Employed in Architecture & Engineering in Leander, TX?
78641 has the Highest Percentage of Population Employed in Architecture & Engineering in Leander, TX with 3.6%.
What is the Percentage of Population Employed in Architecture & Engineering in Leander, TX?
Percentage of Population Employed in Architecture & Engineering in Leander is 3.7%.
What is the Percentage of Population Employed in Architecture & Engineering in Texas?
Percentage of Population Employed in Architecture & Engineering in Texas is 2.2%.
What is the Percentage of Population Employed in Architecture & Engineering in the United States?
Percentage of Population Employed in Architecture & Engineering in the United States is 2.1%.