Zip Codes with the Highest Percentage of Population Employed in Life, Physical & Social Science in Leander, TX
RELATED REPORTS & OPTIONS
Life, Physical & Social Science
Leander
Compare Zip Codes
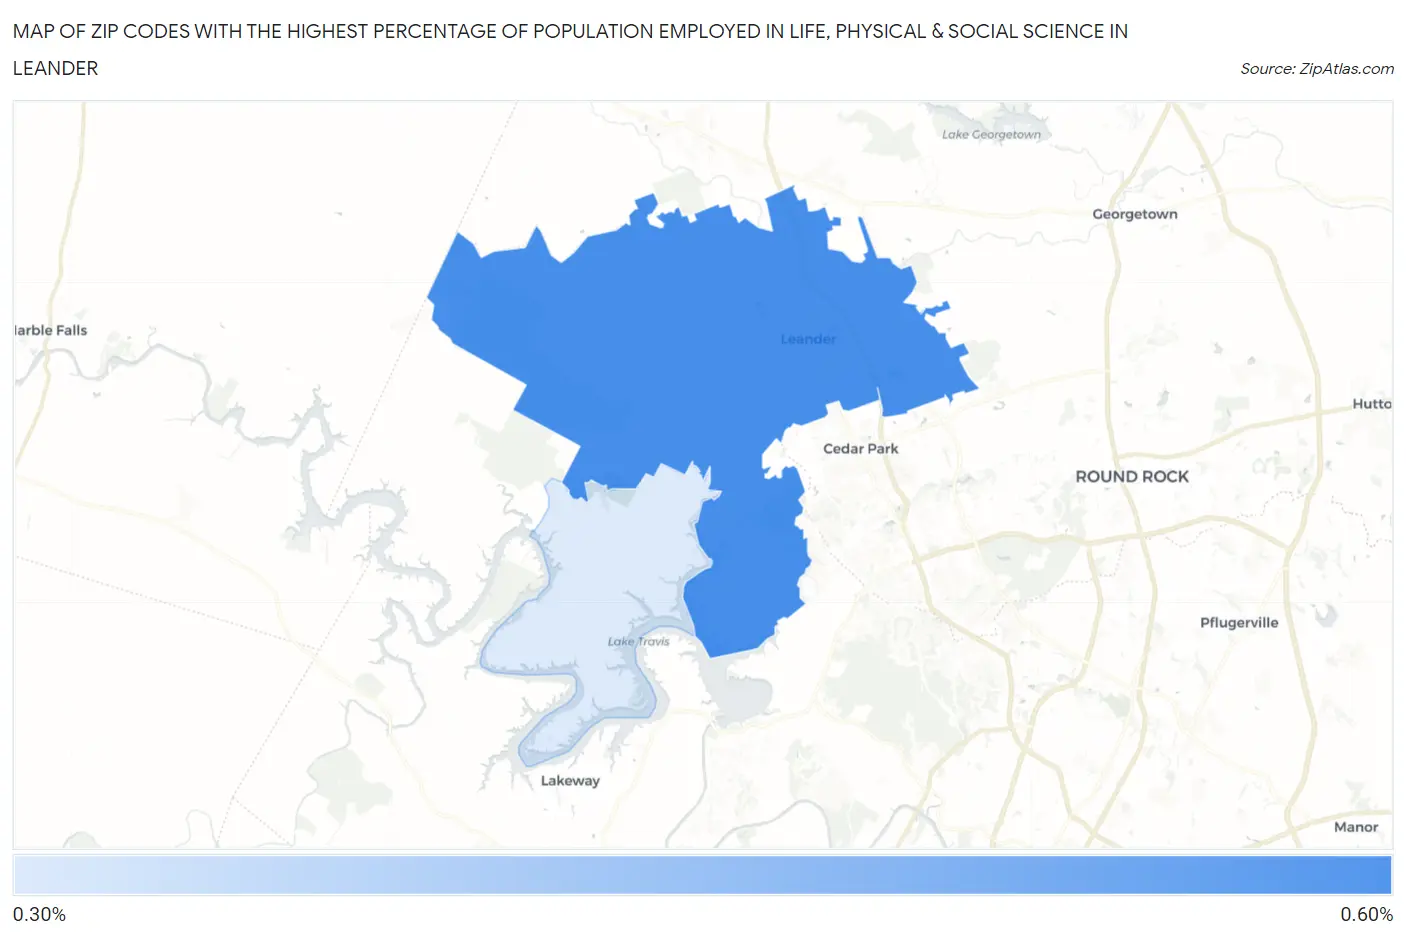
Map of Zip Codes with the Highest Percentage of Population Employed in Life, Physical & Social Science in Leander
0.0%
0.60%
Zip Codes with the Highest Percentage of Population Employed in Life, Physical & Social Science in Leander, TX
| Zip Code | % Employed | vs State | vs National | |
| 1. | 78641 | 0.57% | 0.84%(-0.274)#678 | 1.1%(-0.523)#13,668 |
| 2. | 78645 | 0.32% | 0.84%(-0.523)#897 | 1.1%(-0.771)#16,810 |
1
Common Questions
What are the Top Zip Codes with the Highest Percentage of Population Employed in Life, Physical & Social Science in Leander, TX?
Top Zip Codes with the Highest Percentage of Population Employed in Life, Physical & Social Science in Leander, TX are:
What zip code has the Highest Percentage of Population Employed in Life, Physical & Social Science in Leander, TX?
78641 has the Highest Percentage of Population Employed in Life, Physical & Social Science in Leander, TX with 0.57%.
What is the Percentage of Population Employed in Life, Physical & Social Science in Leander, TX?
Percentage of Population Employed in Life, Physical & Social Science in Leander is 0.68%.
What is the Percentage of Population Employed in Life, Physical & Social Science in Texas?
Percentage of Population Employed in Life, Physical & Social Science in Texas is 0.84%.
What is the Percentage of Population Employed in Life, Physical & Social Science in the United States?
Percentage of Population Employed in Life, Physical & Social Science in the United States is 1.1%.