Zip Codes with the Highest Percentage of Population Employed in Life, Physical & Social Science in Harlingen, TX
RELATED REPORTS & OPTIONS
Life, Physical & Social Science
Harlingen
Compare Zip Codes
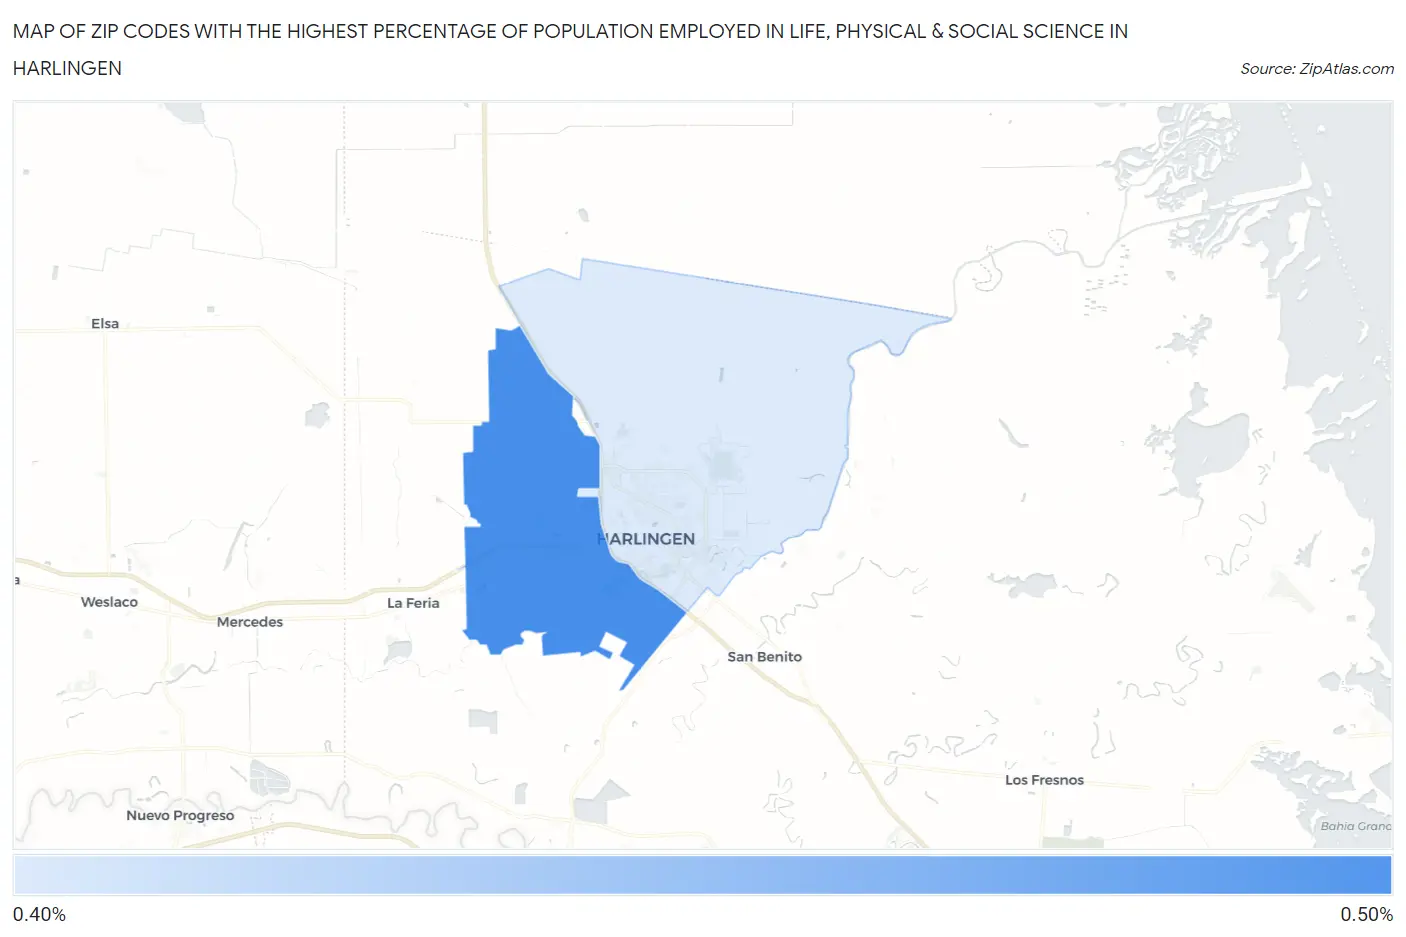
Map of Zip Codes with the Highest Percentage of Population Employed in Life, Physical & Social Science in Harlingen
0.0%
0.50%
Zip Codes with the Highest Percentage of Population Employed in Life, Physical & Social Science in Harlingen, TX
| Zip Code | % Employed | vs State | vs National | |
| 1. | 78552 | 0.48% | 0.84%(-0.367)#758 | 1.1%(-0.616)#14,841 |
| 2. | 78550 | 0.41% | 0.84%(-0.432)#814 | 1.1%(-0.681)#15,617 |
1
Common Questions
What are the Top Zip Codes with the Highest Percentage of Population Employed in Life, Physical & Social Science in Harlingen, TX?
Top Zip Codes with the Highest Percentage of Population Employed in Life, Physical & Social Science in Harlingen, TX are:
What zip code has the Highest Percentage of Population Employed in Life, Physical & Social Science in Harlingen, TX?
78552 has the Highest Percentage of Population Employed in Life, Physical & Social Science in Harlingen, TX with 0.48%.
What is the Percentage of Population Employed in Life, Physical & Social Science in Harlingen, TX?
Percentage of Population Employed in Life, Physical & Social Science in Harlingen is 0.36%.
What is the Percentage of Population Employed in Life, Physical & Social Science in Texas?
Percentage of Population Employed in Life, Physical & Social Science in Texas is 0.84%.
What is the Percentage of Population Employed in Life, Physical & Social Science in the United States?
Percentage of Population Employed in Life, Physical & Social Science in the United States is 1.1%.