Zip Codes with the Highest Percentage of Population Employed in Life, Physical & Social Science in Mission, TX
RELATED REPORTS & OPTIONS
Life, Physical & Social Science
Mission
Compare Zip Codes
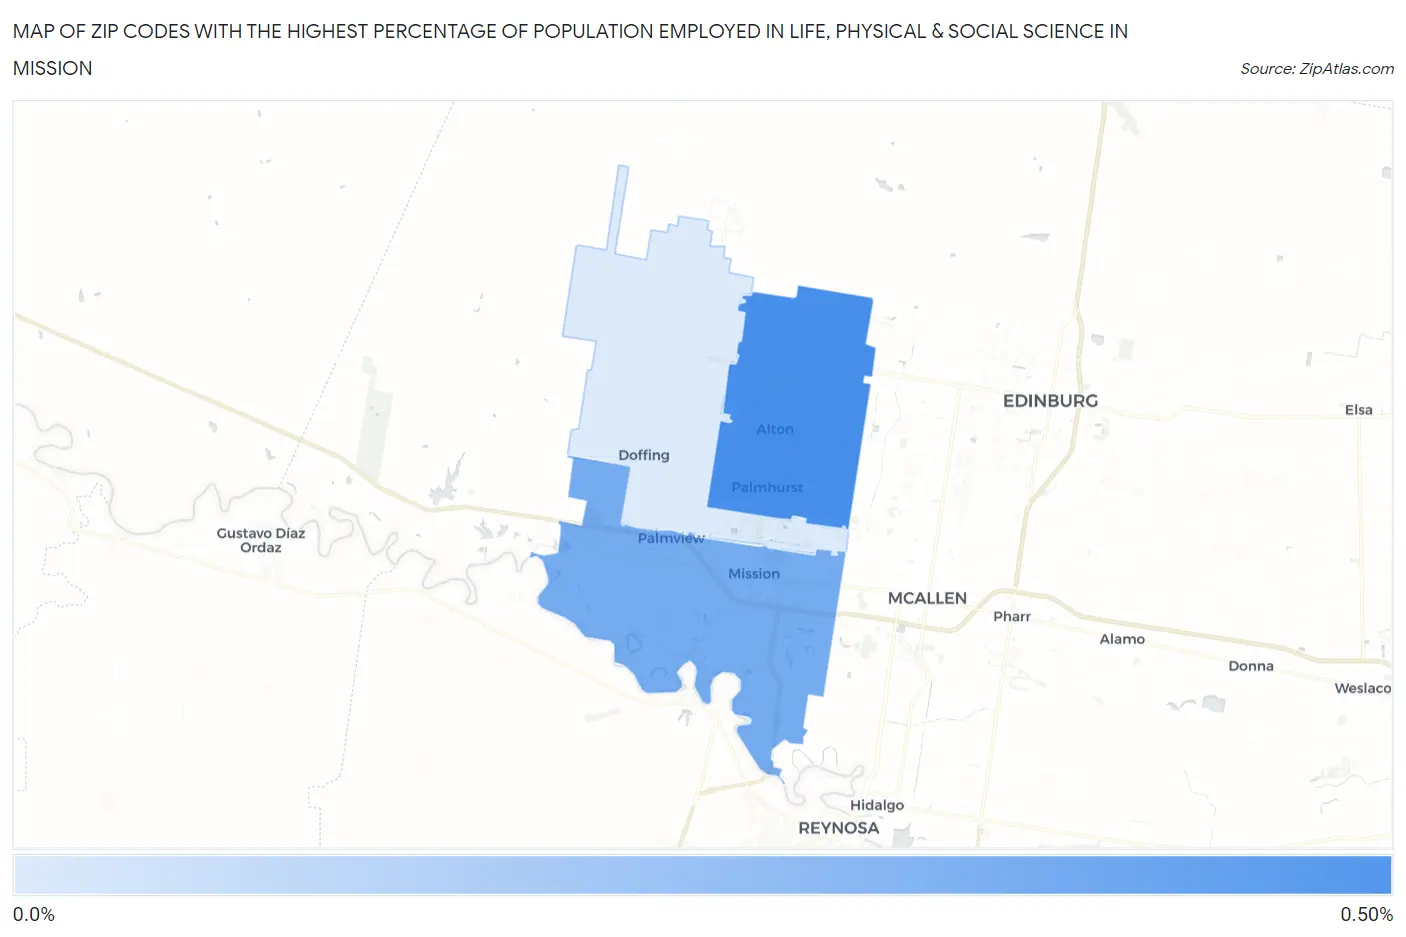
Map of Zip Codes with the Highest Percentage of Population Employed in Life, Physical & Social Science in Mission
0.0%
0.50%
Zip Codes with the Highest Percentage of Population Employed in Life, Physical & Social Science in Mission, TX
| Zip Code | % Employed | vs State | vs National | |
| 1. | 78573 | 0.40% | 0.84%(-0.441)#821 | 1.1%(-0.689)#15,733 |
| 2. | 78572 | 0.30% | 0.84%(-0.547)#920 | 1.1%(-0.796)#17,123 |
| 3. | 78574 | 0.048% | 0.84%(-0.795)#1,112 | 1.1%(-1.04)#19,345 |
1
Common Questions
What are the Top Zip Codes with the Highest Percentage of Population Employed in Life, Physical & Social Science in Mission, TX?
Top Zip Codes with the Highest Percentage of Population Employed in Life, Physical & Social Science in Mission, TX are:
What zip code has the Highest Percentage of Population Employed in Life, Physical & Social Science in Mission, TX?
78573 has the Highest Percentage of Population Employed in Life, Physical & Social Science in Mission, TX with 0.40%.
What is the Percentage of Population Employed in Life, Physical & Social Science in Mission, TX?
Percentage of Population Employed in Life, Physical & Social Science in Mission is 0.28%.
What is the Percentage of Population Employed in Life, Physical & Social Science in Texas?
Percentage of Population Employed in Life, Physical & Social Science in Texas is 0.84%.
What is the Percentage of Population Employed in Life, Physical & Social Science in the United States?
Percentage of Population Employed in Life, Physical & Social Science in the United States is 1.1%.