McCord, OK
McCord Map
McCord Overview
1,625
TOTAL POPULATION
863
MALE POPULATION
762
FEMALE POPULATION
113.25
MALES / 100 FEMALES
88.30
FEMALES / 100 MALES
47.2
MEDIAN AGE
3.5
AVG FAMILY SIZE
2.9
AVG HOUSEHOLD SIZE
$37,324
PER CAPITA INCOME
$80,000
AVG FAMILY INCOME
$66,080
AVG HOUSEHOLD INCOME
66.9%
WAGE / INCOME GAP [ % ]
33.1¢/ $1
WAGE / INCOME GAP [ $ ]
$11,550
FAMILY INCOME DEFICIT
0.44
INEQUALITY / GINI INDEX
747
LABOR FORCE [ PEOPLE ]
56.3%
PERCENT IN LABOR FORCE
9.8%
UNEMPLOYMENT RATE
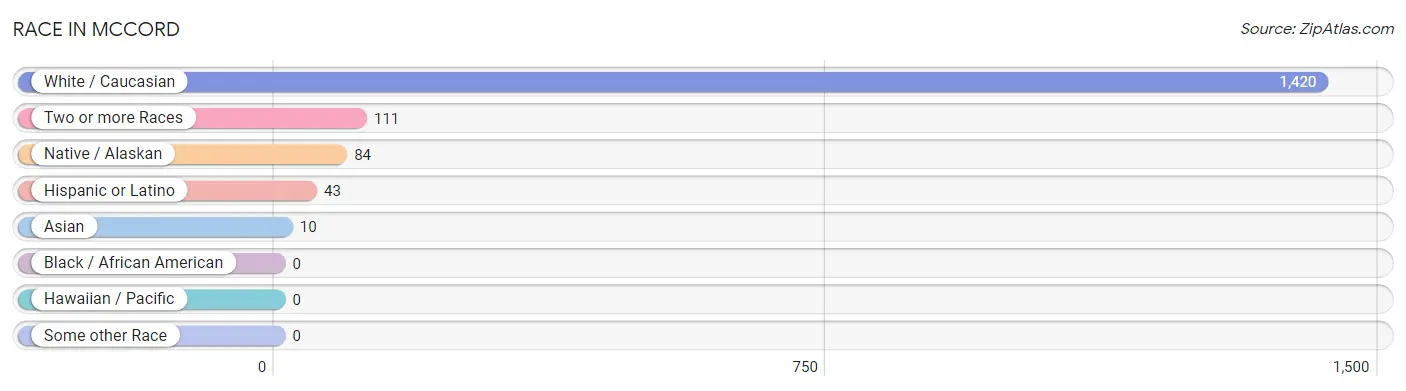
Race in McCord
The most populous races in McCord are White / Caucasian (1,420 | 87.4%), Two or more Races (111 | 6.8%), and Native / Alaskan (84 | 5.2%).
| Race | # Population | % Population |
| Asian | 10 | 0.6% |
| Black / African American | 0 | 0.0% |
| Hawaiian / Pacific | 0 | 0.0% |
| Hispanic or Latino | 43 | 2.6% |
| Native / Alaskan | 84 | 5.2% |
| White / Caucasian | 1,420 | 87.4% |
| Two or more Races | 111 | 6.8% |
| Some other Race | 0 | 0.0% |
| Total | 1,625 | 100.0% |
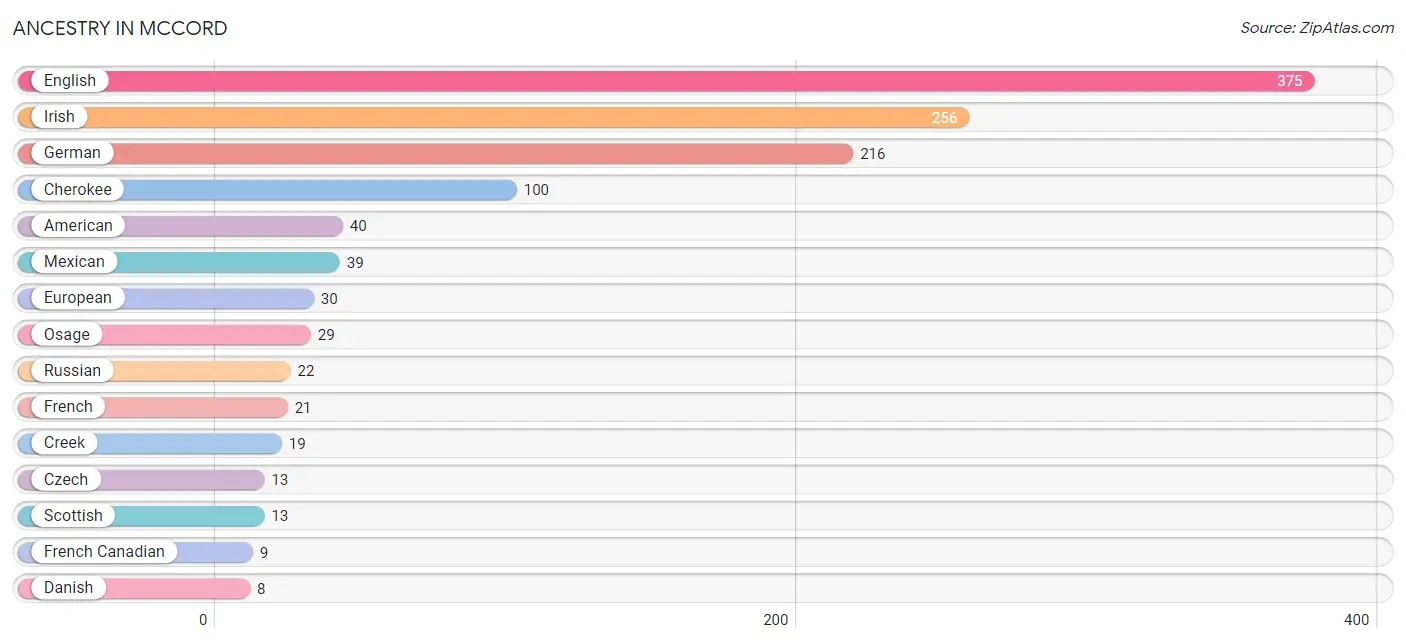
Ancestry in McCord
The most populous ancestries reported in McCord are English (375 | 23.1%), Irish (256 | 15.8%), German (216 | 13.3%), Cherokee (100 | 6.1%), and American (40 | 2.5%), together accounting for 60.7% of all McCord residents.
| Ancestry | # Population | % Population |
| American | 40 | 2.5% |
| Central American | 4 | 0.3% |
| Cherokee | 100 | 6.1% |
| Chickasaw | 2 | 0.1% |
| Choctaw | 2 | 0.1% |
| Creek | 19 | 1.2% |
| Czech | 13 | 0.8% |
| Danish | 8 | 0.5% |
| Dutch | 8 | 0.5% |
| Dutch West Indian | 5 | 0.3% |
| English | 375 | 23.1% |
| European | 30 | 1.8% |
| French | 21 | 1.3% |
| French Canadian | 9 | 0.5% |
| German | 216 | 13.3% |
| Hungarian | 5 | 0.3% |
| Irish | 256 | 15.8% |
| Italian | 6 | 0.4% |
| Korean | 8 | 0.5% |
| Mexican | 39 | 2.4% |
| Osage | 29 | 1.8% |
| Polish | 4 | 0.3% |
| Russian | 22 | 1.3% |
| Salvadoran | 4 | 0.3% |
| Scotch-Irish | 5 | 0.3% |
| Scottish | 13 | 0.8% |
| Sri Lankan | 4 | 0.3% |
| Ukrainian | 4 | 0.3% | View All 28 Rows |
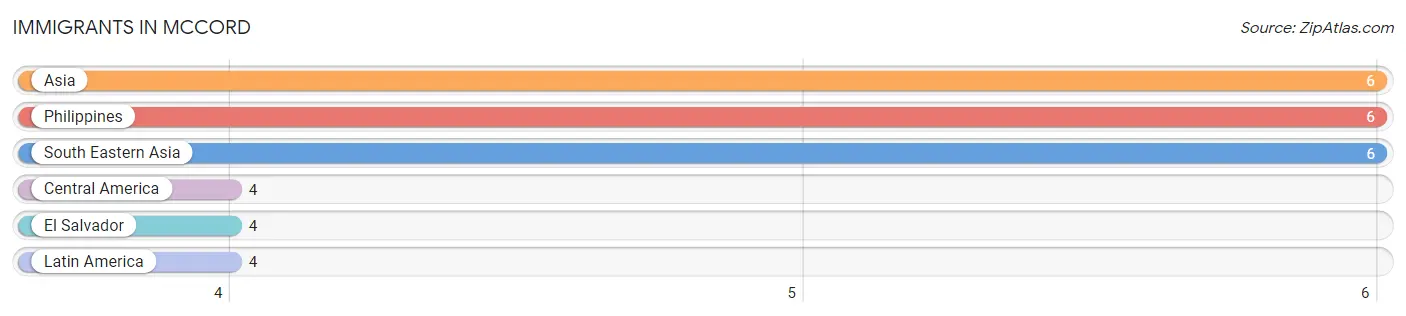
Immigrants in McCord
The most numerous immigrant groups reported in McCord came from Asia (6 | 0.4%), Philippines (6 | 0.4%), South Eastern Asia (6 | 0.4%), Central America (4 | 0.3%), and El Salvador (4 | 0.3%), together accounting for 1.6% of all McCord residents.
| Immigration Origin | # Population | % Population |
| Asia | 6 | 0.4% |
| Central America | 4 | 0.3% |
| El Salvador | 4 | 0.3% |
| Latin America | 4 | 0.3% |
| Philippines | 6 | 0.4% |
| South Eastern Asia | 6 | 0.4% | View All 6 Rows |
Sex and Age in McCord
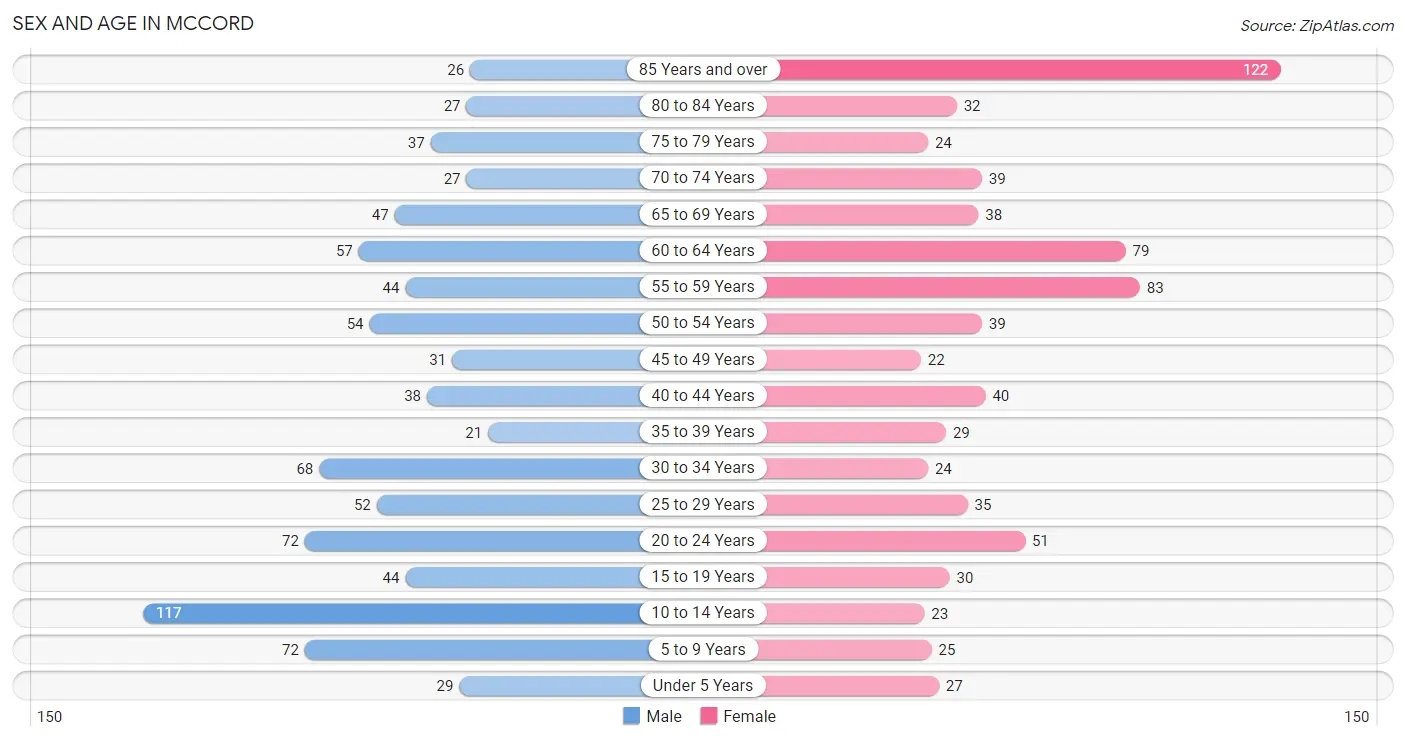
Sex and Age in McCord
The most populous age groups in McCord are 10 to 14 Years (117 | 13.6%) for men and 85 Years and over (122 | 16.0%) for women.
| Age Bracket | Male | Female |
| Under 5 Years | 29 (3.4%) | 27 (3.5%) |
| 5 to 9 Years | 72 (8.3%) | 25 (3.3%) |
| 10 to 14 Years | 117 (13.6%) | 23 (3.0%) |
| 15 to 19 Years | 44 (5.1%) | 30 (3.9%) |
| 20 to 24 Years | 72 (8.3%) | 51 (6.7%) |
| 25 to 29 Years | 52 (6.0%) | 35 (4.6%) |
| 30 to 34 Years | 68 (7.9%) | 24 (3.2%) |
| 35 to 39 Years | 21 (2.4%) | 29 (3.8%) |
| 40 to 44 Years | 38 (4.4%) | 40 (5.2%) |
| 45 to 49 Years | 31 (3.6%) | 22 (2.9%) |
| 50 to 54 Years | 54 (6.3%) | 39 (5.1%) |
| 55 to 59 Years | 44 (5.1%) | 83 (10.9%) |
| 60 to 64 Years | 57 (6.6%) | 79 (10.4%) |
| 65 to 69 Years | 47 (5.4%) | 38 (5.0%) |
| 70 to 74 Years | 27 (3.1%) | 39 (5.1%) |
| 75 to 79 Years | 37 (4.3%) | 24 (3.2%) |
| 80 to 84 Years | 27 (3.1%) | 32 (4.2%) |
| 85 Years and over | 26 (3.0%) | 122 (16.0%) |
| Total | 863 (100.0%) | 762 (100.0%) |
Families and Households in McCord
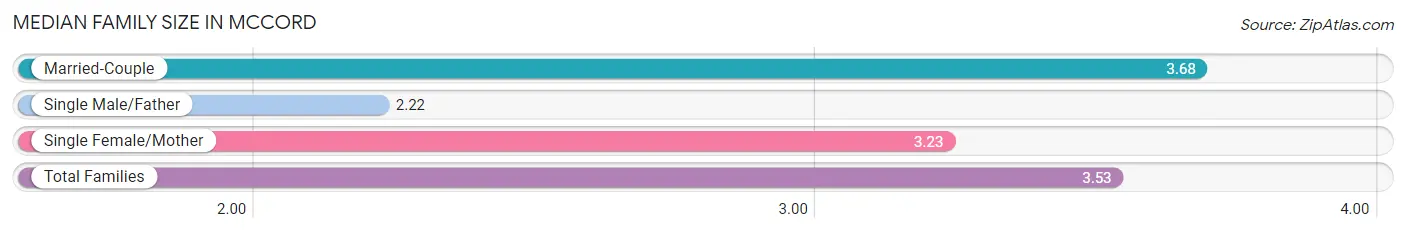
Median Family Size in McCord
The median family size in McCord is 3.53 persons per family, with married-couple families (306 | 80.1%) accounting for the largest median family size of 3.68 persons per family. On the other hand, single male/father families (23 | 6.0%) represent the smallest median family size with 2.22 persons per family.
| Family Type | # Families | Family Size |
| Married-Couple | 306 (80.1%) | 3.68 |
| Single Male/Father | 23 (6.0%) | 2.22 |
| Single Female/Mother | 53 (13.9%) | 3.23 |
| Total Families | 382 (100.0%) | 3.53 |
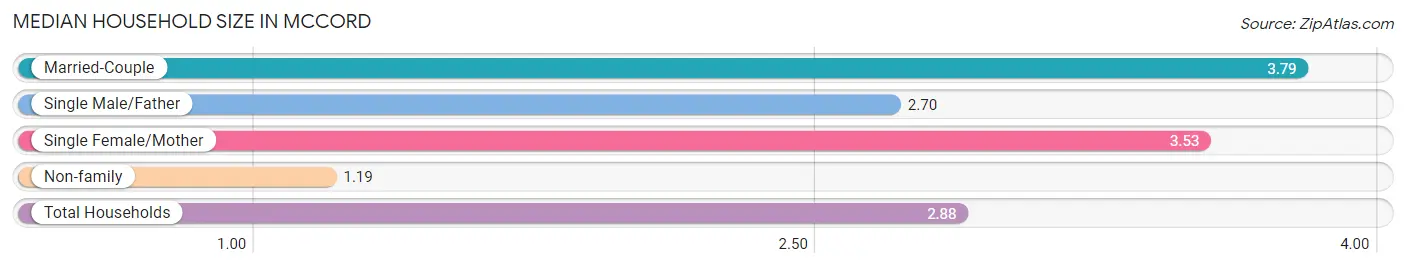
Median Household Size in McCord
The median household size in McCord is 2.88 persons per household, with married-couple households (306 | 54.2%) accounting for the largest median household size of 3.79 persons per household. non-family households (183 | 32.4%) represent the smallest median household size with 1.19 persons per household.
| Household Type | # Households | Household Size |
| Married-Couple | 306 (54.2%) | 3.79 |
| Single Male/Father | 23 (4.1%) | 2.70 |
| Single Female/Mother | 53 (9.4%) | 3.53 |
| Non-family | 183 (32.4%) | 1.19 |
| Total Households | 565 (100.0%) | 2.88 |
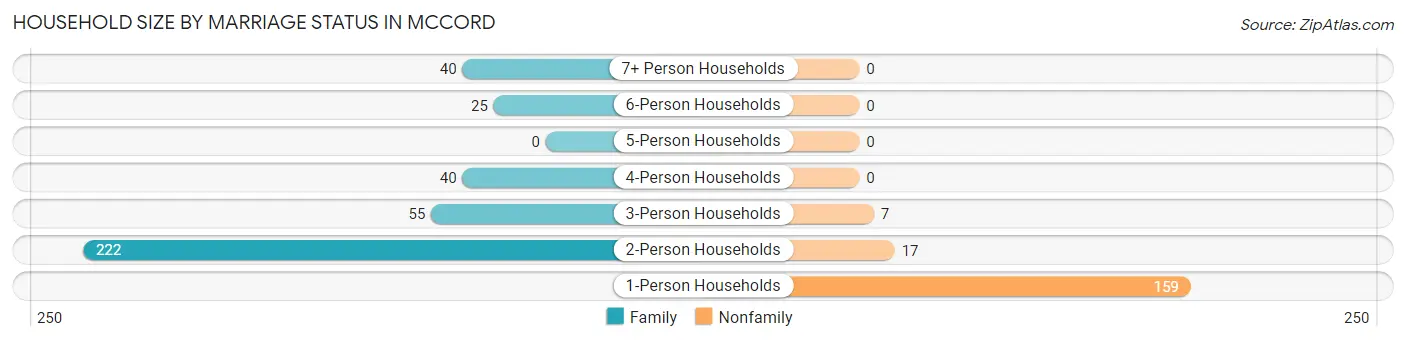
Household Size by Marriage Status in McCord
Out of a total of 565 households in McCord, 382 (67.6%) are family households, while 183 (32.4%) are nonfamily households. The most numerous type of family households are 2-person households, comprising 222, and the most common type of nonfamily households are 1-person households, comprising 159.
| Household Size | Family Households | Nonfamily Households |
| 1-Person Households | - | 159 (28.1%) |
| 2-Person Households | 222 (39.3%) | 17 (3.0%) |
| 3-Person Households | 55 (9.7%) | 7 (1.2%) |
| 4-Person Households | 40 (7.1%) | 0 (0.0%) |
| 5-Person Households | 0 (0.0%) | 0 (0.0%) |
| 6-Person Households | 25 (4.4%) | 0 (0.0%) |
| 7+ Person Households | 40 (7.1%) | 0 (0.0%) |
| Total | 382 (67.6%) | 183 (32.4%) |
Female Fertility in McCord
Fertility by Age in McCord
Average fertility rate in McCord is 34.0 births per 1,000 women. Women in the age bracket of 20 to 34 years have the highest fertility rate with 73.0 births per 1,000 women. Women in the age bracket of 20 to 34 years acount for 100.0% of all women with births.
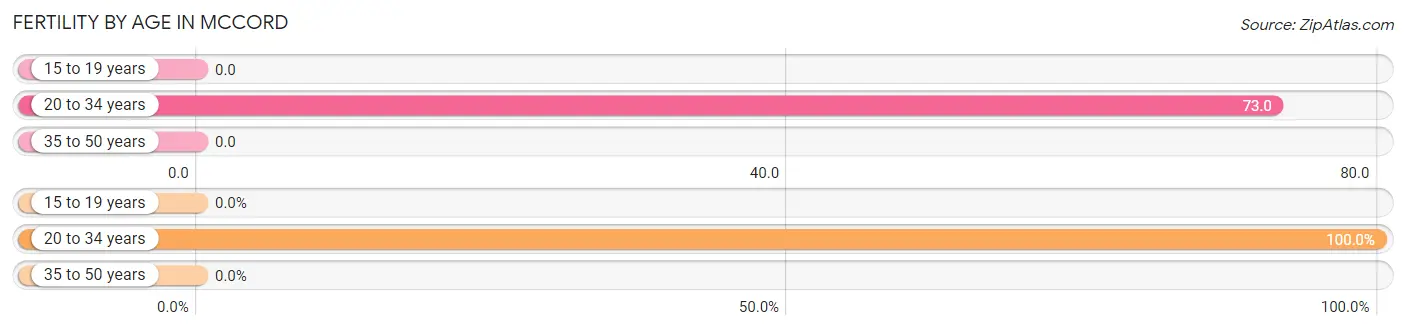
| Age Bracket | Women with Births | Births / 1,000 Women |
| 15 to 19 years | 0 (0.0%) | 0.0 |
| 20 to 34 years | 8 (100.0%) | 73.0 |
| 35 to 50 years | 0 (0.0%) | 0.0 |
| Total | 8 (100.0%) | 34.0 |
Fertility by Age by Marriage Status in McCord
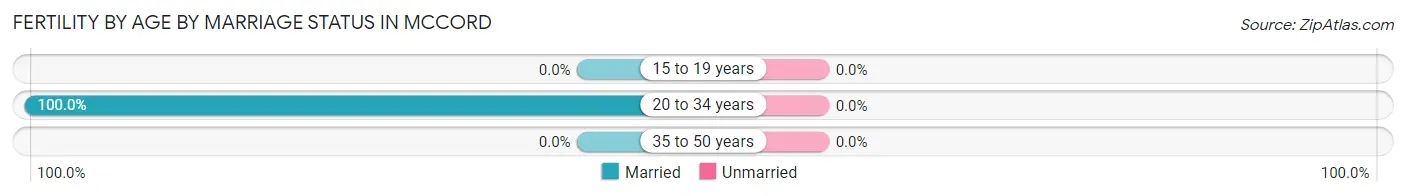
| Age Bracket | Married | Unmarried |
| 15 to 19 years | 0 (0.0%) | 0 (0.0%) |
| 20 to 34 years | 8 (100.0%) | 0 (0.0%) |
| 35 to 50 years | 0 (0.0%) | 0 (0.0%) |
| Total | 8 (100.0%) | 0 (0.0%) |
Fertility by Education in McCord
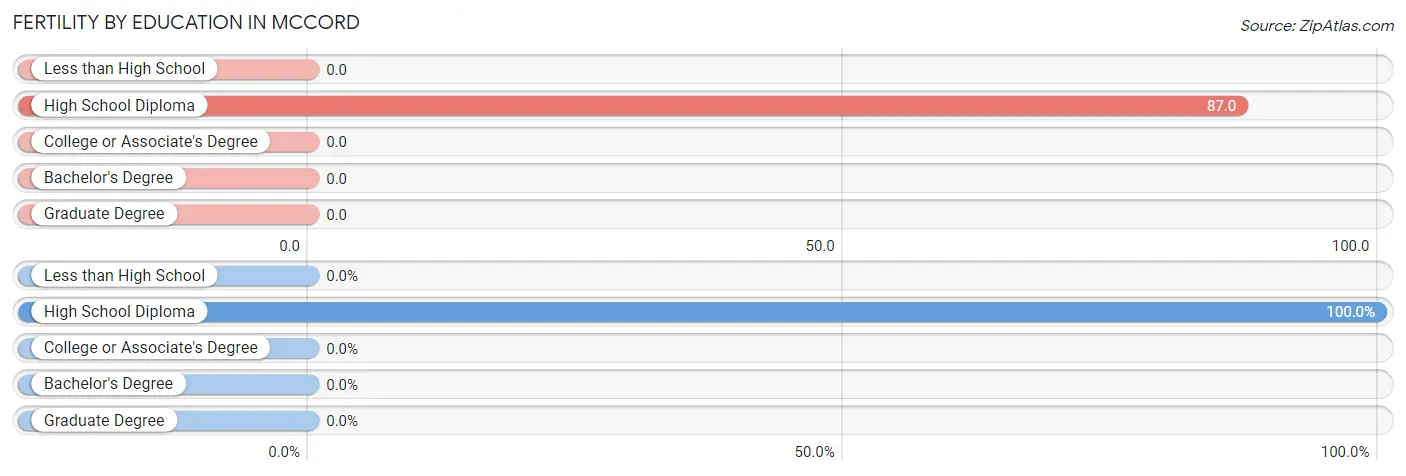
| Educational Attainment | Women with Births | Births / 1,000 Women |
| Less than High School | 0 (0.0%) | 0.0 |
| High School Diploma | 8 (100.0%) | 87.0 |
| College or Associate's Degree | 0 (0.0%) | 0.0 |
| Bachelor's Degree | 0 (0.0%) | 0.0 |
| Graduate Degree | 0 (0.0%) | 0.0 |
| Total | 8 (100.0%) | 34.0 |
Fertility by Education by Marriage Status in McCord
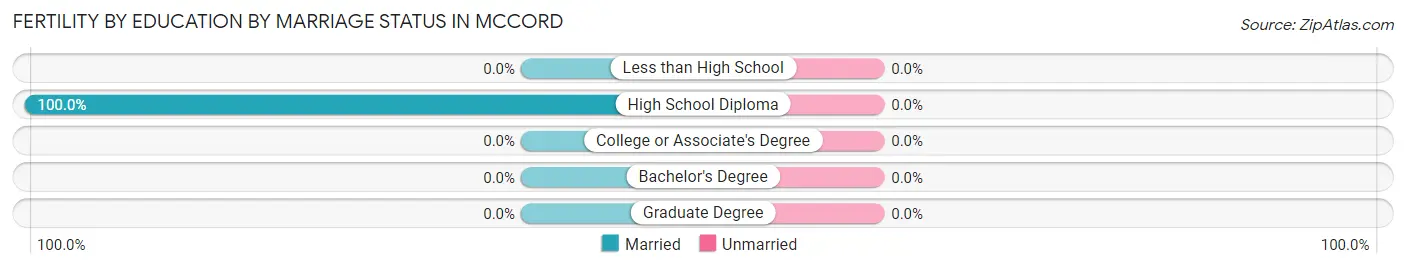
| Educational Attainment | Married | Unmarried |
| Less than High School | 0 (0.0%) | 0 (0.0%) |
| High School Diploma | 8 (100.0%) | 0 (0.0%) |
| College or Associate's Degree | 0 (0.0%) | 0 (0.0%) |
| Bachelor's Degree | 0 (0.0%) | 0 (0.0%) |
| Graduate Degree | 0 (0.0%) | 0 (0.0%) |
| Total | 8 (100.0%) | 0 (0.0%) |
Income in McCord
Income Overview in McCord
Per Capita Income in McCord is $37,324, while median incomes of families and households are $80,000 and $66,080 respectively.
| Characteristic | Number | Measure |
| Per Capita Income | 1,625 | $37,324 |
| Median Family Income | 382 | $80,000 |
| Mean Family Income | 382 | $103,443 |
| Median Household Income | 565 | $66,080 |
| Mean Household Income | 565 | $88,758 |
| Income Deficit | 382 | $11,550 |
| Wage / Income Gap (%) | 1,625 | 66.95% |
| Wage / Income Gap ($) | 1,625 | 33.05¢ per $1 |
| Gini / Inequality Index | 1,625 | 0.44 |
Earnings by Sex in McCord
Average Earnings in McCord are $35,703, $49,167 for men and $16,250 for women, a difference of 66.9%.
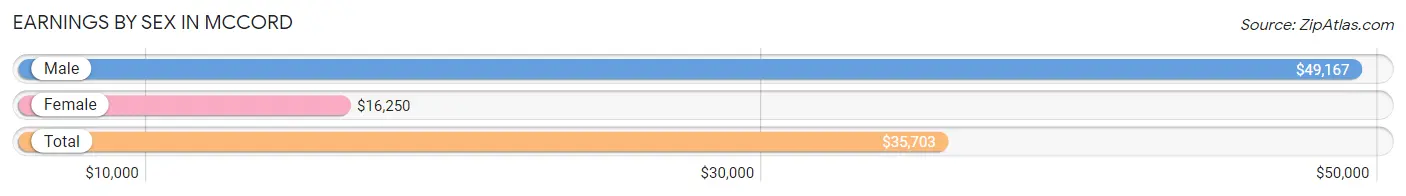
| Sex | Number | Average Earnings |
| Male | 390 (52.1%) | $49,167 |
| Female | 358 (47.9%) | $16,250 |
| Total | 748 (100.0%) | $35,703 |
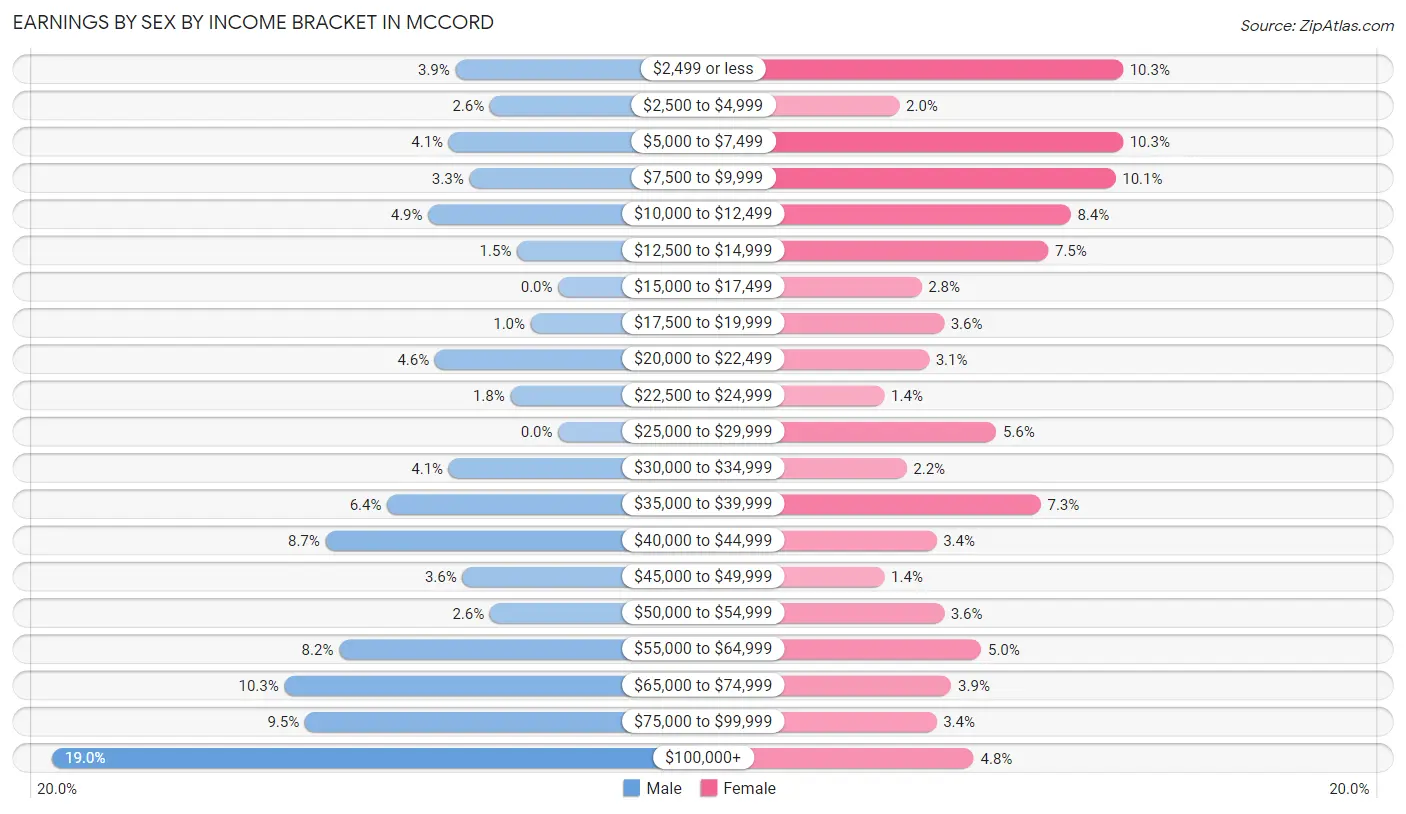
Earnings by Sex by Income Bracket in McCord
The most common earnings brackets in McCord are $100,000+ for men (74 | 19.0%) and $2,499 or less for women (37 | 10.3%).
| Income | Male | Female |
| $2,499 or less | 15 (3.8%) | 37 (10.3%) |
| $2,500 to $4,999 | 10 (2.6%) | 7 (2.0%) |
| $5,000 to $7,499 | 16 (4.1%) | 37 (10.3%) |
| $7,500 to $9,999 | 13 (3.3%) | 36 (10.1%) |
| $10,000 to $12,499 | 19 (4.9%) | 30 (8.4%) |
| $12,500 to $14,999 | 6 (1.5%) | 27 (7.5%) |
| $15,000 to $17,499 | 0 (0.0%) | 10 (2.8%) |
| $17,500 to $19,999 | 4 (1.0%) | 13 (3.6%) |
| $20,000 to $22,499 | 18 (4.6%) | 11 (3.1%) |
| $22,500 to $24,999 | 7 (1.8%) | 5 (1.4%) |
| $25,000 to $29,999 | 0 (0.0%) | 20 (5.6%) |
| $30,000 to $34,999 | 16 (4.1%) | 8 (2.2%) |
| $35,000 to $39,999 | 25 (6.4%) | 26 (7.3%) |
| $40,000 to $44,999 | 34 (8.7%) | 12 (3.4%) |
| $45,000 to $49,999 | 14 (3.6%) | 5 (1.4%) |
| $50,000 to $54,999 | 10 (2.6%) | 13 (3.6%) |
| $55,000 to $64,999 | 32 (8.2%) | 18 (5.0%) |
| $65,000 to $74,999 | 40 (10.3%) | 14 (3.9%) |
| $75,000 to $99,999 | 37 (9.5%) | 12 (3.4%) |
| $100,000+ | 74 (19.0%) | 17 (4.8%) |
| Total | 390 (100.0%) | 358 (100.0%) |
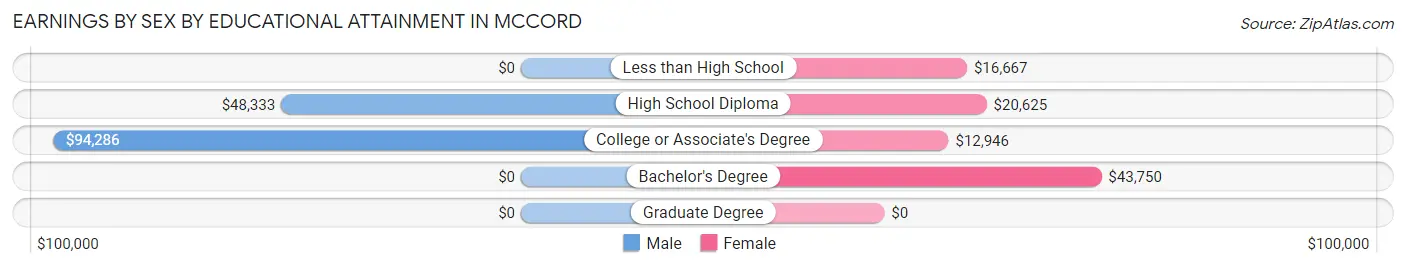
Earnings by Sex by Educational Attainment in McCord
Average earnings in McCord are $57,396 for men and $21,136 for women, a difference of 63.2%. Men with an educational attainment of college or associate's degree enjoy the highest average annual earnings of $94,286, while those with high school diploma education earn the least with $48,333. Women with an educational attainment of bachelor's degree earn the most with the average annual earnings of $43,750, while those with college or associate's degree education have the smallest earnings of $12,946.
| Educational Attainment | Male Income | Female Income |
| Less than High School | - | - |
| High School Diploma | $48,333 | $20,625 |
| College or Associate's Degree | $94,286 | $12,946 |
| Bachelor's Degree | - | - |
| Graduate Degree | - | - |
| Total | $57,396 | $21,136 |
Family Income in McCord
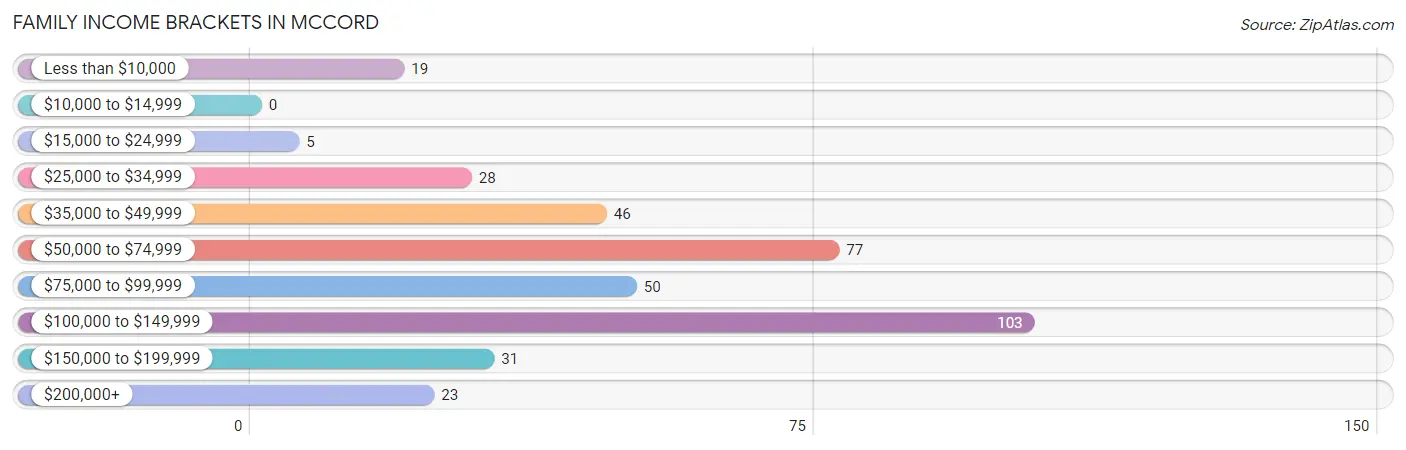
Family Income Brackets in McCord
According to the McCord family income data, there are 103 families falling into the $100,000 to $149,999 income range, which is the most common income bracket and makes up 27.0% of all families.
| Income Bracket | # Families | % Families |
| Less than $10,000 | 19 | 5.0% |
| $10,000 to $14,999 | 0 | 0.0% |
| $15,000 to $24,999 | 5 | 1.3% |
| $25,000 to $34,999 | 28 | 7.3% |
| $35,000 to $49,999 | 46 | 12.0% |
| $50,000 to $74,999 | 77 | 20.2% |
| $75,000 to $99,999 | 50 | 13.1% |
| $100,000 to $149,999 | 103 | 27.0% |
| $150,000 to $199,999 | 31 | 8.1% |
| $200,000+ | 23 | 6.0% |
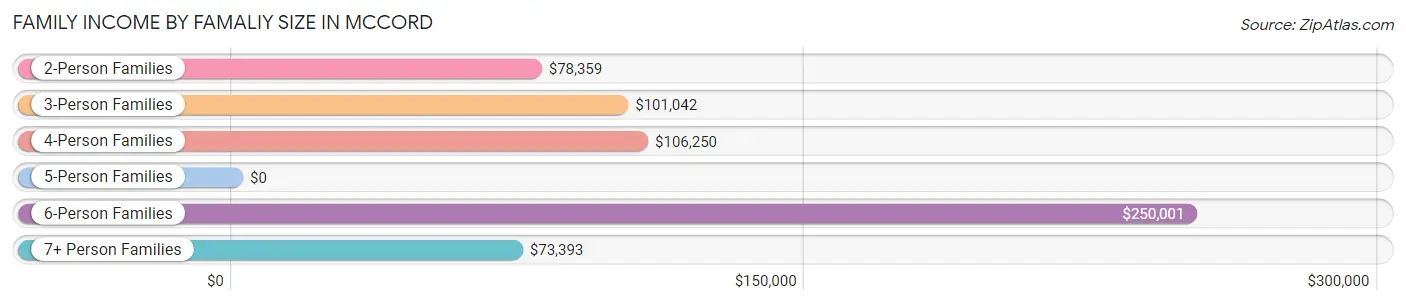
Family Income by Famaliy Size in McCord
6-person families (43 | 11.3%) account for the highest median family income in McCord with $250,001 per family, while 6-person families (43 | 11.3%) have the highest median income of $41,667 per family member.
| Income Bracket | # Families | Median Income |
| 2-Person Families | 241 (63.1%) | $78,359 |
| 3-Person Families | 43 (11.3%) | $101,042 |
| 4-Person Families | 33 (8.6%) | $106,250 |
| 5-Person Families | 5 (1.3%) | $0 |
| 6-Person Families | 43 (11.3%) | $250,001 |
| 7+ Person Families | 17 (4.4%) | $73,393 |
| Total | 382 (100.0%) | $80,000 |
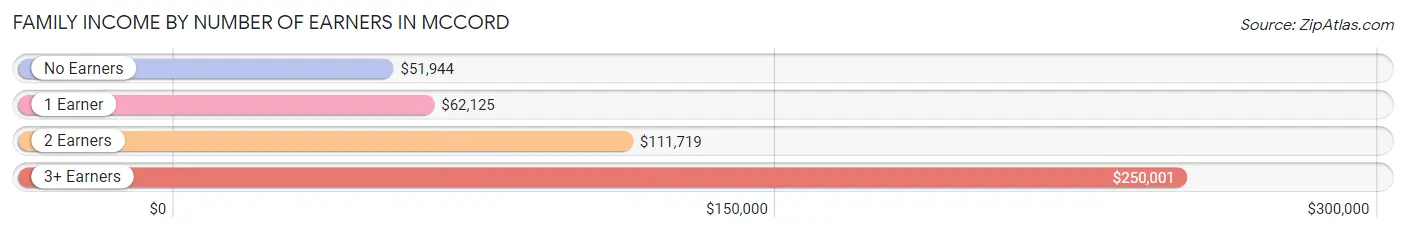
Family Income by Number of Earners in McCord
The median family income in McCord is $80,000, with families comprising 3+ earners (38) having the highest median family income of $250,001, while families with no earners (54) have the lowest median family income of $51,944, accounting for 10.0% and 14.1% of families, respectively.
| Number of Earners | # Families | Median Income |
| No Earners | 54 (14.1%) | $51,944 |
| 1 Earner | 139 (36.4%) | $62,125 |
| 2 Earners | 151 (39.5%) | $111,719 |
| 3+ Earners | 38 (10.0%) | $250,001 |
| Total | 382 (100.0%) | $80,000 |
Household Income in McCord
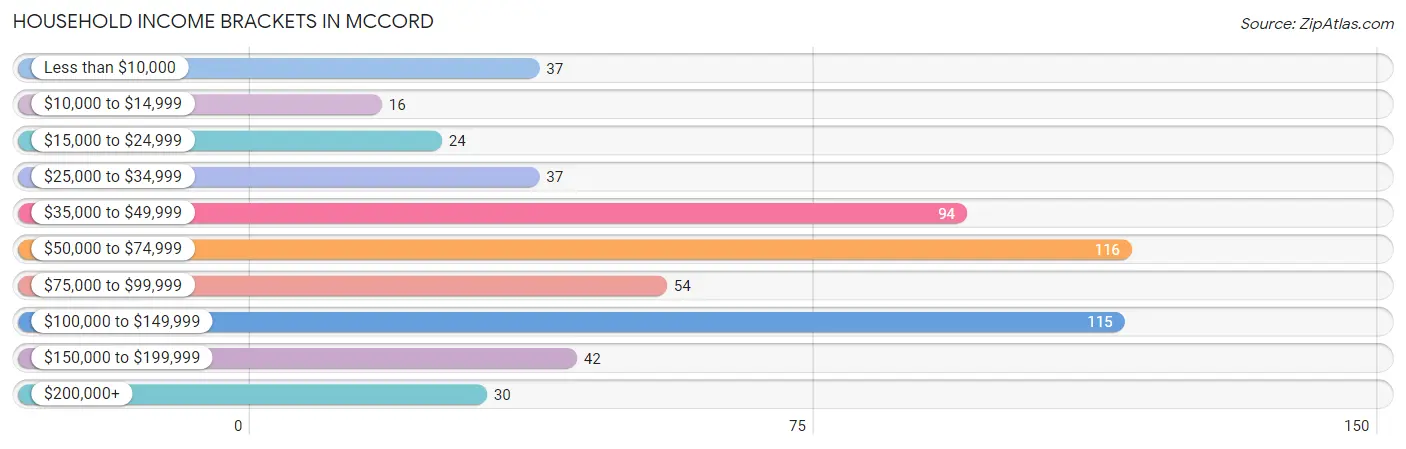
Household Income Brackets in McCord
With 116 households falling in the category, the $50,000 to $74,999 income range is the most frequent in McCord, accounting for 20.5% of all households. In contrast, only 16 households (2.8%) fall into the $10,000 to $14,999 income bracket, making it the least populous group.
| Income Bracket | # Households | % Households |
| Less than $10,000 | 37 | 6.5% |
| $10,000 to $14,999 | 16 | 2.8% |
| $15,000 to $24,999 | 24 | 4.2% |
| $25,000 to $34,999 | 37 | 6.5% |
| $35,000 to $49,999 | 94 | 16.6% |
| $50,000 to $74,999 | 116 | 20.5% |
| $75,000 to $99,999 | 54 | 9.6% |
| $100,000 to $149,999 | 115 | 20.4% |
| $150,000 to $199,999 | 42 | 7.4% |
| $200,000+ | 30 | 5.3% |
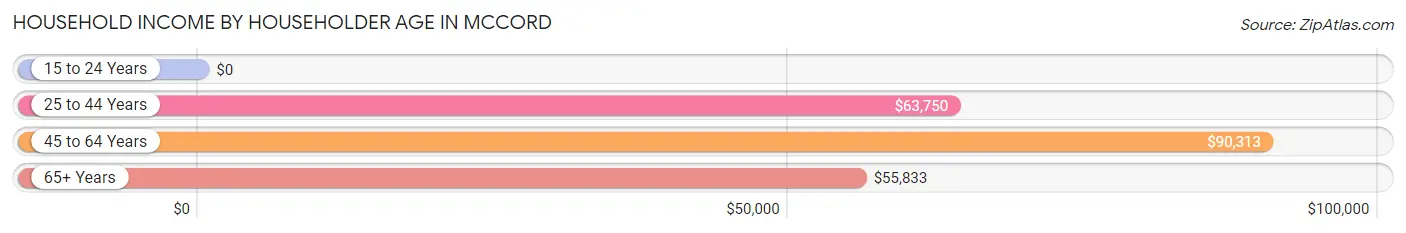
Household Income by Householder Age in McCord
The median household income in McCord is $66,080, with the highest median household income of $90,313 found in the 45 to 64 years age bracket for the primary householder. A total of 218 households (38.6%) fall into this category. Meanwhile, the 15 to 24 years age bracket for the primary householder has the lowest median household income of $0, with 17 households (3.0%) in this group.
| Income Bracket | # Households | Median Income |
| 15 to 24 Years | 17 (3.0%) | $0 |
| 25 to 44 Years | 134 (23.7%) | $63,750 |
| 45 to 64 Years | 218 (38.6%) | $90,313 |
| 65+ Years | 196 (34.7%) | $55,833 |
| Total | 565 (100.0%) | $66,080 |
Poverty in McCord
Income Below Poverty by Sex and Age in McCord
With 15.0% poverty level for males and 15.5% for females among the residents of McCord, 15 year old males and 18 to 24 year old females are the most vulnerable to poverty, with 5 males (100.0%) and 45 females (61.6%) in their respective age groups living below the poverty level.
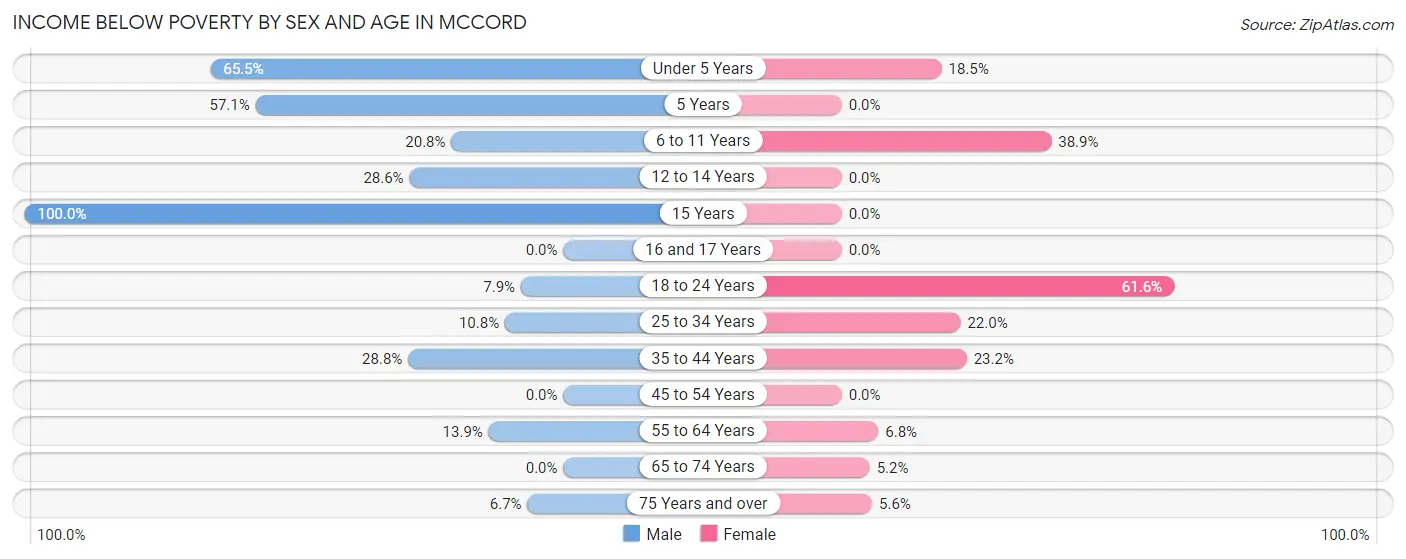
| Age Bracket | Male | Female |
| Under 5 Years | 19 (65.5%) | 5 (18.5%) |
| 5 Years | 8 (57.1%) | 0 (0.0%) |
| 6 to 11 Years | 21 (20.8%) | 14 (38.9%) |
| 12 to 14 Years | 18 (28.6%) | 0 (0.0%) |
| 15 Years | 5 (100.0%) | 0 (0.0%) |
| 16 and 17 Years | 0 (0.0%) | 0 (0.0%) |
| 18 to 24 Years | 7 (7.9%) | 45 (61.6%) |
| 25 to 34 Years | 13 (10.8%) | 13 (22.0%) |
| 35 to 44 Years | 17 (28.8%) | 16 (23.2%) |
| 45 to 54 Years | 0 (0.0%) | 0 (0.0%) |
| 55 to 64 Years | 14 (13.9%) | 11 (6.8%) |
| 65 to 74 Years | 0 (0.0%) | 4 (5.2%) |
| 75 Years and over | 6 (6.7%) | 10 (5.6%) |
| Total | 128 (15.0%) | 118 (15.5%) |
Income Above Poverty by Sex and Age in McCord
According to the poverty statistics in McCord, males aged 16 and 17 years and females aged 5 years are the age groups that are most secure financially, with 100.0% of males and 100.0% of females in these age groups living above the poverty line.
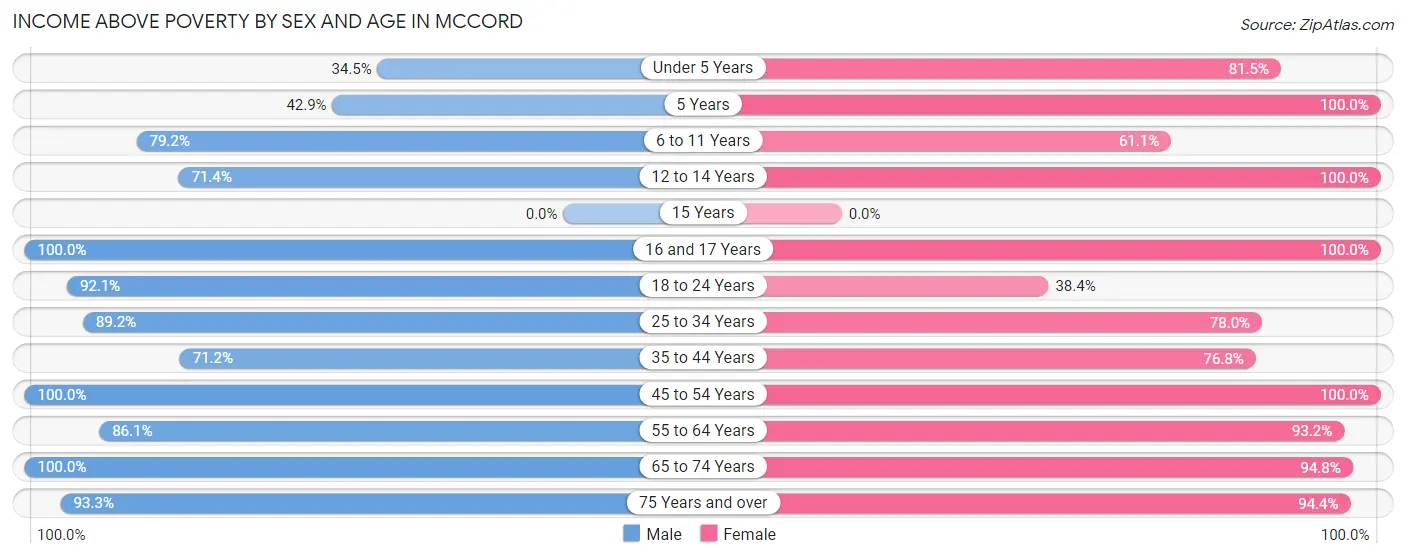
| Age Bracket | Male | Female |
| Under 5 Years | 10 (34.5%) | 22 (81.5%) |
| 5 Years | 6 (42.9%) | 4 (100.0%) |
| 6 to 11 Years | 80 (79.2%) | 22 (61.1%) |
| 12 to 14 Years | 45 (71.4%) | 8 (100.0%) |
| 15 Years | 0 (0.0%) | 0 (0.0%) |
| 16 and 17 Years | 22 (100.0%) | 8 (100.0%) |
| 18 to 24 Years | 82 (92.1%) | 28 (38.4%) |
| 25 to 34 Years | 107 (89.2%) | 46 (78.0%) |
| 35 to 44 Years | 42 (71.2%) | 53 (76.8%) |
| 45 to 54 Years | 85 (100.0%) | 61 (100.0%) |
| 55 to 64 Years | 87 (86.1%) | 151 (93.2%) |
| 65 to 74 Years | 74 (100.0%) | 73 (94.8%) |
| 75 Years and over | 84 (93.3%) | 168 (94.4%) |
| Total | 724 (85.0%) | 644 (84.5%) |
Income Below Poverty Among Married-Couple Families in McCord
The poverty statistics for married-couple families in McCord show that 6.2% or 19 of the total 306 families live below the poverty line. Families with 3 or 4 children have the highest poverty rate of 35.7%, comprising of 10 families. On the other hand, families with no children have the lowest poverty rate of 0.0%, which includes 0 families.
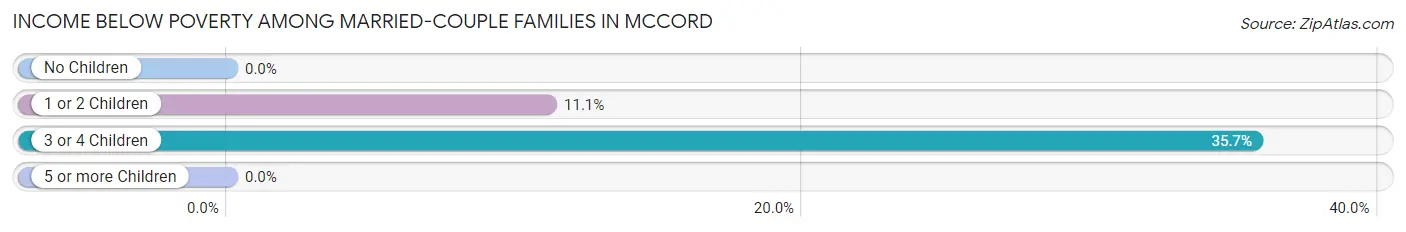
| Children | Above Poverty | Below Poverty |
| No Children | 197 (100.0%) | 0 (0.0%) |
| 1 or 2 Children | 72 (88.9%) | 9 (11.1%) |
| 3 or 4 Children | 18 (64.3%) | 10 (35.7%) |
| 5 or more Children | 0 (0.0%) | 0 (0.0%) |
| Total | 287 (93.8%) | 19 (6.2%) |
Income Below Poverty Among Single-Parent Households in McCord
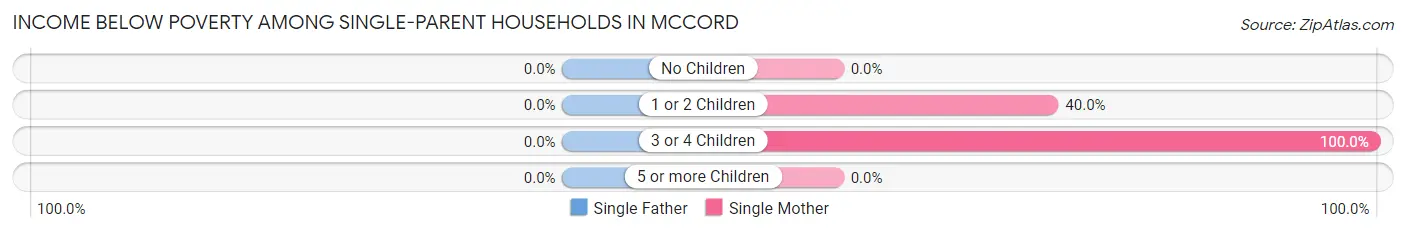
| Children | Single Father | Single Mother |
| No Children | 0 (0.0%) | 0 (0.0%) |
| 1 or 2 Children | 0 (0.0%) | 10 (40.0%) |
| 3 or 4 Children | 0 (0.0%) | 5 (100.0%) |
| 5 or more Children | 0 (0.0%) | 0 (0.0%) |
| Total | 0 (0.0%) | 15 (28.3%) |
Income Below Poverty Among Married-Couple vs Single-Parent Households in McCord
The poverty data for McCord shows that 19 of the married-couple family households (6.2%) and 15 of the single-parent households (19.7%) are living below the poverty level. Within the married-couple family households, those with 3 or 4 children have the highest poverty rate, with 10 households (35.7%) falling below the poverty line. Among the single-parent households, those with 3 or 4 children have the highest poverty rate, with 5 household (100.0%) living below poverty.
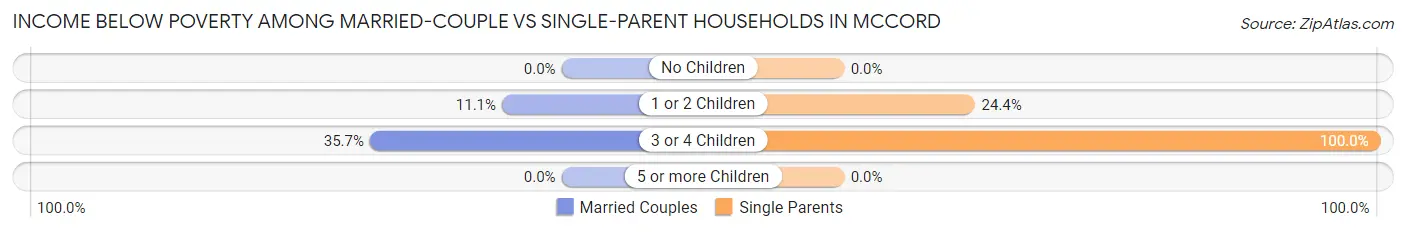
| Children | Married-Couple Families | Single-Parent Households |
| No Children | 0 (0.0%) | 0 (0.0%) |
| 1 or 2 Children | 9 (11.1%) | 10 (24.4%) |
| 3 or 4 Children | 10 (35.7%) | 5 (100.0%) |
| 5 or more Children | 0 (0.0%) | 0 (0.0%) |
| Total | 19 (6.2%) | 15 (19.7%) |
Employment Characteristics in McCord
Employment by Class of Employer in McCord
Among the 645 employed individuals in McCord, private company employees (464 | 71.9%), self-employed (not incorporated) (56 | 8.7%), and local government employees (43 | 6.7%) make up the most common classes of employment.
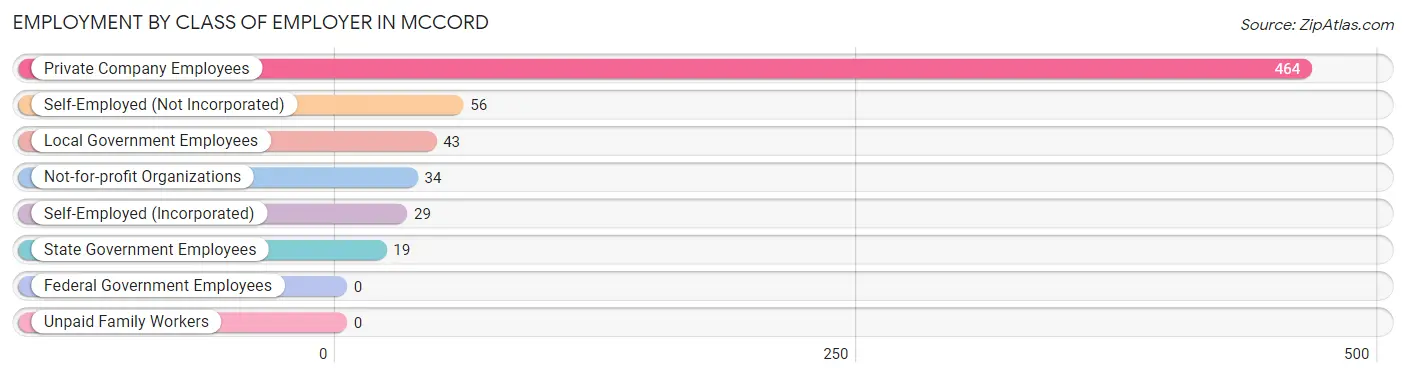
| Employer Class | # Employees | % Employees |
| Private Company Employees | 464 | 71.9% |
| Self-Employed (Incorporated) | 29 | 4.5% |
| Self-Employed (Not Incorporated) | 56 | 8.7% |
| Not-for-profit Organizations | 34 | 5.3% |
| Local Government Employees | 43 | 6.7% |
| State Government Employees | 19 | 2.9% |
| Federal Government Employees | 0 | 0.0% |
| Unpaid Family Workers | 0 | 0.0% |
| Total | 645 | 100.0% |
Employment Status by Age in McCord
According to the labor force statistics for McCord, out of the total population over 16 years of age (1,327), 56.3% or 747 individuals are in the labor force, with 9.8% or 73 of them unemployed. The age group with the highest labor force participation rate is 30 to 34 years, with 94.6% or 87 individuals in the labor force. Within the labor force, the 20 to 24 years age range has the highest percentage of unemployed individuals, with 31.5% or 35 of them being unemployed.
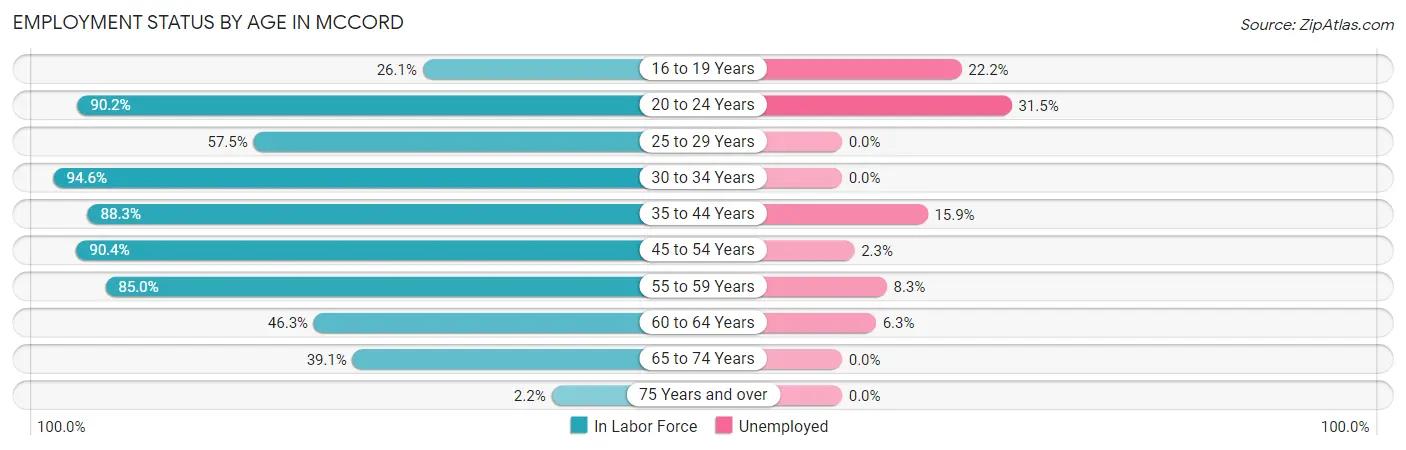
| Age Bracket | In Labor Force | Unemployed |
| 16 to 19 Years | 18 (26.1%) | 4 (22.2%) |
| 20 to 24 Years | 111 (90.2%) | 35 (31.5%) |
| 25 to 29 Years | 50 (57.5%) | 0 (0.0%) |
| 30 to 34 Years | 87 (94.6%) | 0 (0.0%) |
| 35 to 44 Years | 113 (88.3%) | 18 (15.9%) |
| 45 to 54 Years | 132 (90.4%) | 3 (2.3%) |
| 55 to 59 Years | 108 (85.0%) | 9 (8.3%) |
| 60 to 64 Years | 63 (46.3%) | 4 (6.3%) |
| 65 to 74 Years | 59 (39.1%) | 0 (0.0%) |
| 75 Years and over | 6 (2.2%) | 0 (0.0%) |
| Total | 747 (56.3%) | 73 (9.8%) |
Employment Status by Educational Attainment in McCord
According to labor force statistics for McCord, 77.2% of individuals (553) out of the total population between 25 and 64 years of age (716) are in the labor force, with 6.1% or 34 of them being unemployed. The group with the highest labor force participation rate are those with the educational attainment of bachelor's degree or higher, with 92.6% or 112 individuals in the labor force. Within the labor force, individuals with less than high school education have the highest percentage of unemployment, with 59.3% or 16 of them being unemployed.
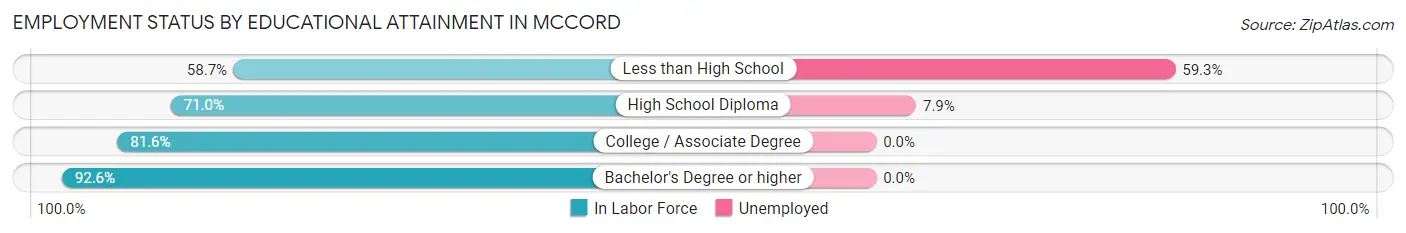
| Educational Attainment | In Labor Force | Unemployed |
| Less than High School | 27 (58.7%) | 27 (59.3%) |
| High School Diploma | 228 (71.0%) | 25 (7.9%) |
| College / Associate Degree | 186 (81.6%) | 0 (0.0%) |
| Bachelor's Degree or higher | 112 (92.6%) | 0 (0.0%) |
| Total | 553 (77.2%) | 44 (6.1%) |
Employment Occupations by Sex in McCord
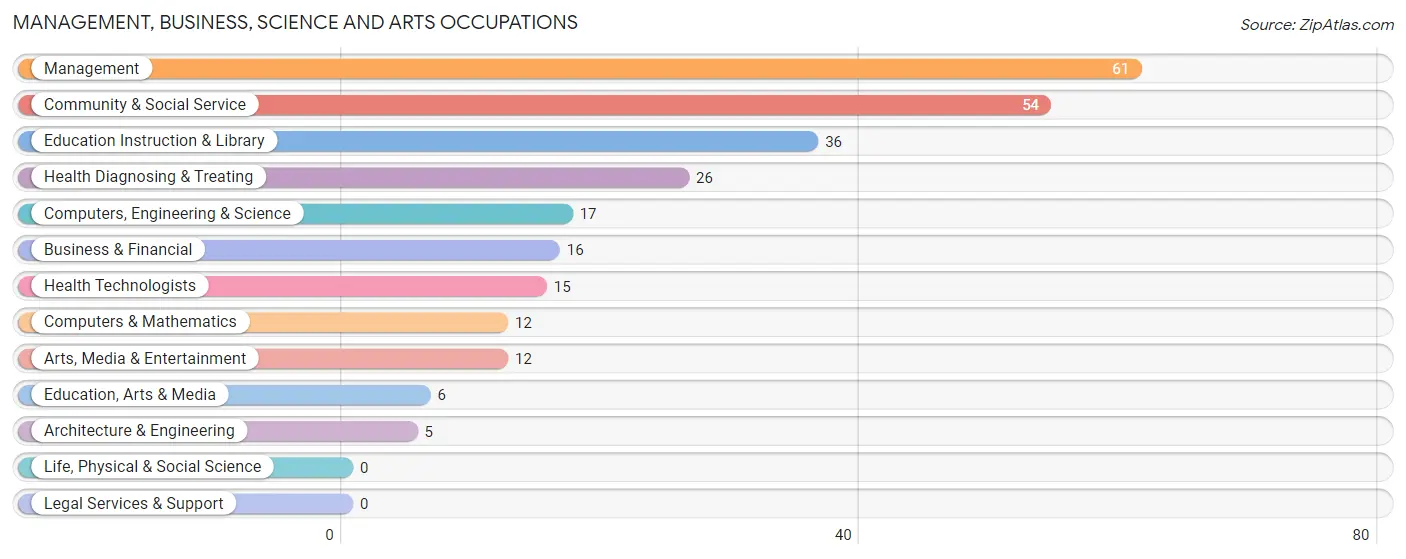
Management, Business, Science and Arts Occupations
The most common Management, Business, Science and Arts occupations in McCord are Management (61 | 9.0%), Community & Social Service (54 | 8.0%), Education Instruction & Library (36 | 5.3%), Health Diagnosing & Treating (26 | 3.9%), and Computers, Engineering & Science (17 | 2.5%).
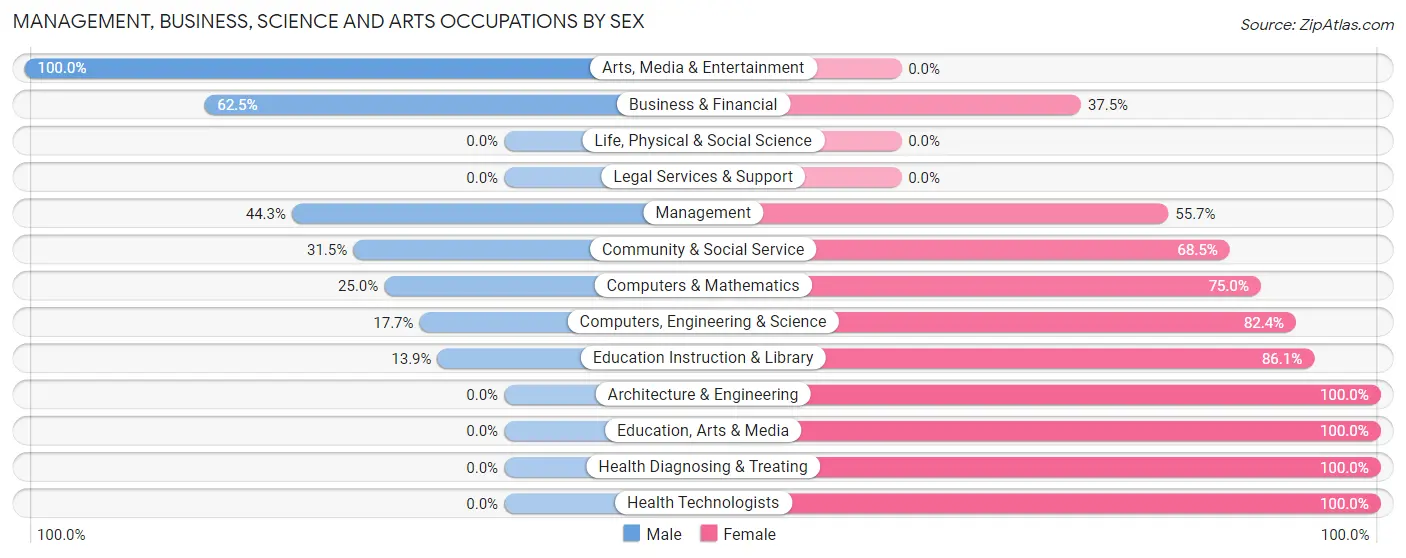
Management, Business, Science and Arts Occupations by Sex
Within the Management, Business, Science and Arts occupations in McCord, the most male-oriented occupations are Arts, Media & Entertainment (100.0%), Business & Financial (62.5%), and Management (44.3%), while the most female-oriented occupations are Architecture & Engineering (100.0%), Education, Arts & Media (100.0%), and Health Diagnosing & Treating (100.0%).
| Occupation | Male | Female |
| Management | 27 (44.3%) | 34 (55.7%) |
| Business & Financial | 10 (62.5%) | 6 (37.5%) |
| Computers, Engineering & Science | 3 (17.6%) | 14 (82.4%) |
| Computers & Mathematics | 3 (25.0%) | 9 (75.0%) |
| Architecture & Engineering | 0 (0.0%) | 5 (100.0%) |
| Life, Physical & Social Science | 0 (0.0%) | 0 (0.0%) |
| Community & Social Service | 17 (31.5%) | 37 (68.5%) |
| Education, Arts & Media | 0 (0.0%) | 6 (100.0%) |
| Legal Services & Support | 0 (0.0%) | 0 (0.0%) |
| Education Instruction & Library | 5 (13.9%) | 31 (86.1%) |
| Arts, Media & Entertainment | 12 (100.0%) | 0 (0.0%) |
| Health Diagnosing & Treating | 0 (0.0%) | 26 (100.0%) |
| Health Technologists | 0 (0.0%) | 15 (100.0%) |
| Total (Category) | 57 (32.8%) | 117 (67.2%) |
| Total (Overall) | 353 (52.4%) | 321 (47.6%) |
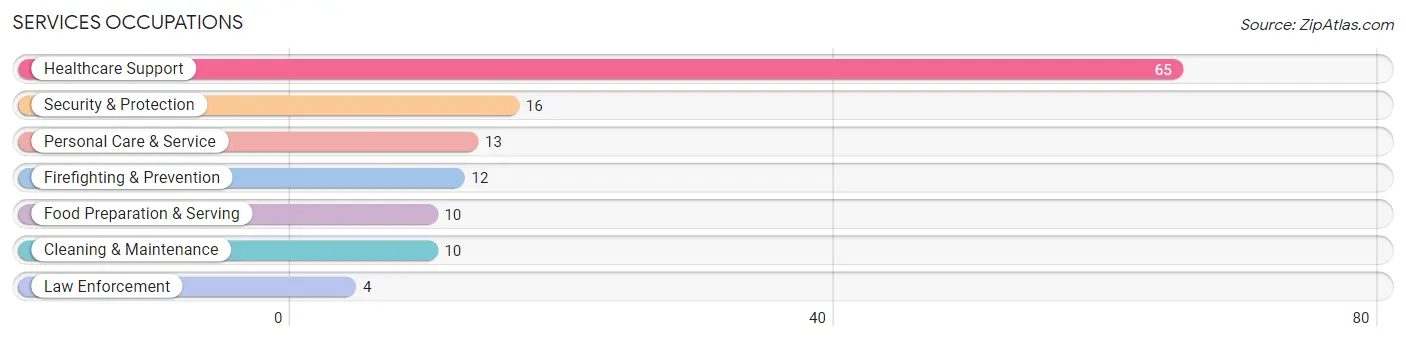
Services Occupations
The most common Services occupations in McCord are Healthcare Support (65 | 9.6%), Security & Protection (16 | 2.4%), Personal Care & Service (13 | 1.9%), Firefighting & Prevention (12 | 1.8%), and Food Preparation & Serving (10 | 1.5%).
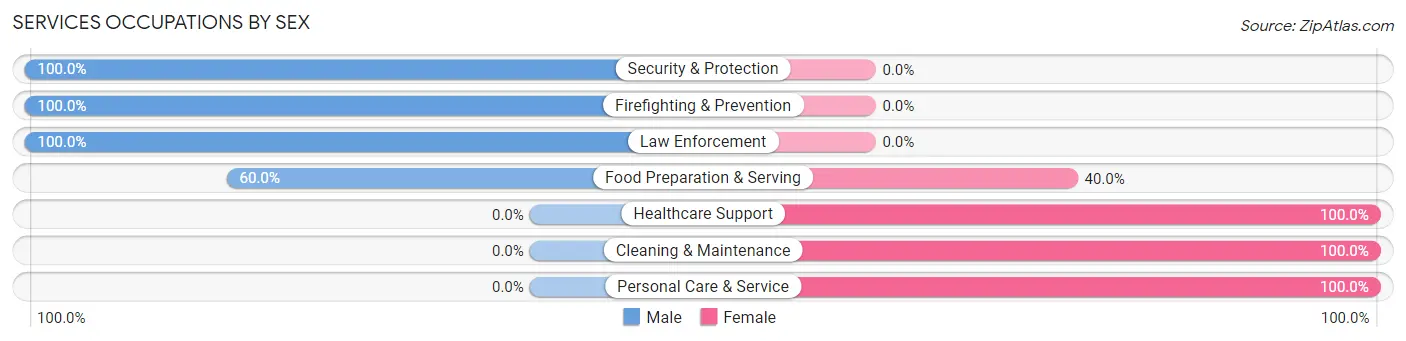
Services Occupations by Sex
Within the Services occupations in McCord, the most male-oriented occupations are Security & Protection (100.0%), Firefighting & Prevention (100.0%), and Law Enforcement (100.0%), while the most female-oriented occupations are Healthcare Support (100.0%), Cleaning & Maintenance (100.0%), and Personal Care & Service (100.0%).
| Occupation | Male | Female |
| Healthcare Support | 0 (0.0%) | 65 (100.0%) |
| Security & Protection | 16 (100.0%) | 0 (0.0%) |
| Firefighting & Prevention | 12 (100.0%) | 0 (0.0%) |
| Law Enforcement | 4 (100.0%) | 0 (0.0%) |
| Food Preparation & Serving | 6 (60.0%) | 4 (40.0%) |
| Cleaning & Maintenance | 0 (0.0%) | 10 (100.0%) |
| Personal Care & Service | 0 (0.0%) | 13 (100.0%) |
| Total (Category) | 22 (19.3%) | 92 (80.7%) |
| Total (Overall) | 353 (52.4%) | 321 (47.6%) |
Sales and Office Occupations
The most common Sales and Office occupations in McCord are Sales & Related (137 | 20.3%), and Office & Administration (33 | 4.9%).
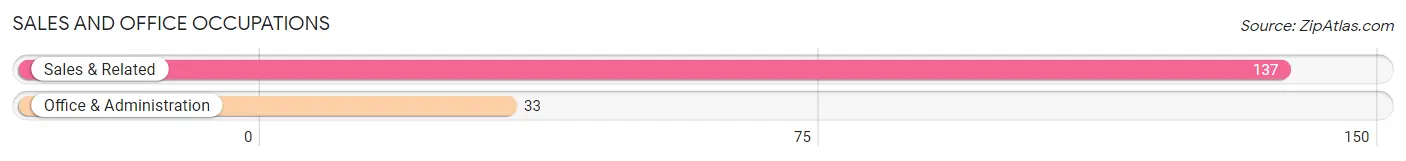
Sales and Office Occupations by Sex
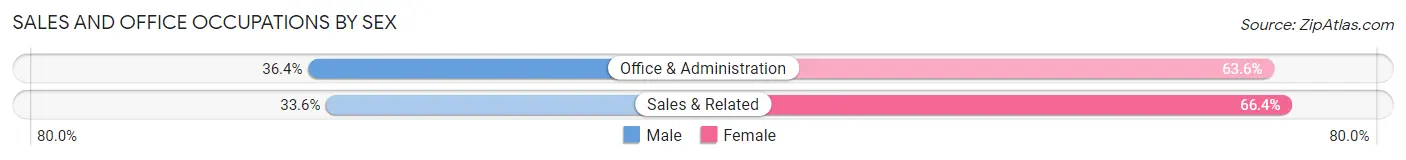
| Occupation | Male | Female |
| Sales & Related | 46 (33.6%) | 91 (66.4%) |
| Office & Administration | 12 (36.4%) | 21 (63.6%) |
| Total (Category) | 58 (34.1%) | 112 (65.9%) |
| Total (Overall) | 353 (52.4%) | 321 (47.6%) |
Natural Resources, Construction and Maintenance Occupations
The most common Natural Resources, Construction and Maintenance occupations in McCord are Construction & Extraction (59 | 8.7%), Installation, Maintenance & Repair (11 | 1.6%), and Farming, Fishing & Forestry (9 | 1.3%).
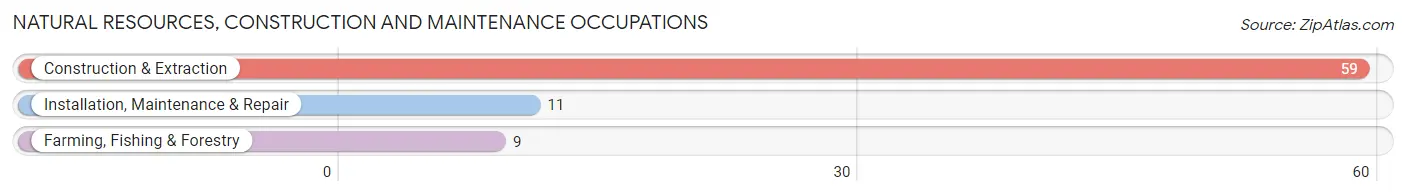
Natural Resources, Construction and Maintenance Occupations by Sex
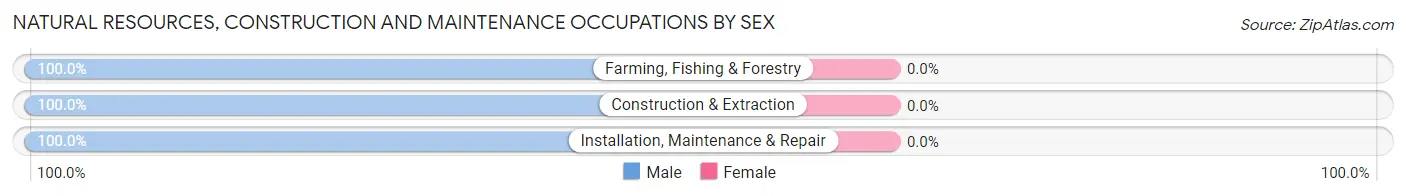
| Occupation | Male | Female |
| Farming, Fishing & Forestry | 9 (100.0%) | 0 (0.0%) |
| Construction & Extraction | 59 (100.0%) | 0 (0.0%) |
| Installation, Maintenance & Repair | 11 (100.0%) | 0 (0.0%) |
| Total (Category) | 79 (100.0%) | 0 (0.0%) |
| Total (Overall) | 353 (52.4%) | 321 (47.6%) |
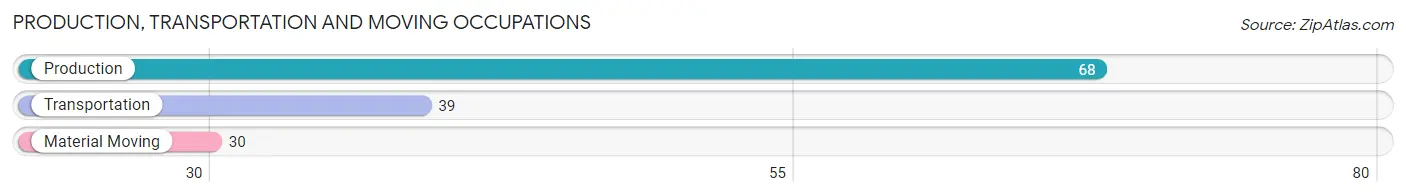
Production, Transportation and Moving Occupations
The most common Production, Transportation and Moving occupations in McCord are Production (68 | 10.1%), Transportation (39 | 5.8%), and Material Moving (30 | 4.4%).
Production, Transportation and Moving Occupations by Sex
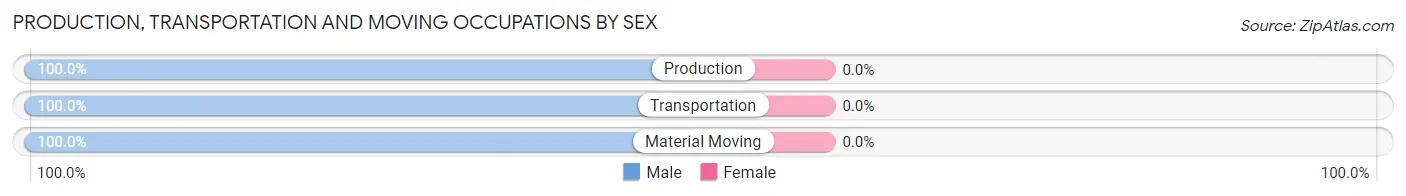
| Occupation | Male | Female |
| Production | 68 (100.0%) | 0 (0.0%) |
| Transportation | 39 (100.0%) | 0 (0.0%) |
| Material Moving | 30 (100.0%) | 0 (0.0%) |
| Total (Category) | 137 (100.0%) | 0 (0.0%) |
| Total (Overall) | 353 (52.4%) | 321 (47.6%) |
Employment Industries by Sex in McCord
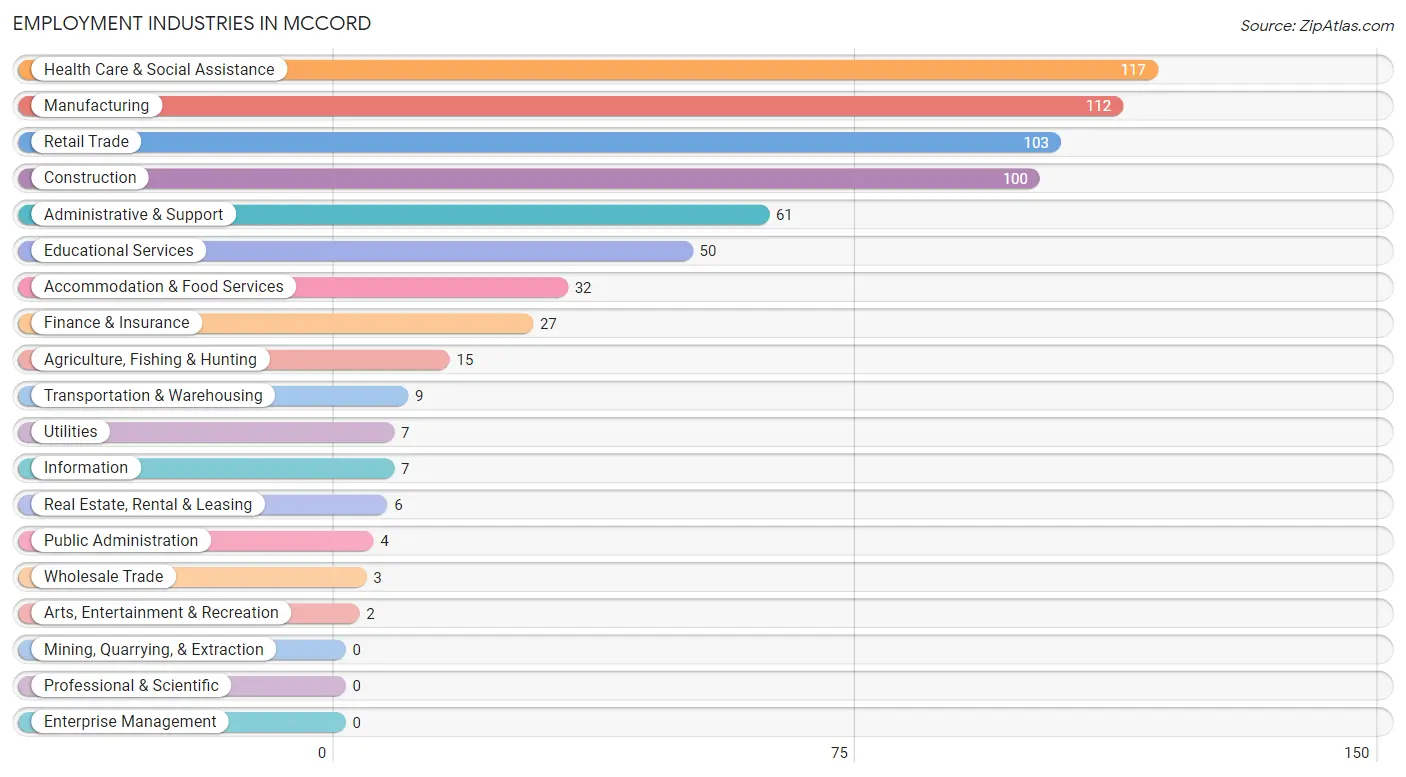
Employment Industries in McCord
The major employment industries in McCord include Health Care & Social Assistance (117 | 17.4%), Manufacturing (112 | 16.6%), Retail Trade (103 | 15.3%), Construction (100 | 14.8%), and Administrative & Support (61 | 9.0%).
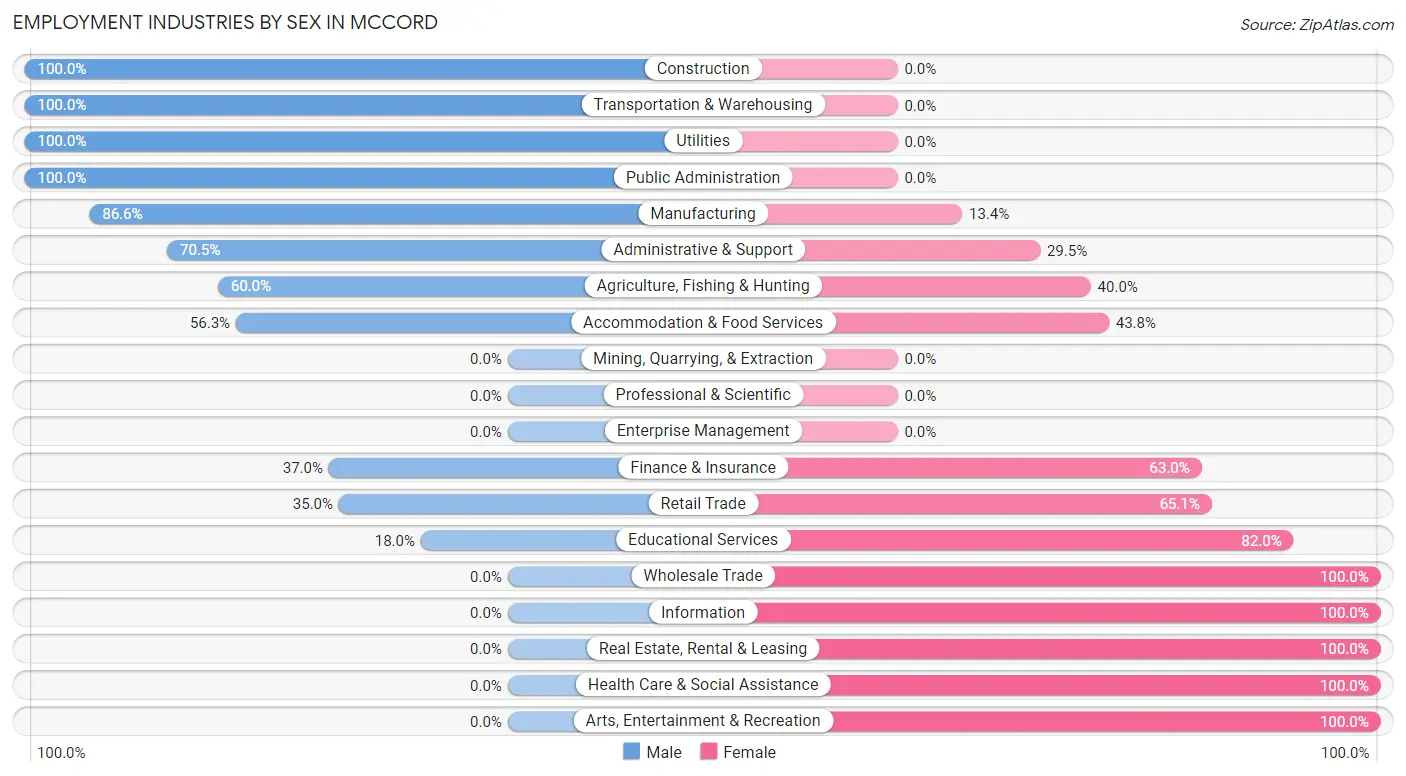
Employment Industries by Sex in McCord
The McCord industries that see more men than women are Construction (100.0%), Transportation & Warehousing (100.0%), and Utilities (100.0%), whereas the industries that tend to have a higher number of women are Wholesale Trade (100.0%), Information (100.0%), and Real Estate, Rental & Leasing (100.0%).
| Industry | Male | Female |
| Agriculture, Fishing & Hunting | 9 (60.0%) | 6 (40.0%) |
| Mining, Quarrying, & Extraction | 0 (0.0%) | 0 (0.0%) |
| Construction | 100 (100.0%) | 0 (0.0%) |
| Manufacturing | 97 (86.6%) | 15 (13.4%) |
| Wholesale Trade | 0 (0.0%) | 3 (100.0%) |
| Retail Trade | 36 (34.9%) | 67 (65.0%) |
| Transportation & Warehousing | 9 (100.0%) | 0 (0.0%) |
| Utilities | 7 (100.0%) | 0 (0.0%) |
| Information | 0 (0.0%) | 7 (100.0%) |
| Finance & Insurance | 10 (37.0%) | 17 (63.0%) |
| Real Estate, Rental & Leasing | 0 (0.0%) | 6 (100.0%) |
| Professional & Scientific | 0 (0.0%) | 0 (0.0%) |
| Enterprise Management | 0 (0.0%) | 0 (0.0%) |
| Administrative & Support | 43 (70.5%) | 18 (29.5%) |
| Educational Services | 9 (18.0%) | 41 (82.0%) |
| Health Care & Social Assistance | 0 (0.0%) | 117 (100.0%) |
| Arts, Entertainment & Recreation | 0 (0.0%) | 2 (100.0%) |
| Accommodation & Food Services | 18 (56.2%) | 14 (43.8%) |
| Public Administration | 4 (100.0%) | 0 (0.0%) |
| Total | 353 (52.4%) | 321 (47.6%) |
Education in McCord
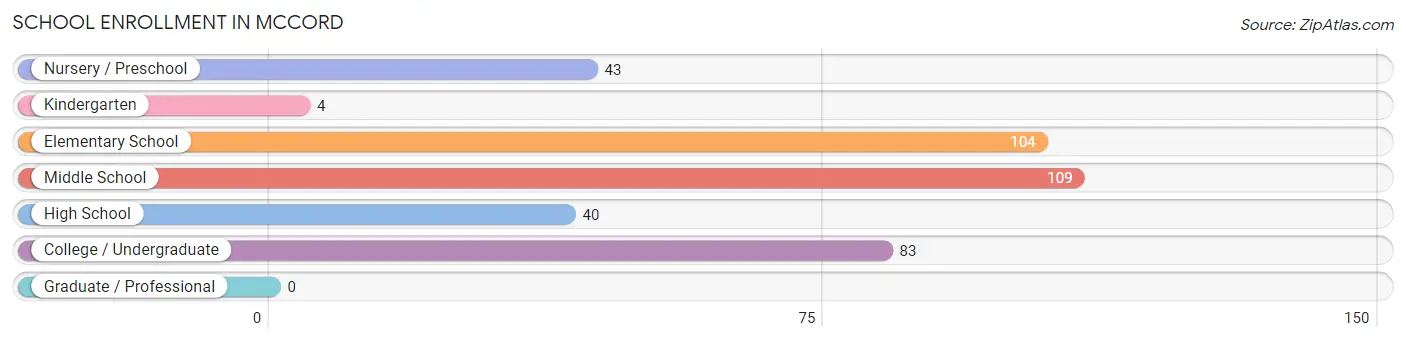
School Enrollment in McCord
The most common levels of schooling among the 383 students in McCord are middle school (109 | 28.5%), elementary school (104 | 27.2%), and college / undergraduate (83 | 21.7%).
| School Level | # Students | % Students |
| Nursery / Preschool | 43 | 11.2% |
| Kindergarten | 4 | 1.0% |
| Elementary School | 104 | 27.2% |
| Middle School | 109 | 28.5% |
| High School | 40 | 10.4% |
| College / Undergraduate | 83 | 21.7% |
| Graduate / Professional | 0 | 0.0% |
| Total | 383 | 100.0% |
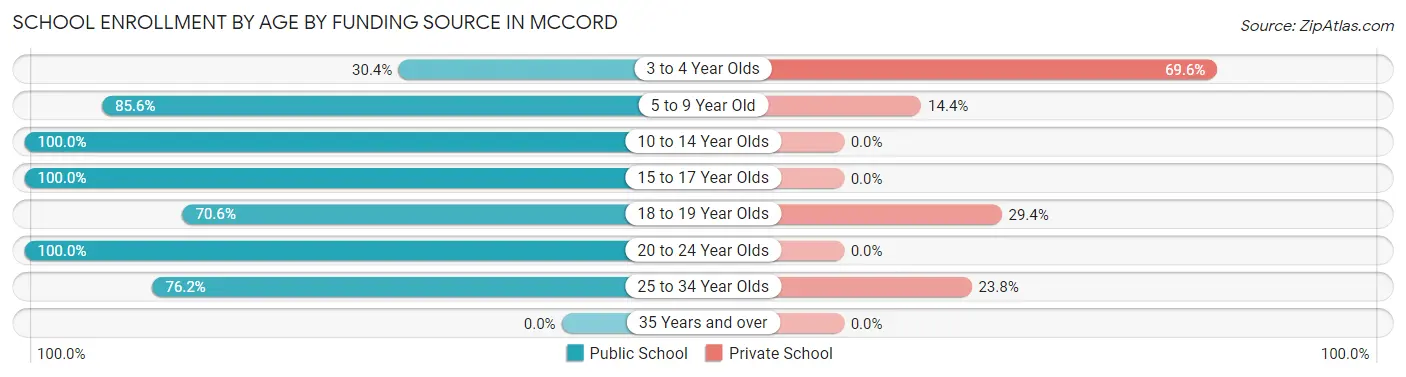
School Enrollment by Age by Funding Source in McCord
Out of a total of 383 students who are enrolled in schools in McCord, 40 (10.4%) attend a private institution, while the remaining 343 (89.6%) are enrolled in public schools. The age group of 3 to 4 year olds has the highest likelihood of being enrolled in private schools, with 16 (69.6% in the age bracket) enrolled. Conversely, the age group of 10 to 14 year olds has the lowest likelihood of being enrolled in a private school, with 140 (100.0% in the age bracket) attending a public institution.
| Age Bracket | Public School | Private School |
| 3 to 4 Year Olds | 7 (30.4%) | 16 (69.6%) |
| 5 to 9 Year Old | 83 (85.6%) | 14 (14.4%) |
| 10 to 14 Year Olds | 140 (100.0%) | 0 (0.0%) |
| 15 to 17 Year Olds | 35 (100.0%) | 0 (0.0%) |
| 18 to 19 Year Olds | 12 (70.6%) | 5 (29.4%) |
| 20 to 24 Year Olds | 50 (100.0%) | 0 (0.0%) |
| 25 to 34 Year Olds | 16 (76.2%) | 5 (23.8%) |
| 35 Years and over | 0 (0.0%) | 0 (0.0%) |
| Total | 343 (89.6%) | 40 (10.4%) |
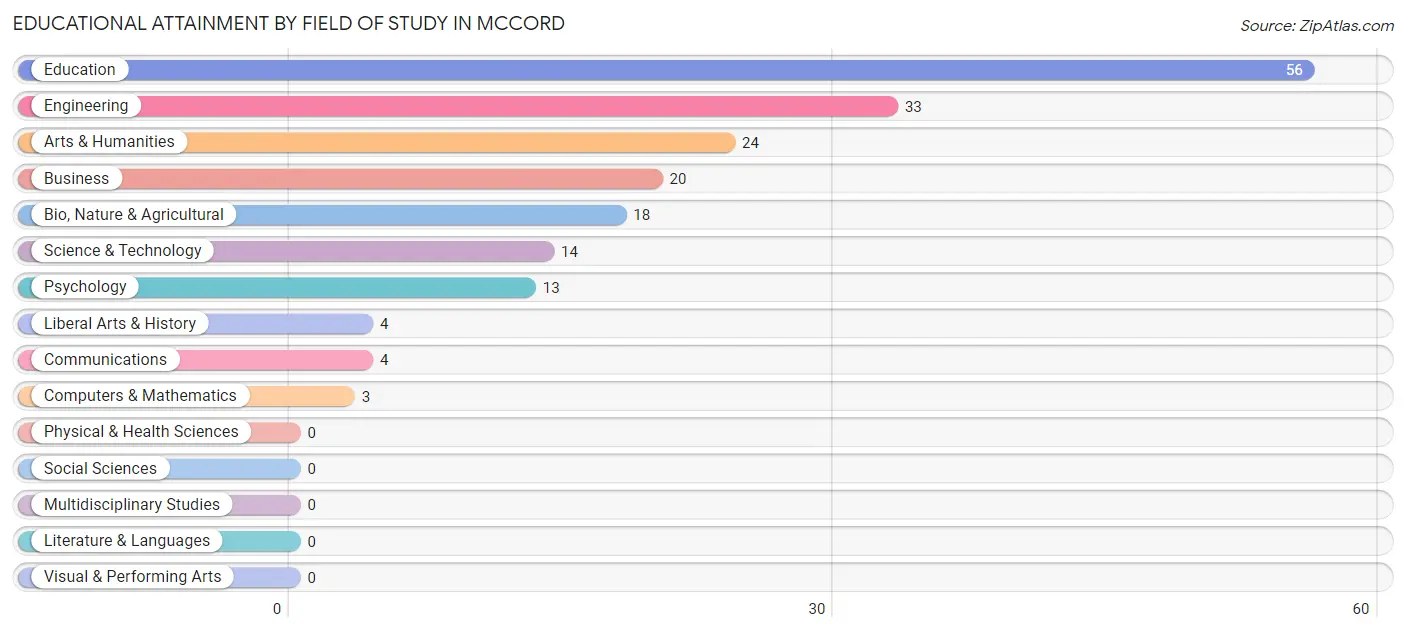
Educational Attainment by Field of Study in McCord
Education (56 | 29.6%), engineering (33 | 17.5%), arts & humanities (24 | 12.7%), business (20 | 10.6%), and bio, nature & agricultural (18 | 9.5%) are the most common fields of study among 189 individuals in McCord who have obtained a bachelor's degree or higher.
| Field of Study | # Graduates | % Graduates |
| Computers & Mathematics | 3 | 1.6% |
| Bio, Nature & Agricultural | 18 | 9.5% |
| Physical & Health Sciences | 0 | 0.0% |
| Psychology | 13 | 6.9% |
| Social Sciences | 0 | 0.0% |
| Engineering | 33 | 17.5% |
| Multidisciplinary Studies | 0 | 0.0% |
| Science & Technology | 14 | 7.4% |
| Business | 20 | 10.6% |
| Education | 56 | 29.6% |
| Literature & Languages | 0 | 0.0% |
| Liberal Arts & History | 4 | 2.1% |
| Visual & Performing Arts | 0 | 0.0% |
| Communications | 4 | 2.1% |
| Arts & Humanities | 24 | 12.7% |
| Total | 189 | 100.0% |
Transportation & Commute in McCord
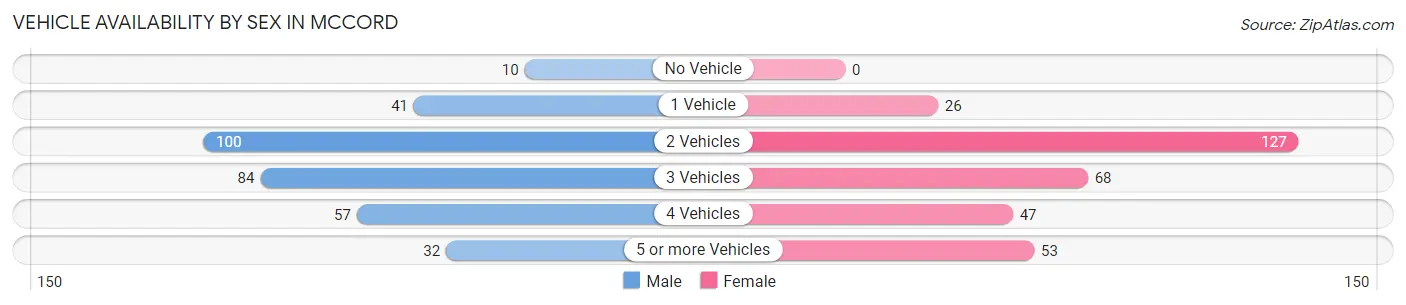
Vehicle Availability by Sex in McCord
The most prevalent vehicle ownership categories in McCord are males with 2 vehicles (100, accounting for 30.9%) and females with 2 vehicles (127, making up 31.1%).
| Vehicles Available | Male | Female |
| No Vehicle | 10 (3.1%) | 0 (0.0%) |
| 1 Vehicle | 41 (12.7%) | 26 (8.1%) |
| 2 Vehicles | 100 (30.9%) | 127 (39.6%) |
| 3 Vehicles | 84 (25.9%) | 68 (21.2%) |
| 4 Vehicles | 57 (17.6%) | 47 (14.6%) |
| 5 or more Vehicles | 32 (9.9%) | 53 (16.5%) |
| Total | 324 (100.0%) | 321 (100.0%) |
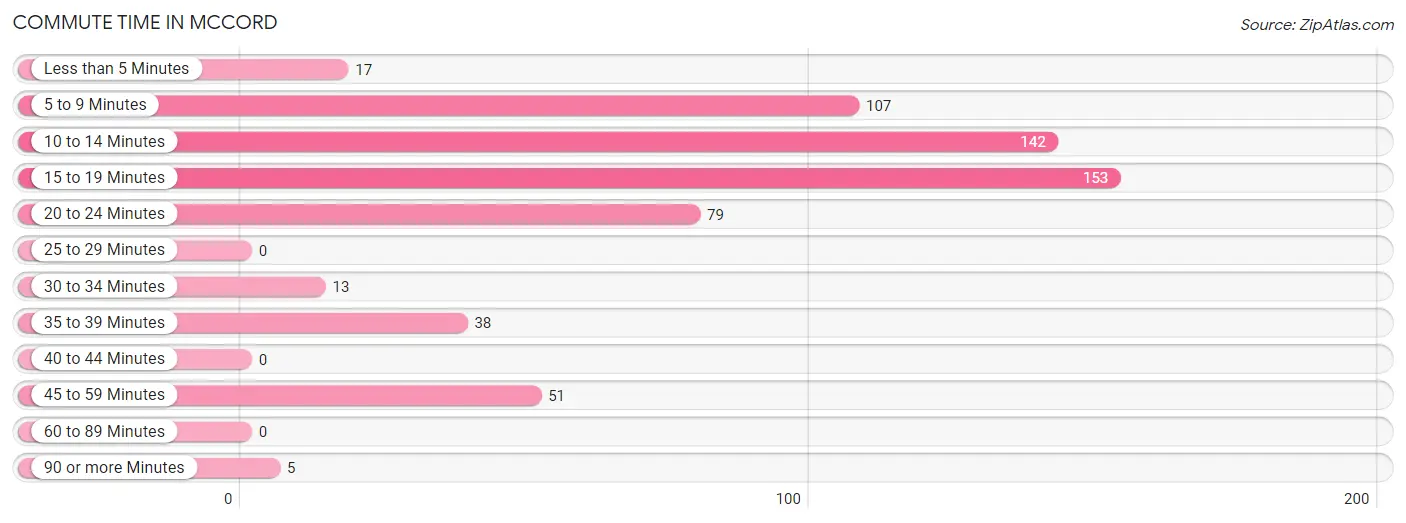
Commute Time in McCord
The most frequently occuring commute durations in McCord are 15 to 19 minutes (153 commuters, 25.3%), 10 to 14 minutes (142 commuters, 23.5%), and 5 to 9 minutes (107 commuters, 17.7%).
| Commute Time | # Commuters | % Commuters |
| Less than 5 Minutes | 17 | 2.8% |
| 5 to 9 Minutes | 107 | 17.7% |
| 10 to 14 Minutes | 142 | 23.5% |
| 15 to 19 Minutes | 153 | 25.3% |
| 20 to 24 Minutes | 79 | 13.1% |
| 25 to 29 Minutes | 0 | 0.0% |
| 30 to 34 Minutes | 13 | 2.1% |
| 35 to 39 Minutes | 38 | 6.3% |
| 40 to 44 Minutes | 0 | 0.0% |
| 45 to 59 Minutes | 51 | 8.4% |
| 60 to 89 Minutes | 0 | 0.0% |
| 90 or more Minutes | 5 | 0.8% |
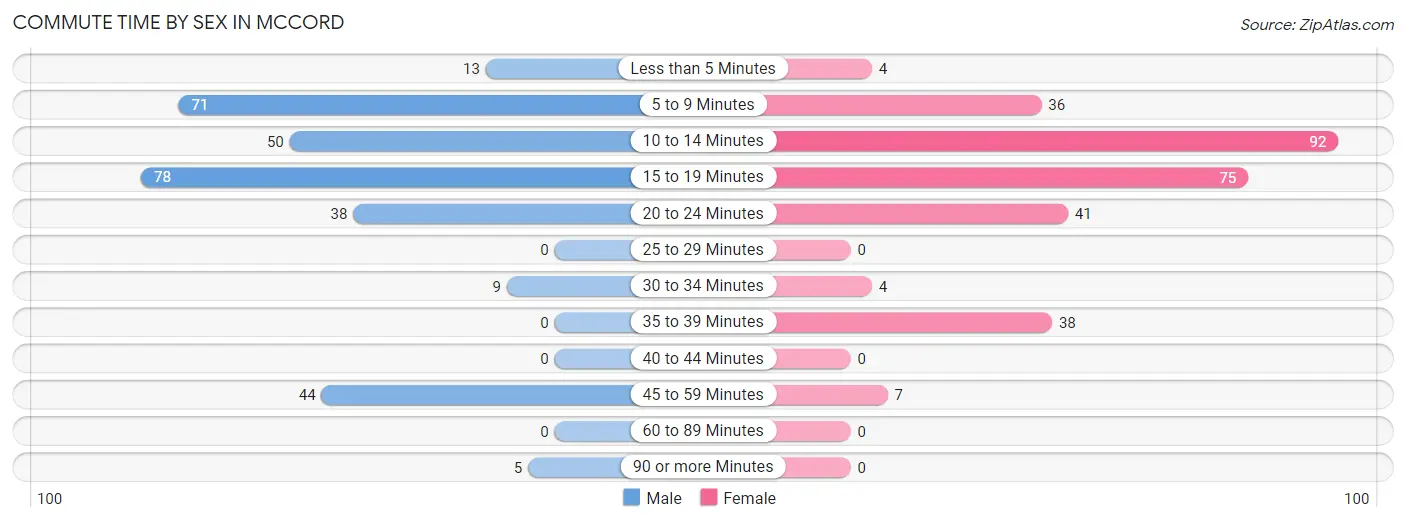
Commute Time by Sex in McCord
The most common commute times in McCord are 15 to 19 minutes (78 commuters, 25.3%) for males and 10 to 14 minutes (92 commuters, 31.0%) for females.
| Commute Time | Male | Female |
| Less than 5 Minutes | 13 (4.2%) | 4 (1.3%) |
| 5 to 9 Minutes | 71 (23.1%) | 36 (12.1%) |
| 10 to 14 Minutes | 50 (16.2%) | 92 (31.0%) |
| 15 to 19 Minutes | 78 (25.3%) | 75 (25.3%) |
| 20 to 24 Minutes | 38 (12.3%) | 41 (13.8%) |
| 25 to 29 Minutes | 0 (0.0%) | 0 (0.0%) |
| 30 to 34 Minutes | 9 (2.9%) | 4 (1.3%) |
| 35 to 39 Minutes | 0 (0.0%) | 38 (12.8%) |
| 40 to 44 Minutes | 0 (0.0%) | 0 (0.0%) |
| 45 to 59 Minutes | 44 (14.3%) | 7 (2.4%) |
| 60 to 89 Minutes | 0 (0.0%) | 0 (0.0%) |
| 90 or more Minutes | 5 (1.6%) | 0 (0.0%) |
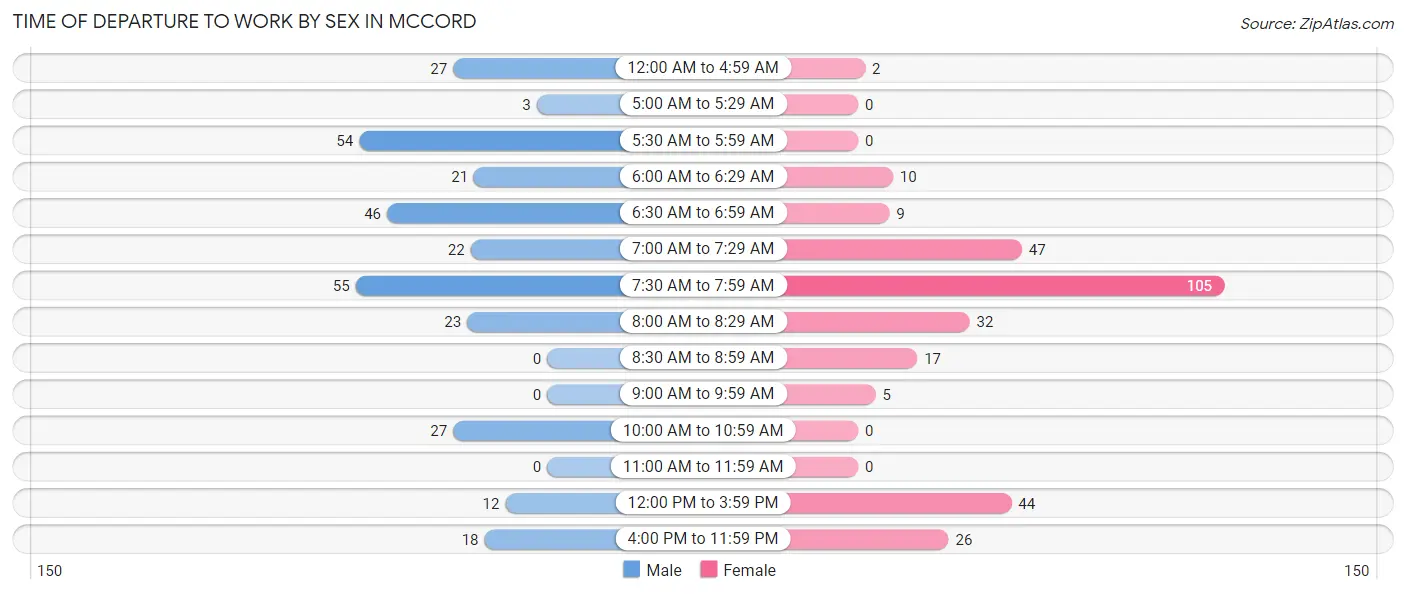
Time of Departure to Work by Sex in McCord
The most frequent times of departure to work in McCord are 7:30 AM to 7:59 AM (55, 17.9%) for males and 7:30 AM to 7:59 AM (105, 35.3%) for females.
| Time of Departure | Male | Female |
| 12:00 AM to 4:59 AM | 27 (8.8%) | 2 (0.7%) |
| 5:00 AM to 5:29 AM | 3 (1.0%) | 0 (0.0%) |
| 5:30 AM to 5:59 AM | 54 (17.5%) | 0 (0.0%) |
| 6:00 AM to 6:29 AM | 21 (6.8%) | 10 (3.4%) |
| 6:30 AM to 6:59 AM | 46 (14.9%) | 9 (3.0%) |
| 7:00 AM to 7:29 AM | 22 (7.1%) | 47 (15.8%) |
| 7:30 AM to 7:59 AM | 55 (17.9%) | 105 (35.3%) |
| 8:00 AM to 8:29 AM | 23 (7.5%) | 32 (10.8%) |
| 8:30 AM to 8:59 AM | 0 (0.0%) | 17 (5.7%) |
| 9:00 AM to 9:59 AM | 0 (0.0%) | 5 (1.7%) |
| 10:00 AM to 10:59 AM | 27 (8.8%) | 0 (0.0%) |
| 11:00 AM to 11:59 AM | 0 (0.0%) | 0 (0.0%) |
| 12:00 PM to 3:59 PM | 12 (3.9%) | 44 (14.8%) |
| 4:00 PM to 11:59 PM | 18 (5.8%) | 26 (8.7%) |
| Total | 308 (100.0%) | 297 (100.0%) |
Housing Occupancy in McCord
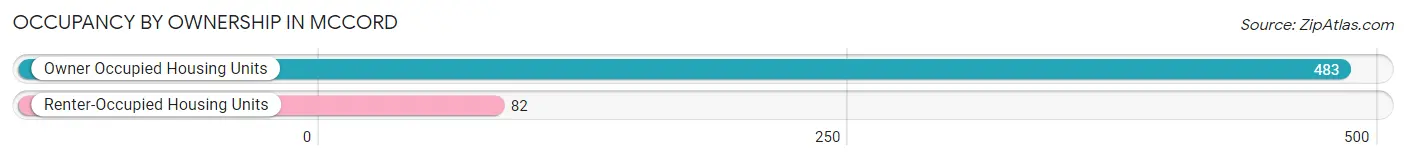
Occupancy by Ownership in McCord
Of the total 565 dwellings in McCord, owner-occupied units account for 483 (85.5%), while renter-occupied units make up 82 (14.5%).
| Occupancy | # Housing Units | % Housing Units |
| Owner Occupied Housing Units | 483 | 85.5% |
| Renter-Occupied Housing Units | 82 | 14.5% |
| Total Occupied Housing Units | 565 | 100.0% |
Occupancy by Household Size in McCord
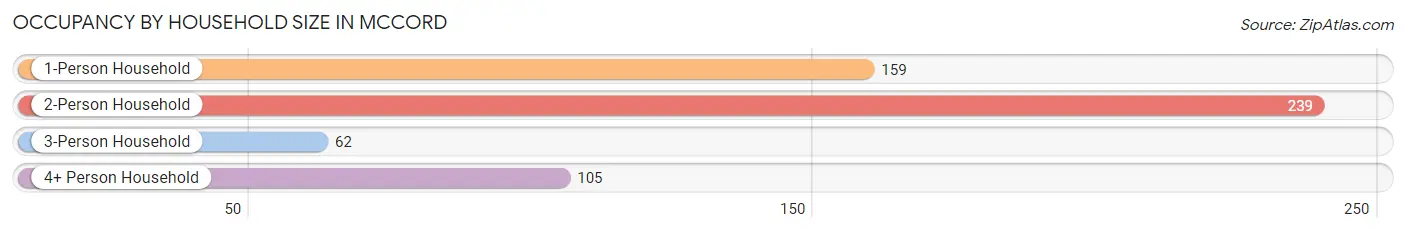
| Household Size | # Housing Units | % Housing Units |
| 1-Person Household | 159 | 28.1% |
| 2-Person Household | 239 | 42.3% |
| 3-Person Household | 62 | 11.0% |
| 4+ Person Household | 105 | 18.6% |
| Total Housing Units | 565 | 100.0% |
Occupancy by Ownership by Household Size in McCord
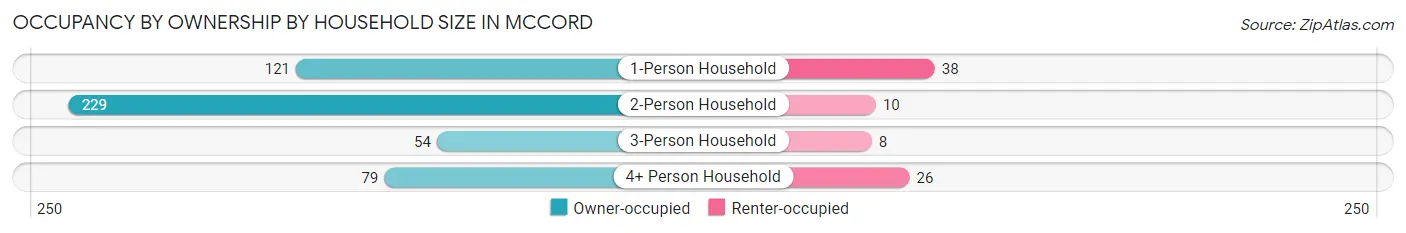
| Household Size | Owner-occupied | Renter-occupied |
| 1-Person Household | 121 (76.1%) | 38 (23.9%) |
| 2-Person Household | 229 (95.8%) | 10 (4.2%) |
| 3-Person Household | 54 (87.1%) | 8 (12.9%) |
| 4+ Person Household | 79 (75.2%) | 26 (24.8%) |
| Total Housing Units | 483 (85.5%) | 82 (14.5%) |
Occupancy by Educational Attainment in McCord
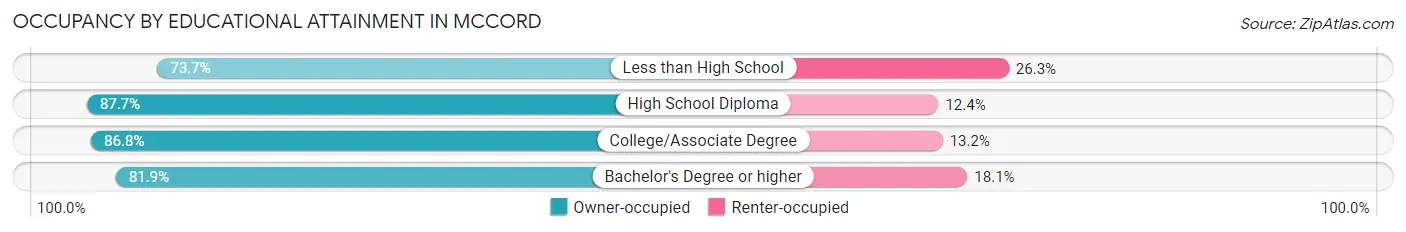
| Household Size | Owner-occupied | Renter-occupied |
| Less than High School | 28 (73.7%) | 10 (26.3%) |
| High School Diploma | 220 (87.6%) | 31 (12.3%) |
| College/Associate Degree | 158 (86.8%) | 24 (13.2%) |
| Bachelor's Degree or higher | 77 (81.9%) | 17 (18.1%) |
Occupancy by Age of Householder in McCord
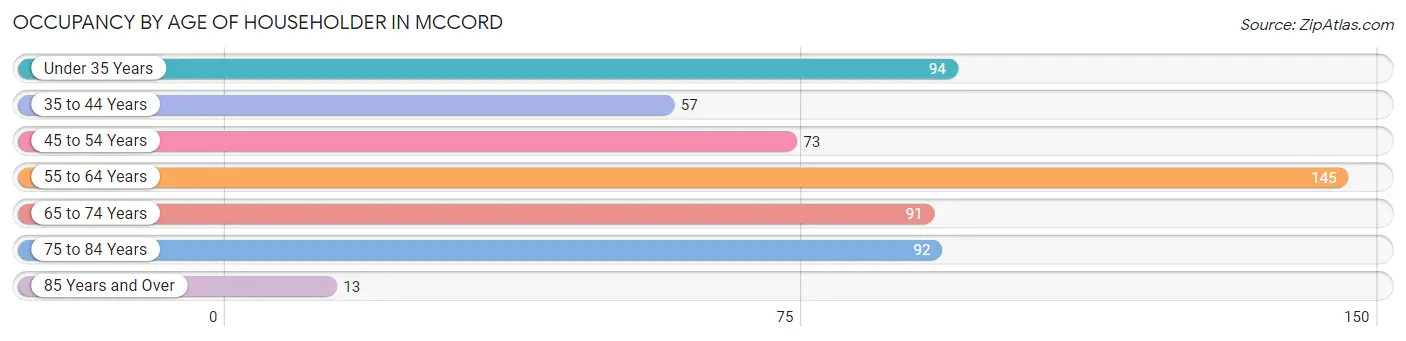
| Age Bracket | # Households | % Households |
| Under 35 Years | 94 | 16.6% |
| 35 to 44 Years | 57 | 10.1% |
| 45 to 54 Years | 73 | 12.9% |
| 55 to 64 Years | 145 | 25.7% |
| 65 to 74 Years | 91 | 16.1% |
| 75 to 84 Years | 92 | 16.3% |
| 85 Years and Over | 13 | 2.3% |
| Total | 565 | 100.0% |
Housing Finances in McCord
Median Income by Occupancy in McCord
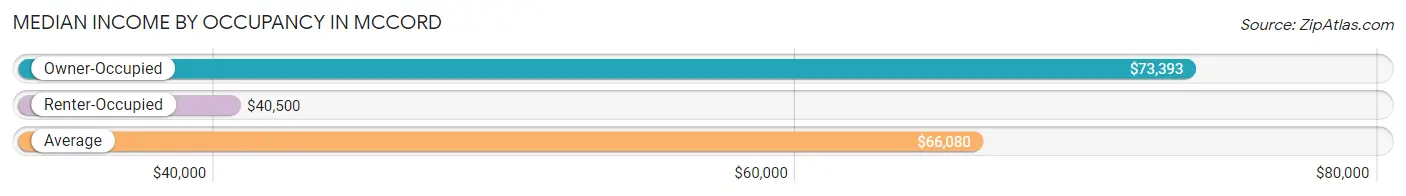
| Occupancy Type | # Households | Median Income |
| Owner-Occupied | 483 (85.5%) | $73,393 |
| Renter-Occupied | 82 (14.5%) | $40,500 |
| Average | 565 (100.0%) | $66,080 |
Occupancy by Householder Income Bracket in McCord
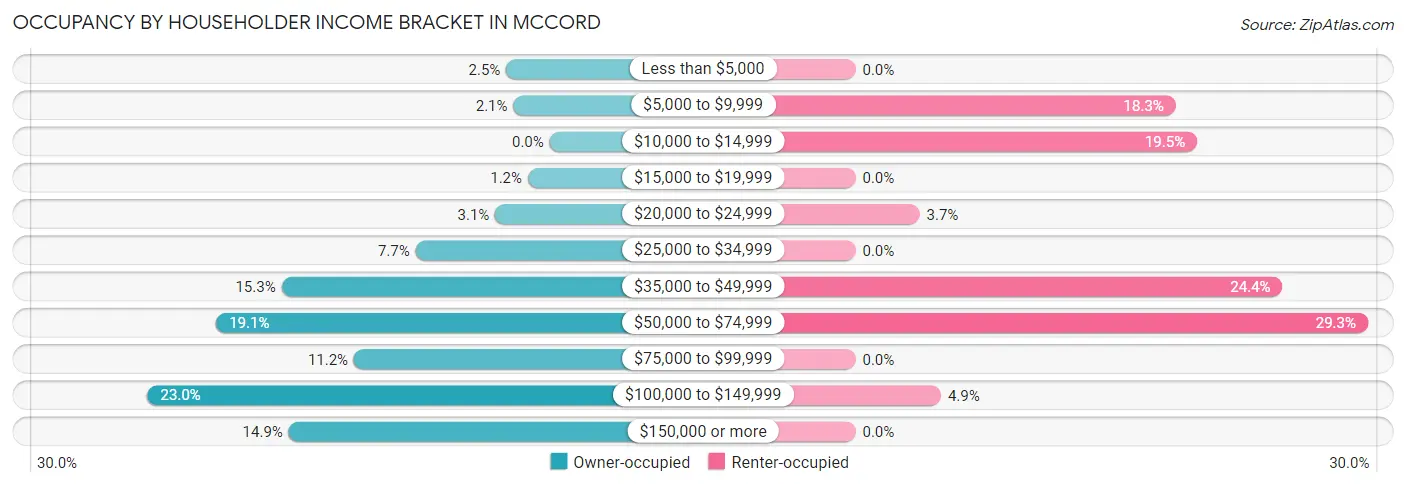
| Income Bracket | Owner-occupied | Renter-occupied |
| Less than $5,000 | 12 (2.5%) | 0 (0.0%) |
| $5,000 to $9,999 | 10 (2.1%) | 15 (18.3%) |
| $10,000 to $14,999 | 0 (0.0%) | 16 (19.5%) |
| $15,000 to $19,999 | 6 (1.2%) | 0 (0.0%) |
| $20,000 to $24,999 | 15 (3.1%) | 3 (3.7%) |
| $25,000 to $34,999 | 37 (7.7%) | 0 (0.0%) |
| $35,000 to $49,999 | 74 (15.3%) | 20 (24.4%) |
| $50,000 to $74,999 | 92 (19.1%) | 24 (29.3%) |
| $75,000 to $99,999 | 54 (11.2%) | 0 (0.0%) |
| $100,000 to $149,999 | 111 (23.0%) | 4 (4.9%) |
| $150,000 or more | 72 (14.9%) | 0 (0.0%) |
| Total | 483 (100.0%) | 82 (100.0%) |
Monthly Housing Cost Tiers in McCord
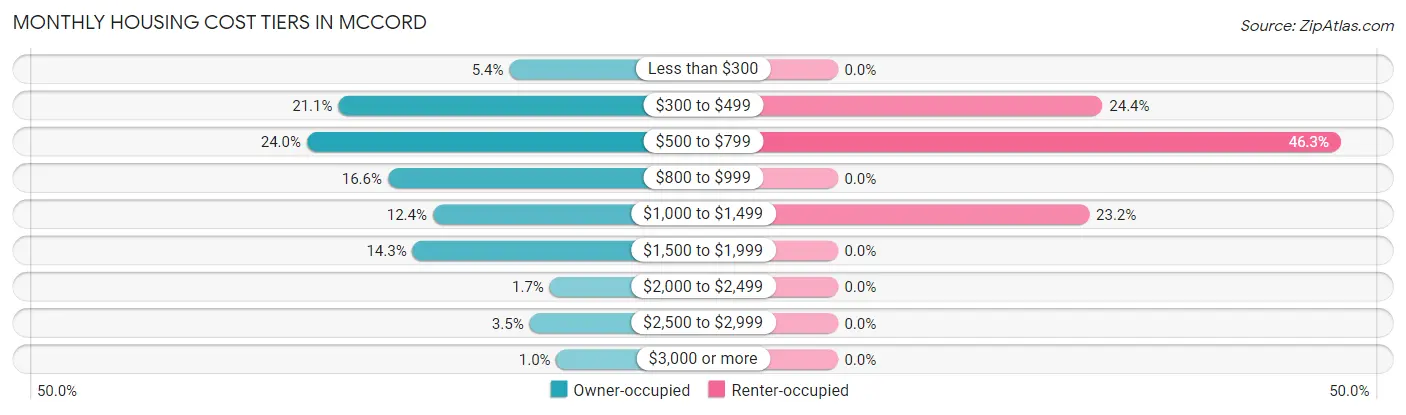
| Monthly Cost | Owner-occupied | Renter-occupied |
| Less than $300 | 26 (5.4%) | 0 (0.0%) |
| $300 to $499 | 102 (21.1%) | 20 (24.4%) |
| $500 to $799 | 116 (24.0%) | 38 (46.3%) |
| $800 to $999 | 80 (16.6%) | 0 (0.0%) |
| $1,000 to $1,499 | 60 (12.4%) | 19 (23.2%) |
| $1,500 to $1,999 | 69 (14.3%) | 0 (0.0%) |
| $2,000 to $2,499 | 8 (1.7%) | 0 (0.0%) |
| $2,500 to $2,999 | 17 (3.5%) | 0 (0.0%) |
| $3,000 or more | 5 (1.0%) | 0 (0.0%) |
| Total | 483 (100.0%) | 82 (100.0%) |
Physical Housing Characteristics in McCord
Housing Structures in McCord
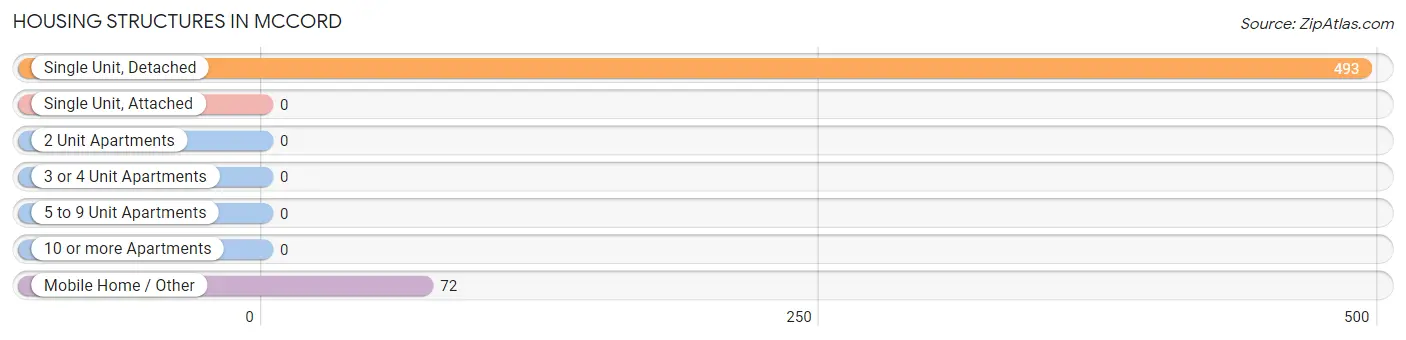
| Structure Type | # Housing Units | % Housing Units |
| Single Unit, Detached | 493 | 87.3% |
| Single Unit, Attached | 0 | 0.0% |
| 2 Unit Apartments | 0 | 0.0% |
| 3 or 4 Unit Apartments | 0 | 0.0% |
| 5 to 9 Unit Apartments | 0 | 0.0% |
| 10 or more Apartments | 0 | 0.0% |
| Mobile Home / Other | 72 | 12.7% |
| Total | 565 | 100.0% |
Housing Structures by Occupancy in McCord
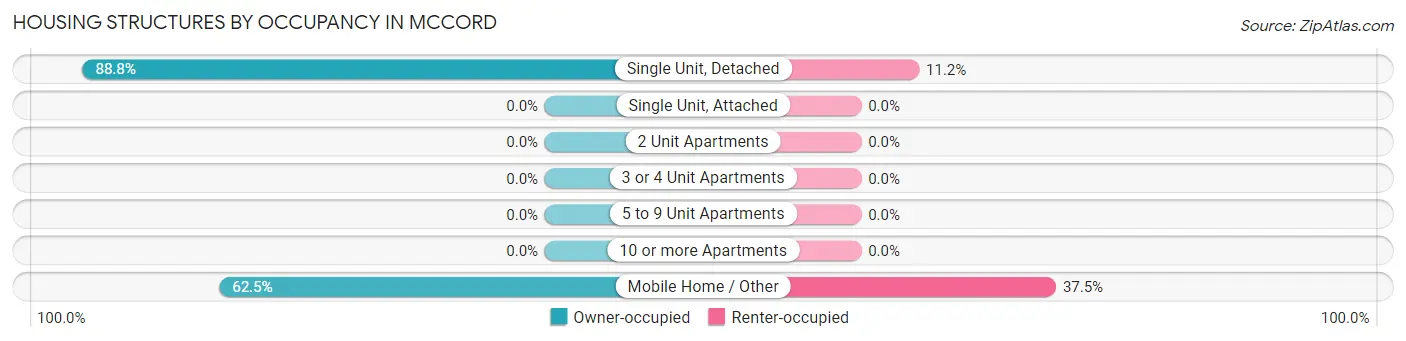
| Structure Type | Owner-occupied | Renter-occupied |
| Single Unit, Detached | 438 (88.8%) | 55 (11.2%) |
| Single Unit, Attached | 0 (0.0%) | 0 (0.0%) |
| 2 Unit Apartments | 0 (0.0%) | 0 (0.0%) |
| 3 or 4 Unit Apartments | 0 (0.0%) | 0 (0.0%) |
| 5 to 9 Unit Apartments | 0 (0.0%) | 0 (0.0%) |
| 10 or more Apartments | 0 (0.0%) | 0 (0.0%) |
| Mobile Home / Other | 45 (62.5%) | 27 (37.5%) |
| Total | 483 (85.5%) | 82 (14.5%) |
Housing Structures by Number of Rooms in McCord
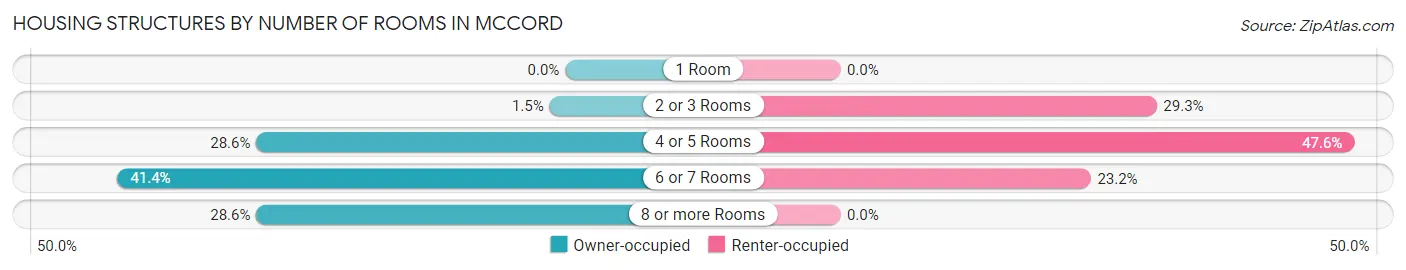
| Number of Rooms | Owner-occupied | Renter-occupied |
| 1 Room | 0 (0.0%) | 0 (0.0%) |
| 2 or 3 Rooms | 7 (1.5%) | 24 (29.3%) |
| 4 or 5 Rooms | 138 (28.6%) | 39 (47.6%) |
| 6 or 7 Rooms | 200 (41.4%) | 19 (23.2%) |
| 8 or more Rooms | 138 (28.6%) | 0 (0.0%) |
| Total | 483 (100.0%) | 82 (100.0%) |
Housing Structure by Heating Type in McCord
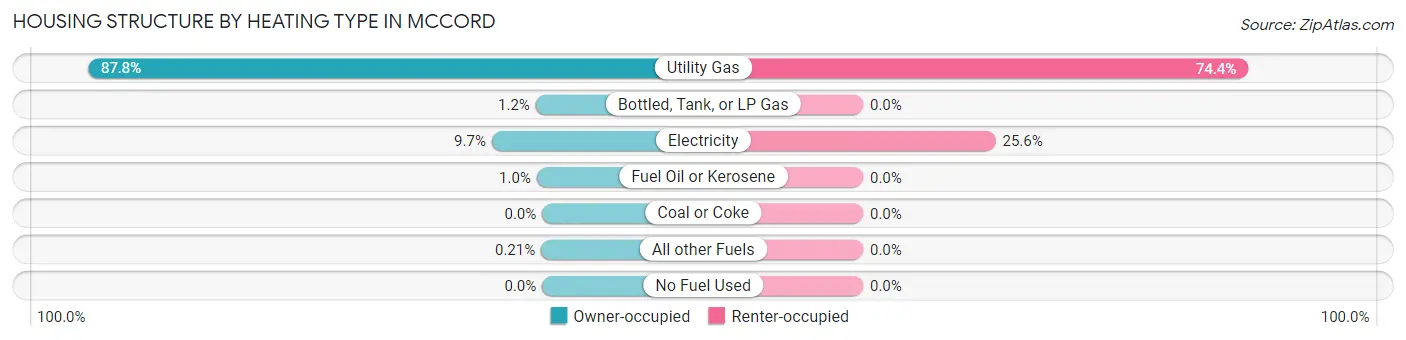
| Heating Type | Owner-occupied | Renter-occupied |
| Utility Gas | 424 (87.8%) | 61 (74.4%) |
| Bottled, Tank, or LP Gas | 6 (1.2%) | 0 (0.0%) |
| Electricity | 47 (9.7%) | 21 (25.6%) |
| Fuel Oil or Kerosene | 5 (1.0%) | 0 (0.0%) |
| Coal or Coke | 0 (0.0%) | 0 (0.0%) |
| All other Fuels | 1 (0.2%) | 0 (0.0%) |
| No Fuel Used | 0 (0.0%) | 0 (0.0%) |
| Total | 483 (100.0%) | 82 (100.0%) |
Household Vehicle Usage in McCord
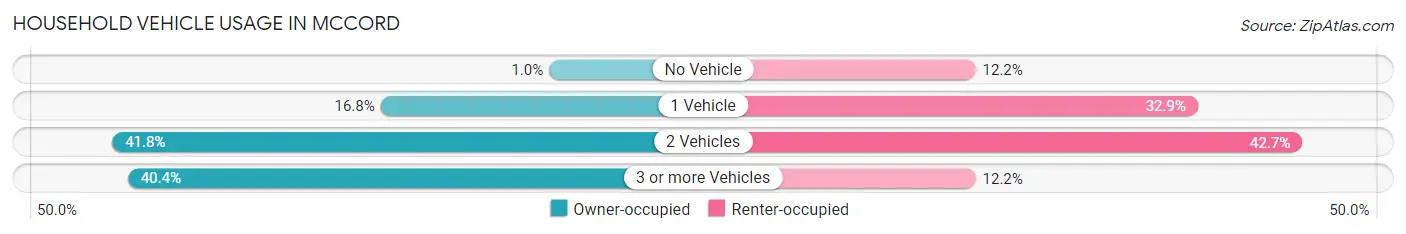
| Vehicles per Household | Owner-occupied | Renter-occupied |
| No Vehicle | 5 (1.0%) | 10 (12.2%) |
| 1 Vehicle | 81 (16.8%) | 27 (32.9%) |
| 2 Vehicles | 202 (41.8%) | 35 (42.7%) |
| 3 or more Vehicles | 195 (40.4%) | 10 (12.2%) |
| Total | 483 (100.0%) | 82 (100.0%) |
Real Estate & Mortgages in McCord
Real Estate and Mortgage Overview in McCord
| Characteristic | Without Mortgage | With Mortgage |
| Housing Units | 261 | 222 |
| Median Property Value | $173,500 | $166,000 |
| Median Household Income | $69,250 | $25 |
| Monthly Housing Costs | $534 | $5 |
| Real Estate Taxes | $1,426 | $0 |
Property Value by Mortgage Status in McCord
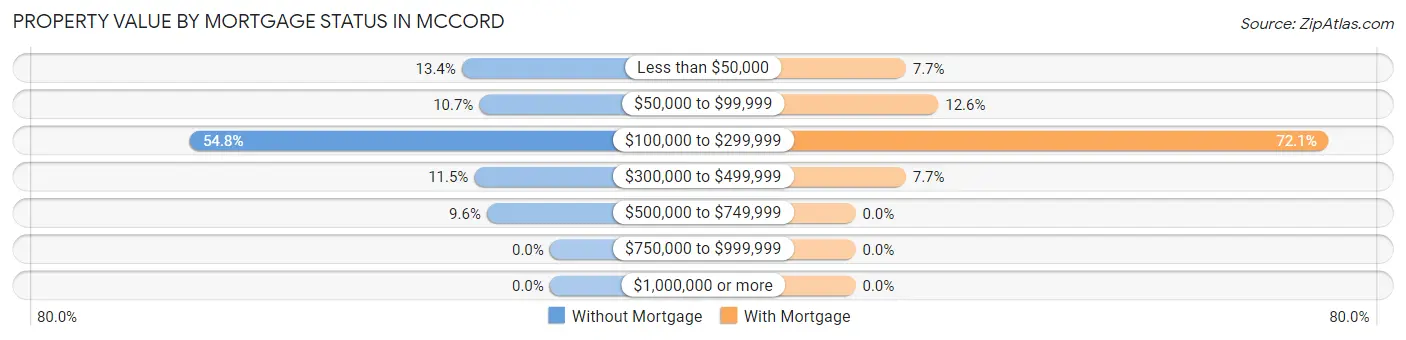
| Property Value | Without Mortgage | With Mortgage |
| Less than $50,000 | 35 (13.4%) | 17 (7.7%) |
| $50,000 to $99,999 | 28 (10.7%) | 28 (12.6%) |
| $100,000 to $299,999 | 143 (54.8%) | 160 (72.1%) |
| $300,000 to $499,999 | 30 (11.5%) | 17 (7.7%) |
| $500,000 to $749,999 | 25 (9.6%) | 0 (0.0%) |
| $750,000 to $999,999 | 0 (0.0%) | 0 (0.0%) |
| $1,000,000 or more | 0 (0.0%) | 0 (0.0%) |
| Total | 261 (100.0%) | 222 (100.0%) |
Household Income by Mortgage Status in McCord
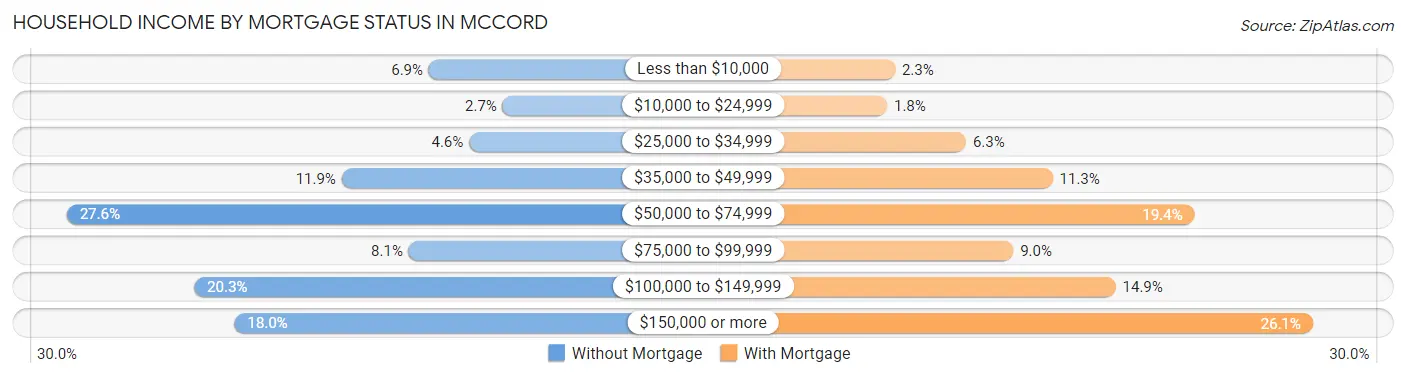
| Household Income | Without Mortgage | With Mortgage |
| Less than $10,000 | 18 (6.9%) | 5 (2.2%) |
| $10,000 to $24,999 | 7 (2.7%) | 4 (1.8%) |
| $25,000 to $34,999 | 12 (4.6%) | 14 (6.3%) |
| $35,000 to $49,999 | 31 (11.9%) | 25 (11.3%) |
| $50,000 to $74,999 | 72 (27.6%) | 43 (19.4%) |
| $75,000 to $99,999 | 21 (8.1%) | 20 (9.0%) |
| $100,000 to $149,999 | 53 (20.3%) | 33 (14.9%) |
| $150,000 or more | 47 (18.0%) | 58 (26.1%) |
| Total | 261 (100.0%) | 222 (100.0%) |
Property Value to Household Income Ratio in McCord
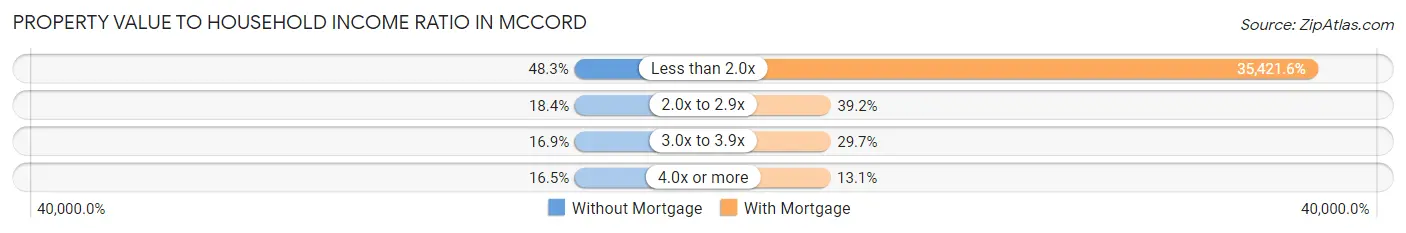
| Value-to-Income Ratio | Without Mortgage | With Mortgage |
| Less than 2.0x | 126 (48.3%) | 78,636 (35,421.6%) |
| 2.0x to 2.9x | 48 (18.4%) | 87 (39.2%) |
| 3.0x to 3.9x | 44 (16.9%) | 66 (29.7%) |
| 4.0x or more | 43 (16.5%) | 29 (13.1%) |
| Total | 261 (100.0%) | 222 (100.0%) |
Real Estate Taxes by Mortgage Status in McCord
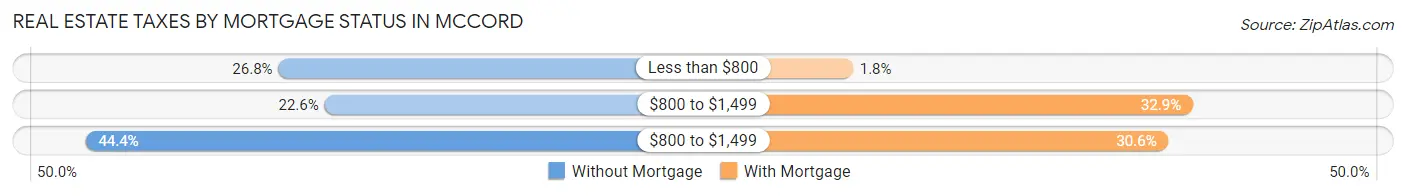
| Property Taxes | Without Mortgage | With Mortgage |
| Less than $800 | 70 (26.8%) | 4 (1.8%) |
| $800 to $1,499 | 59 (22.6%) | 73 (32.9%) |
| $800 to $1,499 | 116 (44.4%) | 68 (30.6%) |
| Total | 261 (100.0%) | 222 (100.0%) |
Health & Disability in McCord
Health Insurance Coverage by Age in McCord
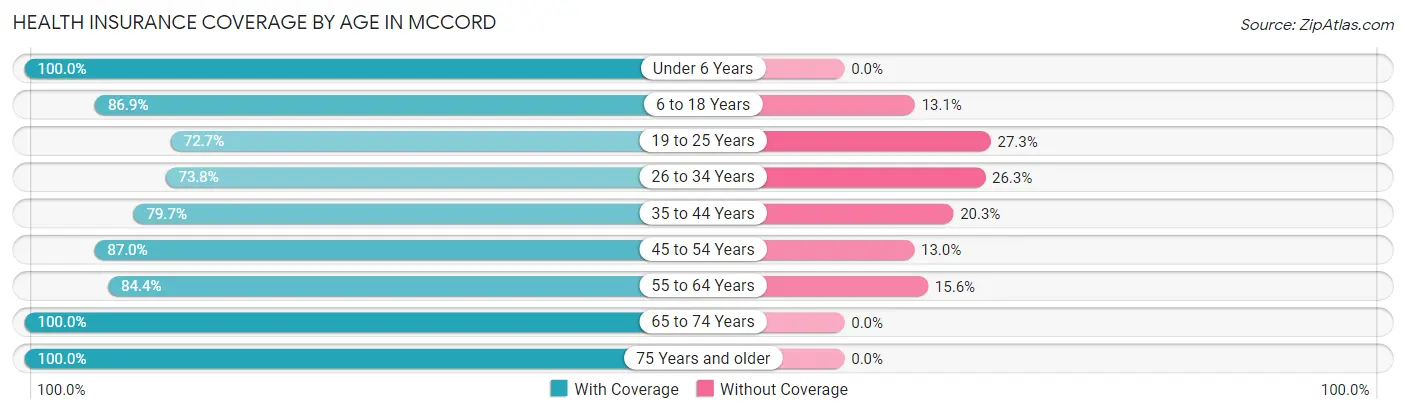
| Age Bracket | With Coverage | Without Coverage |
| Under 6 Years | 74 (100.0%) | 0 (0.0%) |
| 6 to 18 Years | 225 (86.9%) | 34 (13.1%) |
| 19 to 25 Years | 128 (72.7%) | 48 (27.3%) |
| 26 to 34 Years | 118 (73.8%) | 42 (26.3%) |
| 35 to 44 Years | 102 (79.7%) | 26 (20.3%) |
| 45 to 54 Years | 127 (87.0%) | 19 (13.0%) |
| 55 to 64 Years | 222 (84.4%) | 41 (15.6%) |
| 65 to 74 Years | 151 (100.0%) | 0 (0.0%) |
| 75 Years and older | 268 (100.0%) | 0 (0.0%) |
| Total | 1,415 (87.1%) | 210 (12.9%) |
Health Insurance Coverage by Citizenship Status in McCord
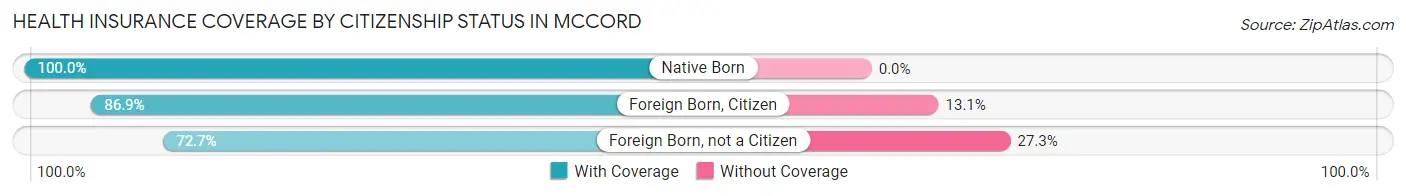
| Citizenship Status | With Coverage | Without Coverage |
| Native Born | 74 (100.0%) | 0 (0.0%) |
| Foreign Born, Citizen | 225 (86.9%) | 34 (13.1%) |
| Foreign Born, not a Citizen | 128 (72.7%) | 48 (27.3%) |
Health Insurance Coverage by Household Income in McCord
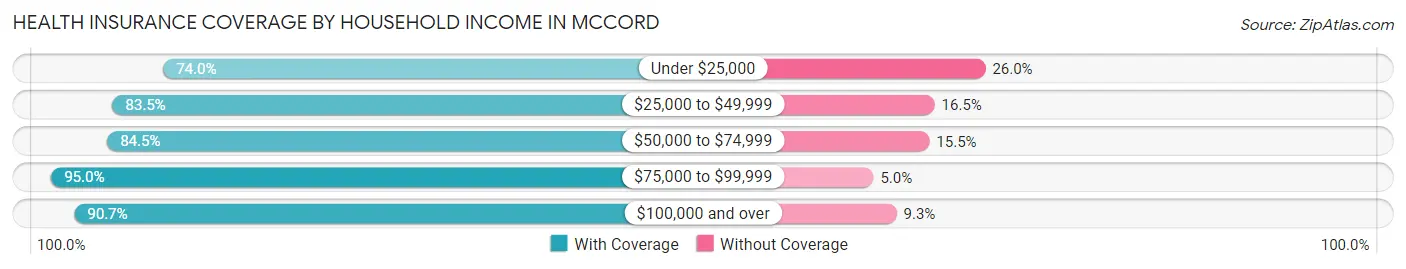
| Household Income | With Coverage | Without Coverage |
| Under $25,000 | 94 (74.0%) | 33 (26.0%) |
| $25,000 to $49,999 | 264 (83.5%) | 52 (16.5%) |
| $50,000 to $74,999 | 262 (84.5%) | 48 (15.5%) |
| $75,000 to $99,999 | 95 (95.0%) | 5 (5.0%) |
| $100,000 and over | 700 (90.7%) | 72 (9.3%) |
Public vs Private Health Insurance Coverage by Age in McCord
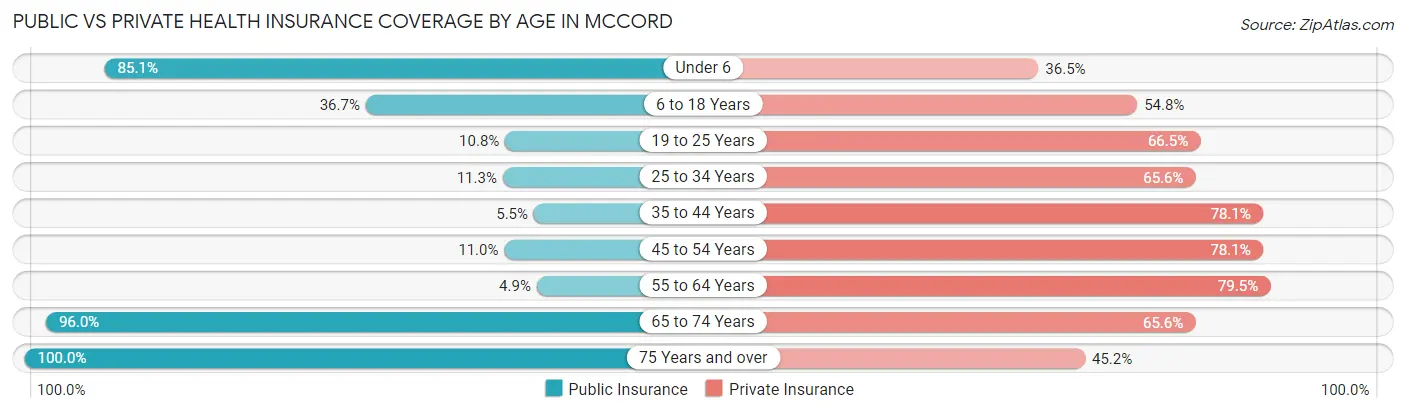
| Age Bracket | Public Insurance | Private Insurance |
| Under 6 | 63 (85.1%) | 27 (36.5%) |
| 6 to 18 Years | 95 (36.7%) | 142 (54.8%) |
| 19 to 25 Years | 19 (10.8%) | 117 (66.5%) |
| 25 to 34 Years | 18 (11.3%) | 105 (65.6%) |
| 35 to 44 Years | 7 (5.5%) | 100 (78.1%) |
| 45 to 54 Years | 16 (11.0%) | 114 (78.1%) |
| 55 to 64 Years | 13 (4.9%) | 209 (79.5%) |
| 65 to 74 Years | 145 (96.0%) | 99 (65.6%) |
| 75 Years and over | 268 (100.0%) | 121 (45.2%) |
| Total | 644 (39.6%) | 1,034 (63.6%) |
Disability Status by Sex by Age in McCord
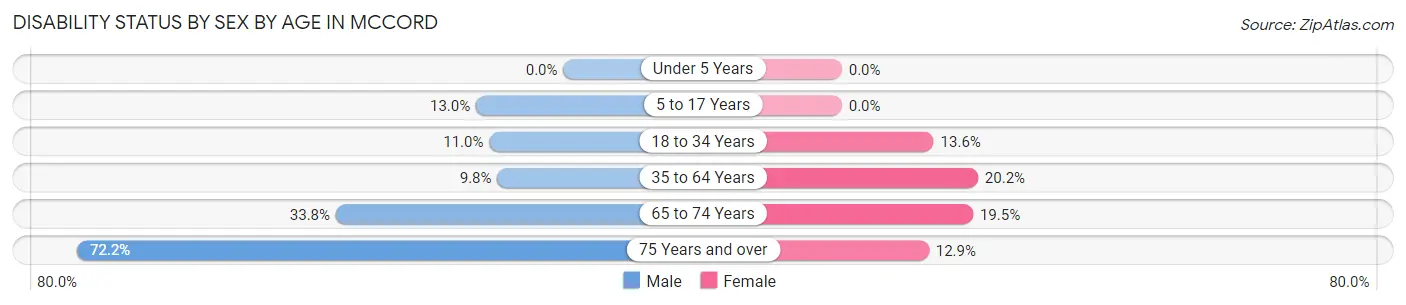
| Age Bracket | Male | Female |
| Under 5 Years | 0 (0.0%) | 0 (0.0%) |
| 5 to 17 Years | 28 (13.0%) | 0 (0.0%) |
| 18 to 34 Years | 23 (11.0%) | 18 (13.6%) |
| 35 to 64 Years | 24 (9.8%) | 59 (20.2%) |
| 65 to 74 Years | 25 (33.8%) | 15 (19.5%) |
| 75 Years and over | 65 (72.2%) | 23 (12.9%) |
Disability Class by Sex by Age in McCord
Disability Class: Hearing Difficulty
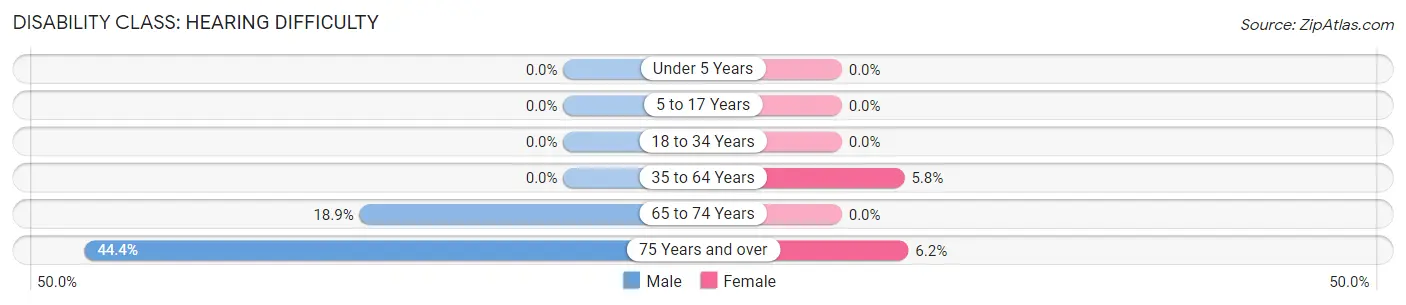
| Age Bracket | Male | Female |
| Under 5 Years | 0 (0.0%) | 0 (0.0%) |
| 5 to 17 Years | 0 (0.0%) | 0 (0.0%) |
| 18 to 34 Years | 0 (0.0%) | 0 (0.0%) |
| 35 to 64 Years | 0 (0.0%) | 17 (5.8%) |
| 65 to 74 Years | 14 (18.9%) | 0 (0.0%) |
| 75 Years and over | 40 (44.4%) | 11 (6.2%) |
Disability Class: Vision Difficulty
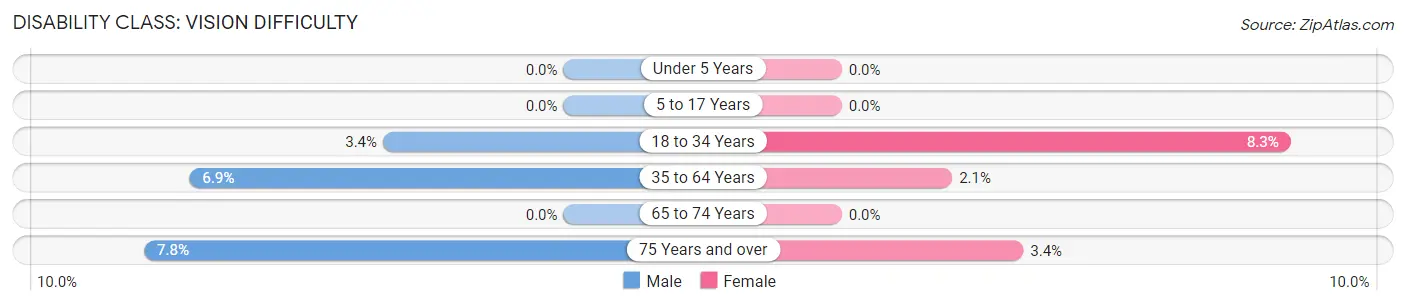
| Age Bracket | Male | Female |
| Under 5 Years | 0 (0.0%) | 0 (0.0%) |
| 5 to 17 Years | 0 (0.0%) | 0 (0.0%) |
| 18 to 34 Years | 7 (3.4%) | 11 (8.3%) |
| 35 to 64 Years | 17 (6.9%) | 6 (2.1%) |
| 65 to 74 Years | 0 (0.0%) | 0 (0.0%) |
| 75 Years and over | 7 (7.8%) | 6 (3.4%) |
Disability Class: Cognitive Difficulty
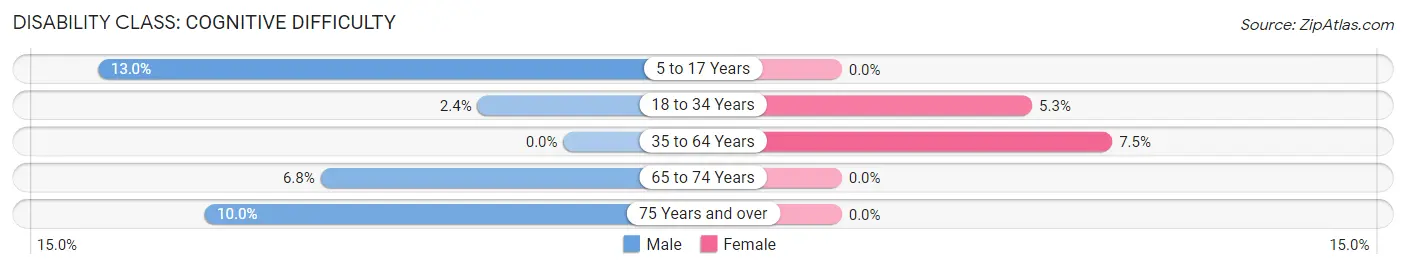
| Age Bracket | Male | Female |
| 5 to 17 Years | 28 (13.0%) | 0 (0.0%) |
| 18 to 34 Years | 5 (2.4%) | 7 (5.3%) |
| 35 to 64 Years | 0 (0.0%) | 22 (7.5%) |
| 65 to 74 Years | 5 (6.8%) | 0 (0.0%) |
| 75 Years and over | 9 (10.0%) | 0 (0.0%) |
Disability Class: Ambulatory Difficulty
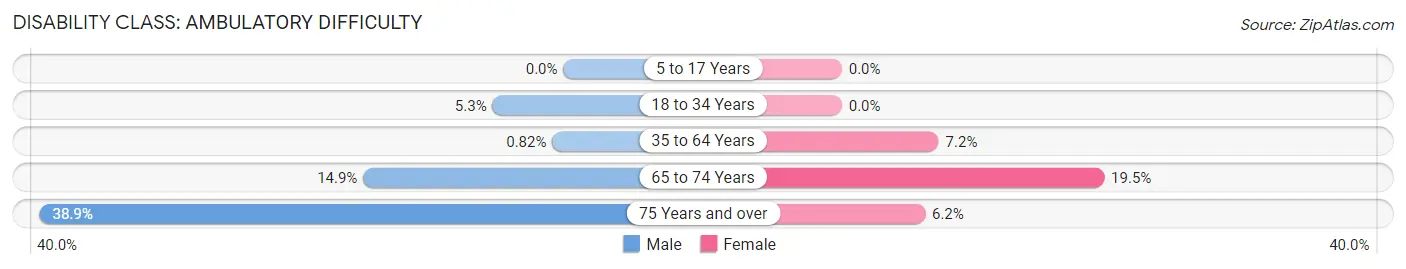
| Age Bracket | Male | Female |
| 5 to 17 Years | 0 (0.0%) | 0 (0.0%) |
| 18 to 34 Years | 11 (5.3%) | 0 (0.0%) |
| 35 to 64 Years | 2 (0.8%) | 21 (7.2%) |
| 65 to 74 Years | 11 (14.9%) | 15 (19.5%) |
| 75 Years and over | 35 (38.9%) | 11 (6.2%) |
Disability Class: Self-Care Difficulty
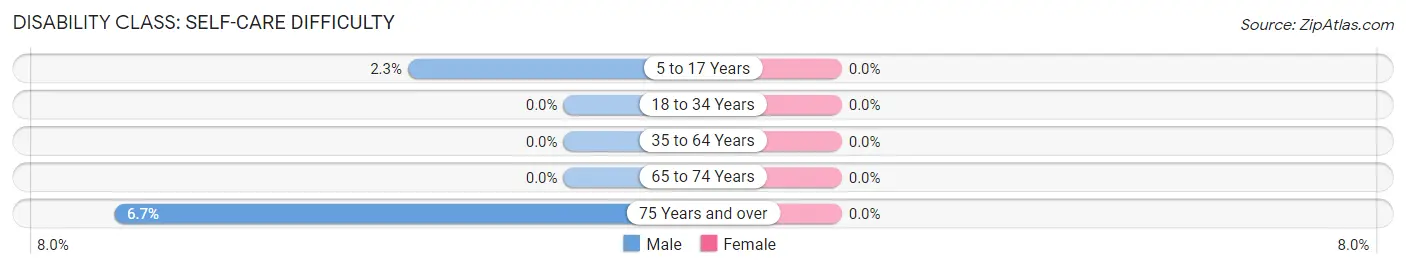
| Age Bracket | Male | Female |
| 5 to 17 Years | 5 (2.3%) | 0 (0.0%) |
| 18 to 34 Years | 0 (0.0%) | 0 (0.0%) |
| 35 to 64 Years | 0 (0.0%) | 0 (0.0%) |
| 65 to 74 Years | 0 (0.0%) | 0 (0.0%) |
| 75 Years and over | 6 (6.7%) | 0 (0.0%) |
Technology Access in McCord
Computing Device Access in McCord
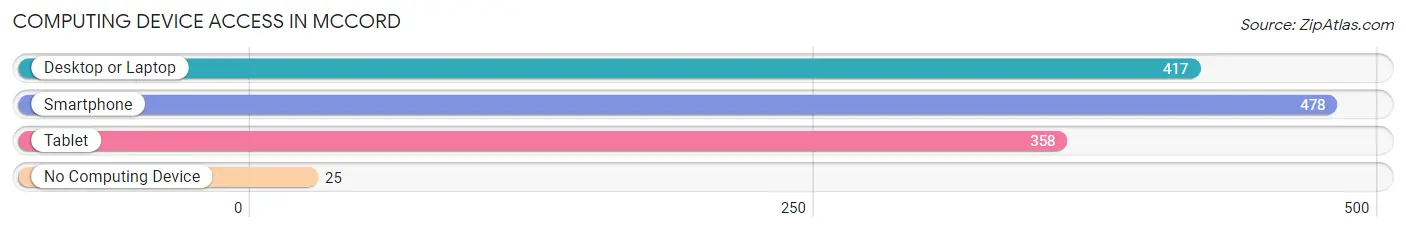
| Device Type | # Households | % Households |
| Desktop or Laptop | 417 | 73.8% |
| Smartphone | 478 | 84.6% |
| Tablet | 358 | 63.4% |
| No Computing Device | 25 | 4.4% |
| Total | 565 | 100.0% |
Internet Access in McCord
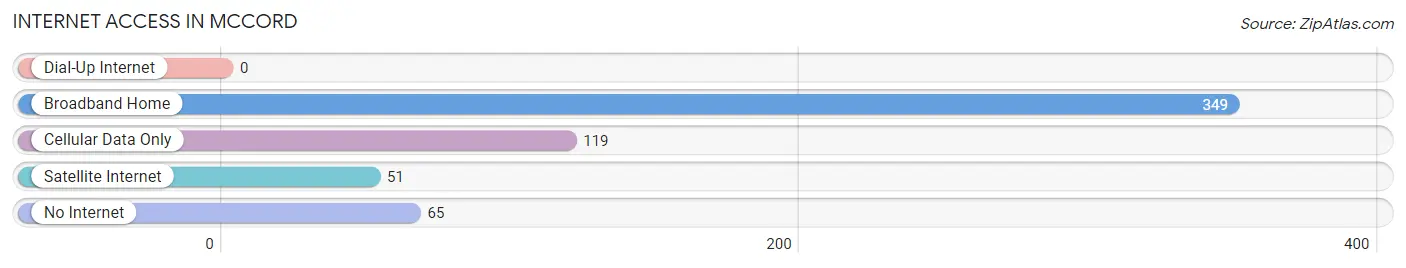
| Internet Type | # Households | % Households |
| Dial-Up Internet | 0 | 0.0% |
| Broadband Home | 349 | 61.8% |
| Cellular Data Only | 119 | 21.1% |
| Satellite Internet | 51 | 9.0% |
| No Internet | 65 | 11.5% |
| Total | 565 | 100.0% |
McCord Summary
Mccord is a small town located in the state of Oklahoma, in the United States. It is situated in the southeastern part of the state, in the county of Pittsburg. The town has a population of approximately 500 people, and is located about 20 miles south of McAlester.
Geography
Mccord is located in the southeastern part of Oklahoma, in the county of Pittsburg. It is situated in the foothills of the Ouachita Mountains, and is surrounded by rolling hills and wooded areas. The town is located about 20 miles south of McAlester, and is situated along the banks of the Mccord Creek. The town is located at an elevation of about 600 feet above sea level.
The climate in Mccord is generally mild, with temperatures ranging from the mid-50s in the winter to the mid-80s in the summer. The town receives an average of about 40 inches of precipitation each year, with most of it falling in the spring and summer months.
Economy
The economy of Mccord is largely based on agriculture and forestry. The town is home to several small farms, which produce a variety of crops, including corn, soybeans, wheat, and hay. The town also has several sawmills, which produce lumber for the local market.
In addition to agriculture and forestry, Mccord is also home to several small businesses, including a grocery store, a hardware store, and a few restaurants. The town also has a post office, a bank, and a few other small businesses.
Demographics
As of the 2010 census, the population of Mccord was 498 people. The racial makeup of the town was 95.2% White, 0.2% African American, 0.4% Native American, 0.2% Asian, 0.2% from other races, and 3.8% from two or more races. Hispanic or Latino of any race were 1.2% of the population.
The median household income in Mccord was $30,000, and the median family income was $35,000. The per capita income for the town was $14,000. About 17.2% of the population was below the poverty line.
Conclusion
Mccord is a small town located in the southeastern part of Oklahoma. It has a population of about 500 people, and is situated in the foothills of the Ouachita Mountains. The town is largely supported by agriculture and forestry, and is home to several small businesses. The population of Mccord is mostly White, with a small percentage of African American, Native American, and Asian residents. The median household income in Mccord is $30,000, and the per capita income is $14,000.
Common Questions
What is the Total Population of McCord?
Total Population of McCord is 1,625.
What is the Total Male Population of McCord?
Total Male Population of McCord is 863.
What is the Total Female Population of McCord?
Total Female Population of McCord is 762.
What is the Ratio of Males per 100 Females in McCord?
There are 113.25 Males per 100 Females in McCord.
What is the Ratio of Females per 100 Males in McCord?
There are 88.30 Females per 100 Males in McCord.
What is the Median Population Age in McCord?
Median Population Age in McCord is 47.2 Years.
What is the Average Family Size in McCord
Average Family Size in McCord is 3.5 People.
What is the Average Household Size in McCord
Average Household Size in McCord is 2.9 People.
What is Per Capita Income in McCord?
Per Capita income in McCord is $37,324.
What is the Median Family Income in McCord?
Median Family Income in McCord is $80,000.
What is the Median Household income in McCord?
Median Household Income in McCord is $66,080.
What is Income or Wage Gap in McCord?
Income or Wage Gap in McCord is 66.9%.
Women in McCord earn 33.1 cents for every dollar earned by a man.
What is Family Income Deficit in McCord?
Family Income Deficit in McCord is $11,550.
Families that are below poverty line in McCord earn $11,550 less on average than the poverty threshold level.
What is Inequality or Gini Index in McCord?
Inequality or Gini Index in McCord is 0.44.
How Large is the Labor Force in McCord?
There are 747 People in the Labor Forcein in McCord.
What is the Percentage of People in the Labor Force in McCord?
56.3% of People are in the Labor Force in McCord.
What is the Unemployment Rate in McCord?
Unemployment Rate in McCord is 9.8%.