Wyandotte, OK
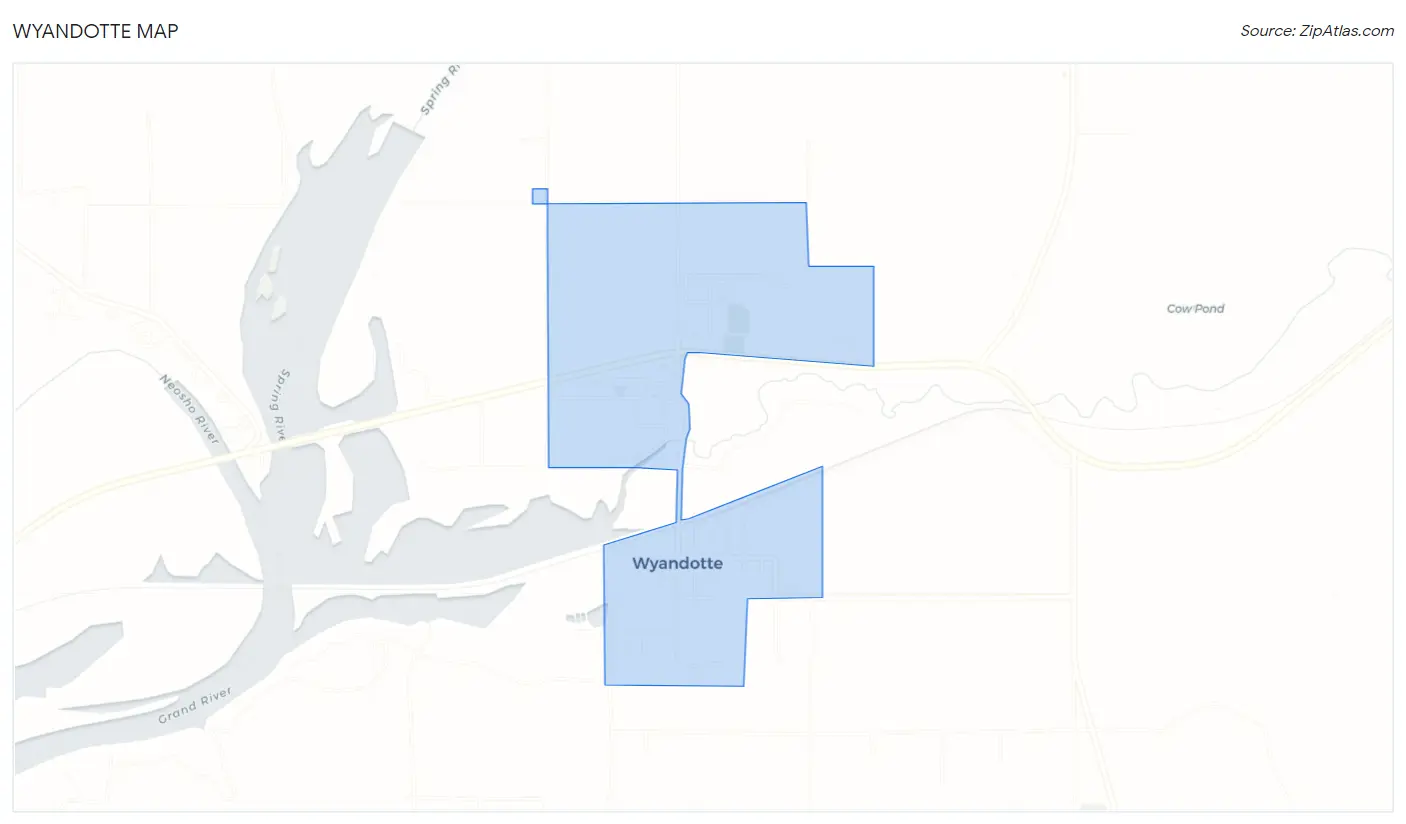
Wyandotte Map
Wyandotte Overview
506
TOTAL POPULATION
264
MALE POPULATION
242
FEMALE POPULATION
109.09
MALES / 100 FEMALES
91.67
FEMALES / 100 MALES
30.7
MEDIAN AGE
3.1
AVG FAMILY SIZE
2.5
AVG HOUSEHOLD SIZE
$17,896
PER CAPITA INCOME
$39,479
AVG FAMILY INCOME
$37,917
AVG HOUSEHOLD INCOME
22.4%
WAGE / INCOME GAP [ % ]
77.6¢/ $1
WAGE / INCOME GAP [ $ ]
$8,869
FAMILY INCOME DEFICIT
0.42
INEQUALITY / GINI INDEX
213
LABOR FORCE [ PEOPLE ]
58.8%
PERCENT IN LABOR FORCE
8.9%
UNEMPLOYMENT RATE
Wyandotte Zip Codes
Wyandotte Area Codes
Race in Wyandotte
The most populous races in Wyandotte are White / Caucasian (265 | 52.4%), Native / Alaskan (144 | 28.5%), and Hispanic or Latino (64 | 12.7%).
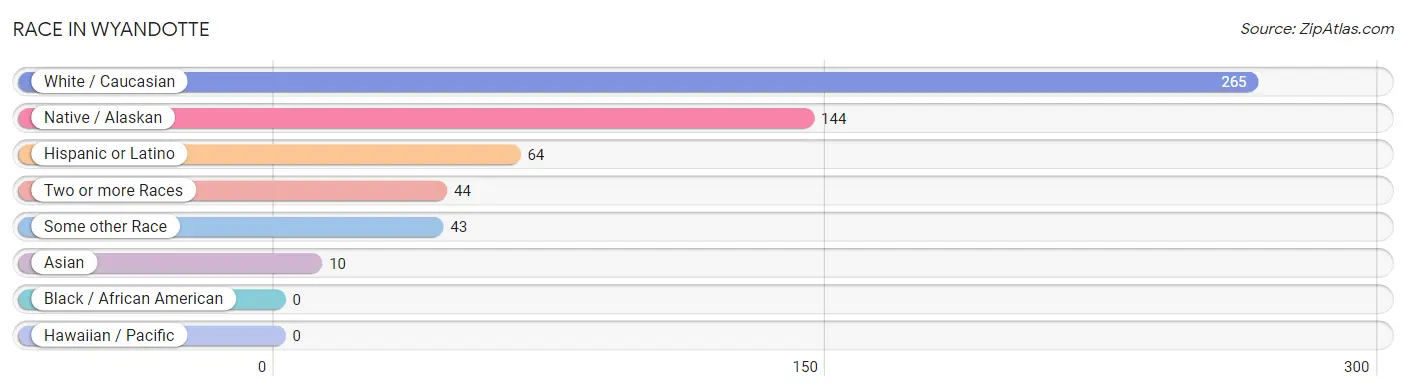
| Race | # Population | % Population |
| Asian | 10 | 2.0% |
| Black / African American | 0 | 0.0% |
| Hawaiian / Pacific | 0 | 0.0% |
| Hispanic or Latino | 64 | 12.7% |
| Native / Alaskan | 144 | 28.5% |
| White / Caucasian | 265 | 52.4% |
| Two or more Races | 44 | 8.7% |
| Some other Race | 43 | 8.5% |
| Total | 506 | 100.0% |
Ancestry in Wyandotte
The most populous ancestries reported in Wyandotte are Iroquois (98 | 19.4%), Mexican (56 | 11.1%), German (54 | 10.7%), Cherokee (47 | 9.3%), and English (41 | 8.1%), together accounting for 58.5% of all Wyandotte residents.
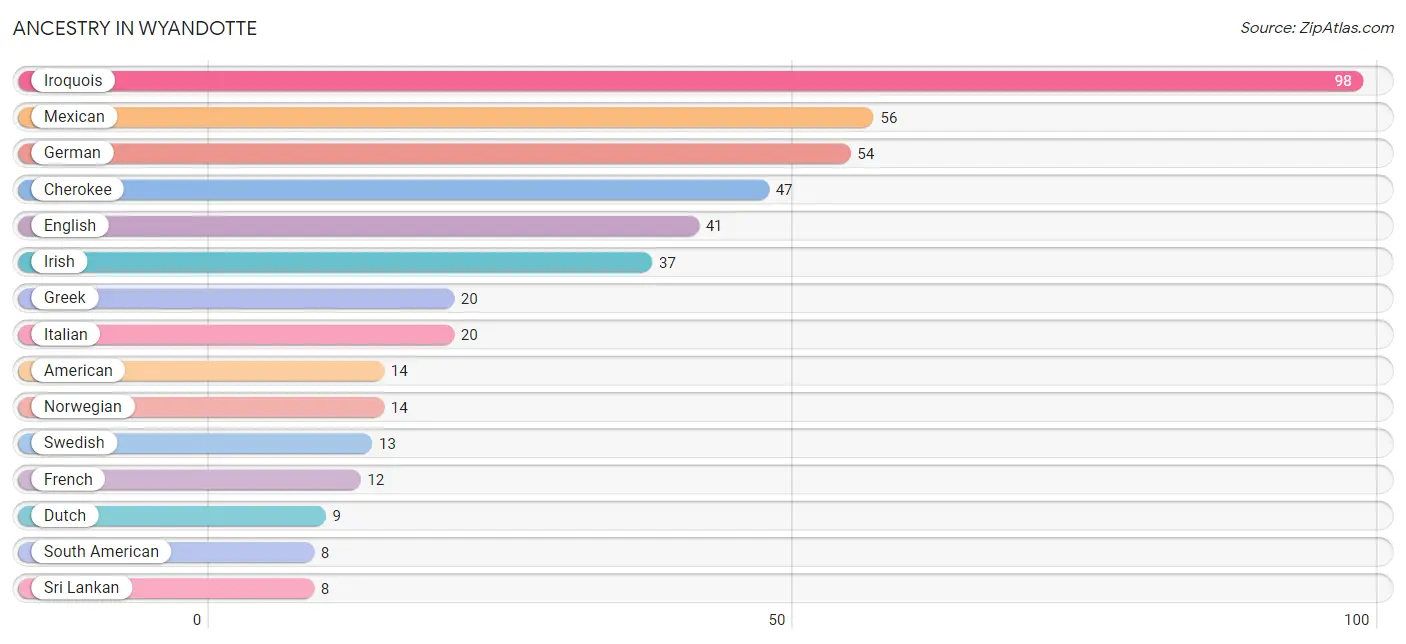
| Ancestry | # Population | % Population |
| American | 14 | 2.8% |
| British | 5 | 1.0% |
| Cherokee | 47 | 9.3% |
| Choctaw | 2 | 0.4% |
| Creek | 3 | 0.6% |
| Dutch | 9 | 1.8% |
| Dutch West Indian | 2 | 0.4% |
| English | 41 | 8.1% |
| European | 6 | 1.2% |
| French | 12 | 2.4% |
| German | 54 | 10.7% |
| Greek | 20 | 4.0% |
| Irish | 37 | 7.3% |
| Iroquois | 98 | 19.4% |
| Italian | 20 | 4.0% |
| Korean | 1 | 0.2% |
| Mexican | 56 | 11.1% |
| Norwegian | 14 | 2.8% |
| Pakistani | 3 | 0.6% |
| Polish | 2 | 0.4% |
| Potawatomi | 5 | 1.0% |
| Scottish | 6 | 1.2% |
| South American | 8 | 1.6% |
| Sri Lankan | 8 | 1.6% |
| Swedish | 13 | 2.6% | View All 25 Rows |
Immigrants in Wyandotte
The most numerous immigrant groups reported in Wyandotte came from Central America (15 | 3.0%), Latin America (15 | 3.0%), Mexico (15 | 3.0%), Asia (6 | 1.2%), and South Eastern Asia (6 | 1.2%), together accounting for 11.3% of all Wyandotte residents.
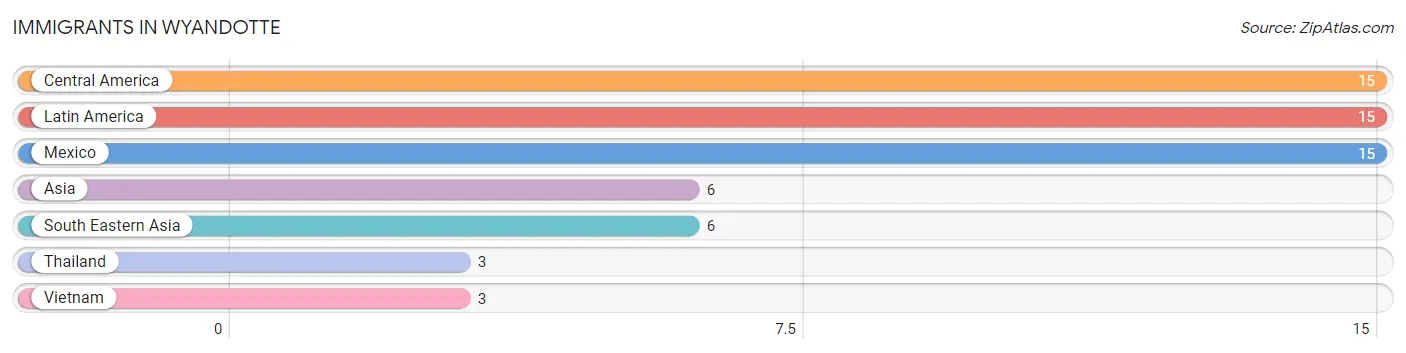
| Immigration Origin | # Population | % Population |
| Asia | 6 | 1.2% |
| Central America | 15 | 3.0% |
| Latin America | 15 | 3.0% |
| Mexico | 15 | 3.0% |
| South Eastern Asia | 6 | 1.2% |
| Thailand | 3 | 0.6% |
| Vietnam | 3 | 0.6% | View All 7 Rows |
Sex and Age in Wyandotte
Sex and Age in Wyandotte
The most populous age groups in Wyandotte are 10 to 14 Years (32 | 12.1%) for men and 15 to 19 Years (26 | 10.7%) for women.
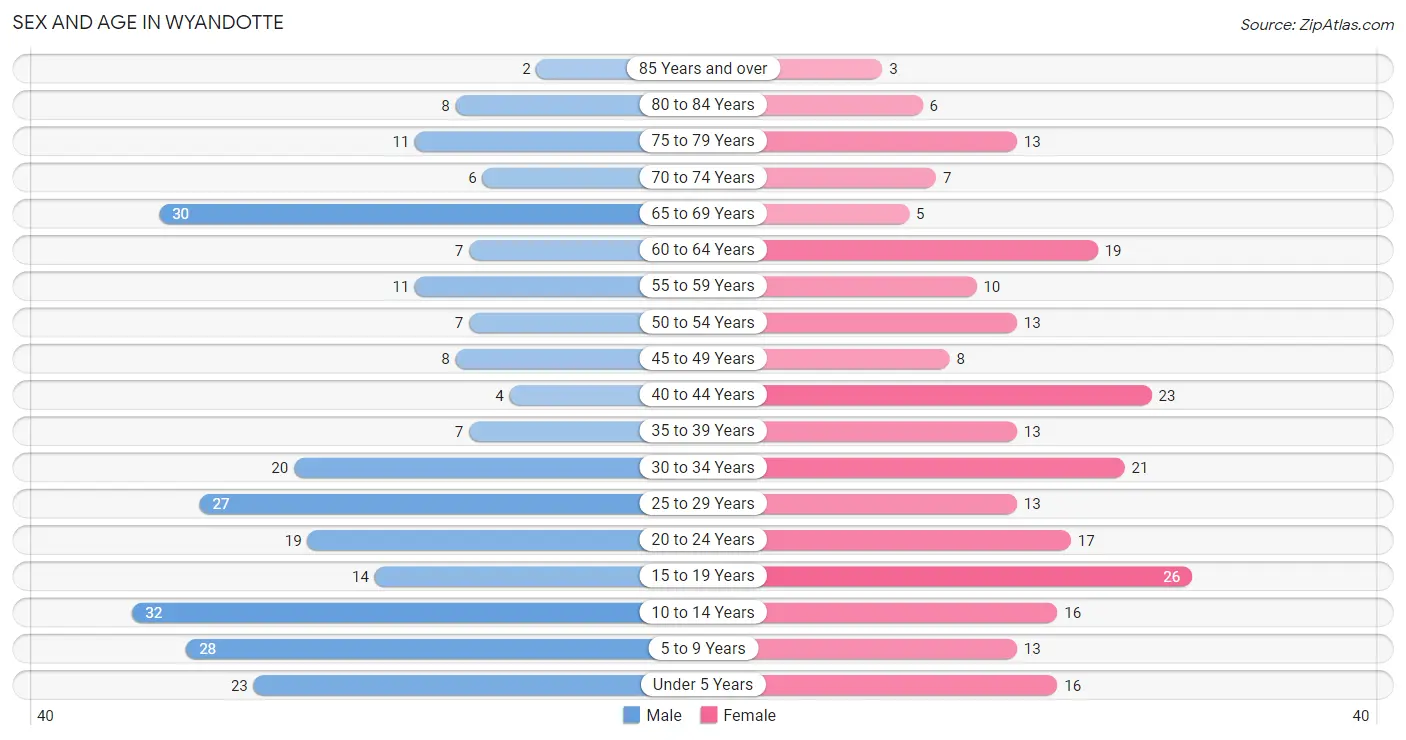
| Age Bracket | Male | Female |
| Under 5 Years | 23 (8.7%) | 16 (6.6%) |
| 5 to 9 Years | 28 (10.6%) | 13 (5.4%) |
| 10 to 14 Years | 32 (12.1%) | 16 (6.6%) |
| 15 to 19 Years | 14 (5.3%) | 26 (10.7%) |
| 20 to 24 Years | 19 (7.2%) | 17 (7.0%) |
| 25 to 29 Years | 27 (10.2%) | 13 (5.4%) |
| 30 to 34 Years | 20 (7.6%) | 21 (8.7%) |
| 35 to 39 Years | 7 (2.6%) | 13 (5.4%) |
| 40 to 44 Years | 4 (1.5%) | 23 (9.5%) |
| 45 to 49 Years | 8 (3.0%) | 8 (3.3%) |
| 50 to 54 Years | 7 (2.6%) | 13 (5.4%) |
| 55 to 59 Years | 11 (4.2%) | 10 (4.1%) |
| 60 to 64 Years | 7 (2.6%) | 19 (7.9%) |
| 65 to 69 Years | 30 (11.4%) | 5 (2.1%) |
| 70 to 74 Years | 6 (2.3%) | 7 (2.9%) |
| 75 to 79 Years | 11 (4.2%) | 13 (5.4%) |
| 80 to 84 Years | 8 (3.0%) | 6 (2.5%) |
| 85 Years and over | 2 (0.8%) | 3 (1.2%) |
| Total | 264 (100.0%) | 242 (100.0%) |
Families and Households in Wyandotte
Median Family Size in Wyandotte
The median family size in Wyandotte is 3.08 persons per family, with single male/father families (6 | 4.8%) accounting for the largest median family size of 3.17 persons per family. On the other hand, single female/mother families (33 | 26.4%) represent the smallest median family size with 2.94 persons per family.
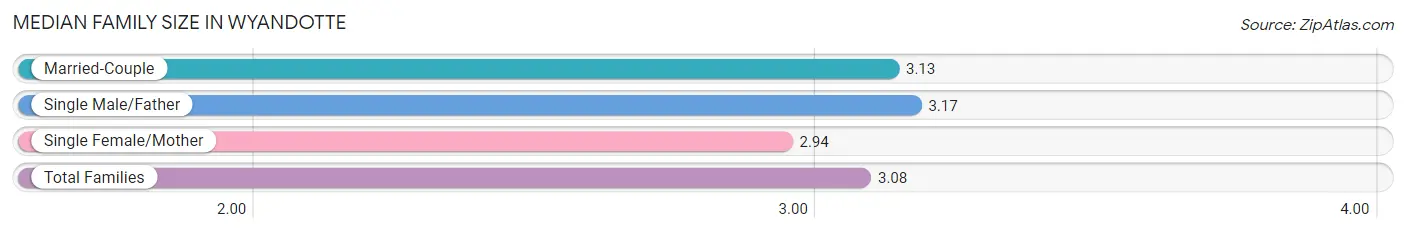
| Family Type | # Families | Family Size |
| Married-Couple | 86 (68.8%) | 3.13 |
| Single Male/Father | 6 (4.8%) | 3.17 |
| Single Female/Mother | 33 (26.4%) | 2.94 |
| Total Families | 125 (100.0%) | 3.08 |
Median Household Size in Wyandotte
The median household size in Wyandotte is 2.47 persons per household, with single male/father households (6 | 2.9%) accounting for the largest median household size of 3.67 persons per household. non-family households (80 | 39.0%) represent the smallest median household size with 1.18 persons per household.
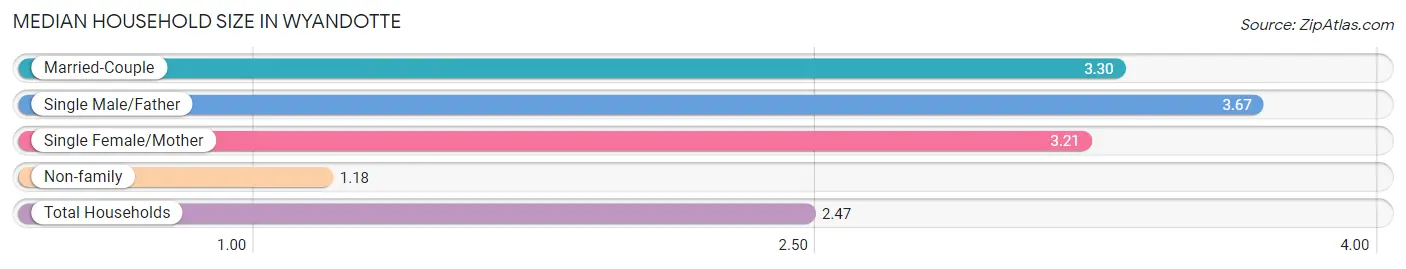
| Household Type | # Households | Household Size |
| Married-Couple | 86 (41.9%) | 3.30 |
| Single Male/Father | 6 (2.9%) | 3.67 |
| Single Female/Mother | 33 (16.1%) | 3.21 |
| Non-family | 80 (39.0%) | 1.18 |
| Total Households | 205 (100.0%) | 2.47 |
Household Size by Marriage Status in Wyandotte
Out of a total of 205 households in Wyandotte, 125 (61.0%) are family households, while 80 (39.0%) are nonfamily households. The most numerous type of family households are 2-person households, comprising 41, and the most common type of nonfamily households are 1-person households, comprising 65.
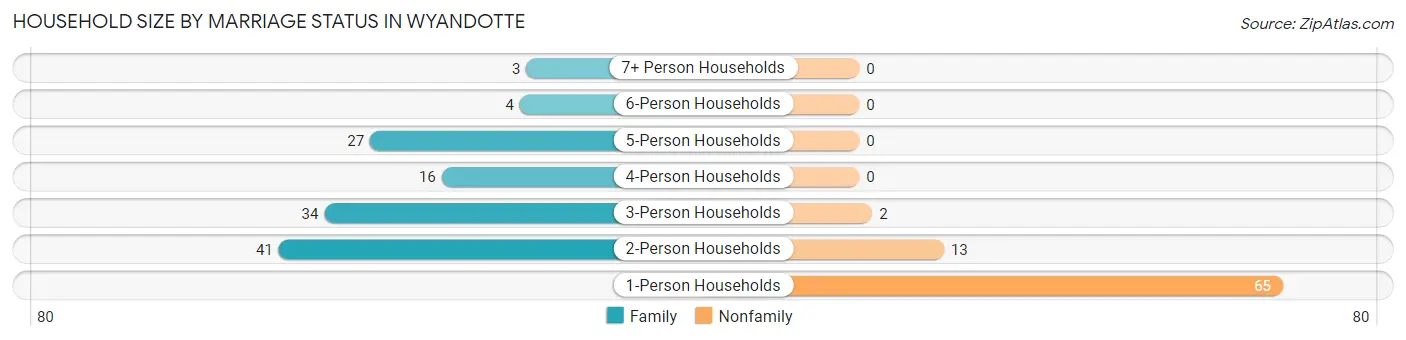
| Household Size | Family Households | Nonfamily Households |
| 1-Person Households | - | 65 (31.7%) |
| 2-Person Households | 41 (20.0%) | 13 (6.3%) |
| 3-Person Households | 34 (16.6%) | 2 (1.0%) |
| 4-Person Households | 16 (7.8%) | 0 (0.0%) |
| 5-Person Households | 27 (13.2%) | 0 (0.0%) |
| 6-Person Households | 4 (1.9%) | 0 (0.0%) |
| 7+ Person Households | 3 (1.5%) | 0 (0.0%) |
| Total | 125 (61.0%) | 80 (39.0%) |
Female Fertility in Wyandotte
Fertility by Age in Wyandotte
Average fertility rate in Wyandotte is 66.0 births per 1,000 women. Women in the age bracket of 20 to 34 years have the highest fertility rate with 157.0 births per 1,000 women. Women in the age bracket of 20 to 34 years acount for 100.0% of all women with births.
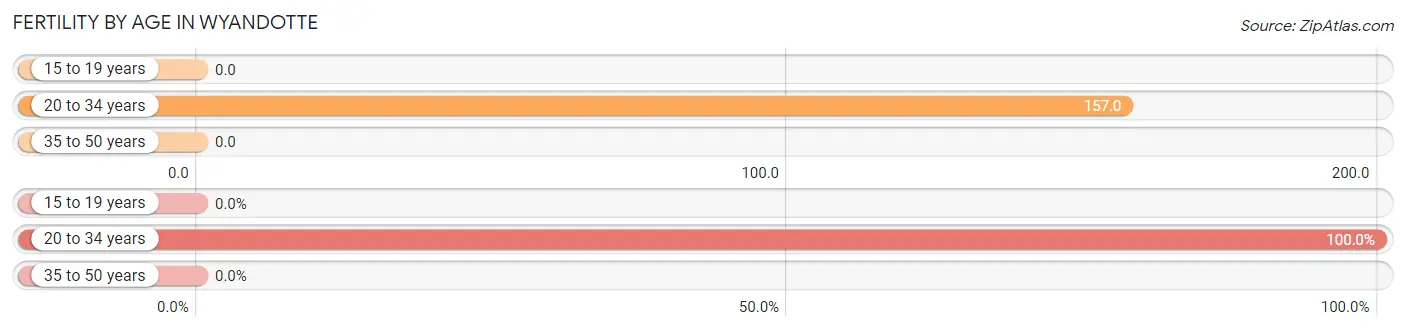
| Age Bracket | Women with Births | Births / 1,000 Women |
| 15 to 19 years | 0 (0.0%) | 0.0 |
| 20 to 34 years | 8 (100.0%) | 157.0 |
| 35 to 50 years | 0 (0.0%) | 0.0 |
| Total | 8 (100.0%) | 66.0 |
Fertility by Age by Marriage Status in Wyandotte
62.5% of women with births (8) in Wyandotte are married. The highest percentage of unmarried women with births falls into 20 to 34 years age bracket with 37.5% of them unmarried at the time of birth, while the lowest percentage of unmarried women with births belong to 20 to 34 years age bracket with 37.5% of them unmarried.
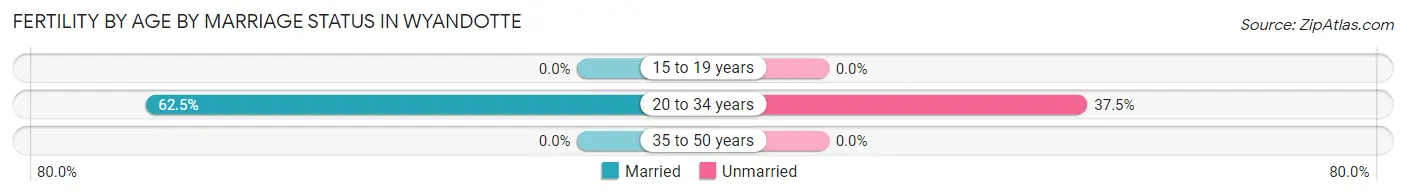
| Age Bracket | Married | Unmarried |
| 15 to 19 years | 0 (0.0%) | 0 (0.0%) |
| 20 to 34 years | 5 (62.5%) | 3 (37.5%) |
| 35 to 50 years | 0 (0.0%) | 0 (0.0%) |
| Total | 5 (62.5%) | 3 (37.5%) |
Fertility by Education in Wyandotte
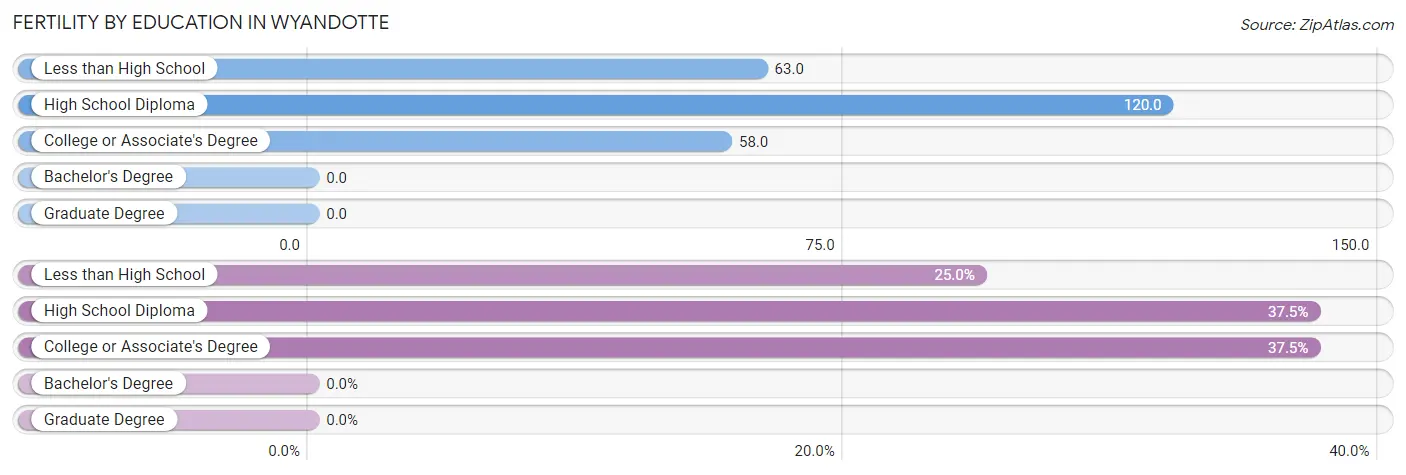
| Educational Attainment | Women with Births | Births / 1,000 Women |
| Less than High School | 2 (25.0%) | 63.0 |
| High School Diploma | 3 (37.5%) | 120.0 |
| College or Associate's Degree | 3 (37.5%) | 58.0 |
| Bachelor's Degree | 0 (0.0%) | 0.0 |
| Graduate Degree | 0 (0.0%) | 0.0 |
| Total | 8 (100.0%) | 66.0 |
Fertility by Education by Marriage Status in Wyandotte
37.5% of women with births in Wyandotte are unmarried. Women with the educational attainment of less than high school are most likely to be married with 100.0% of them married at childbirth, while women with the educational attainment of high school diploma are least likely to be married with 100.0% of them unmarried at childbirth.
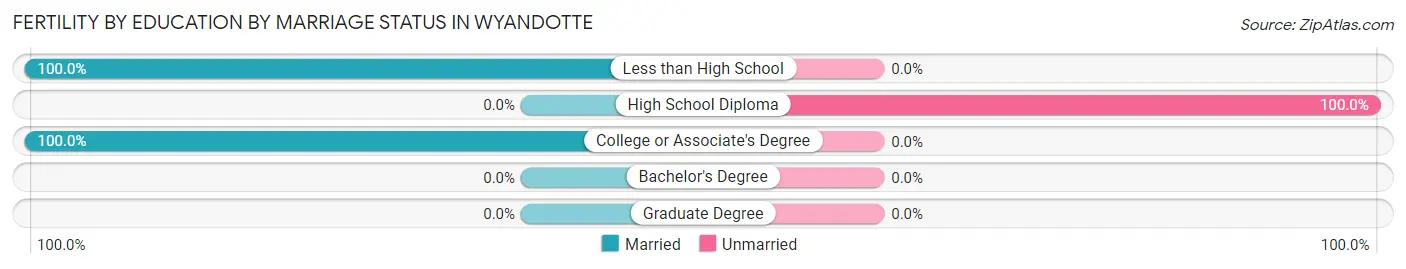
| Educational Attainment | Married | Unmarried |
| Less than High School | 2 (100.0%) | 0 (0.0%) |
| High School Diploma | 0 (0.0%) | 3 (100.0%) |
| College or Associate's Degree | 3 (100.0%) | 0 (0.0%) |
| Bachelor's Degree | 0 (0.0%) | 0 (0.0%) |
| Graduate Degree | 0 (0.0%) | 0 (0.0%) |
| Total | 5 (62.5%) | 3 (37.5%) |
Income in Wyandotte
Income Overview in Wyandotte
Per Capita Income in Wyandotte is $17,896, while median incomes of families and households are $39,479 and $37,917 respectively.
| Characteristic | Number | Measure |
| Per Capita Income | 506 | $17,896 |
| Median Family Income | 125 | $39,479 |
| Mean Family Income | 125 | $57,969 |
| Median Household Income | 205 | $37,917 |
| Mean Household Income | 205 | $48,385 |
| Income Deficit | 125 | $8,869 |
| Wage / Income Gap (%) | 506 | 22.39% |
| Wage / Income Gap ($) | 506 | 77.61¢ per $1 |
| Gini / Inequality Index | 506 | 0.42 |
Earnings by Sex in Wyandotte
Average Earnings in Wyandotte are $27,368, $31,406 for men and $24,375 for women, a difference of 22.4%.
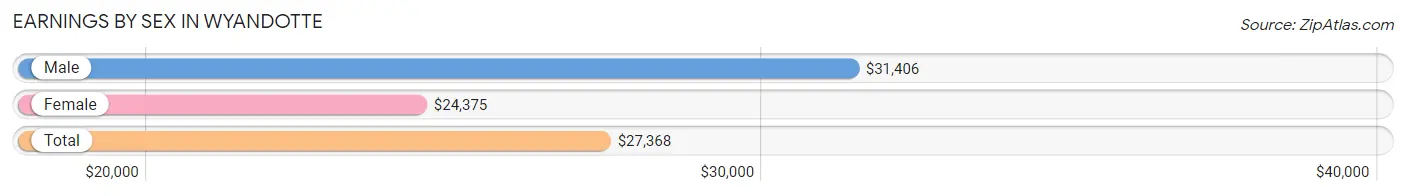
| Sex | Number | Average Earnings |
| Male | 119 (54.6%) | $31,406 |
| Female | 99 (45.4%) | $24,375 |
| Total | 218 (100.0%) | $27,368 |
Earnings by Sex by Income Bracket in Wyandotte
The most common earnings brackets in Wyandotte are $30,000 to $34,999 for men (18 | 15.1%) and $25,000 to $29,999 for women (20 | 20.2%).
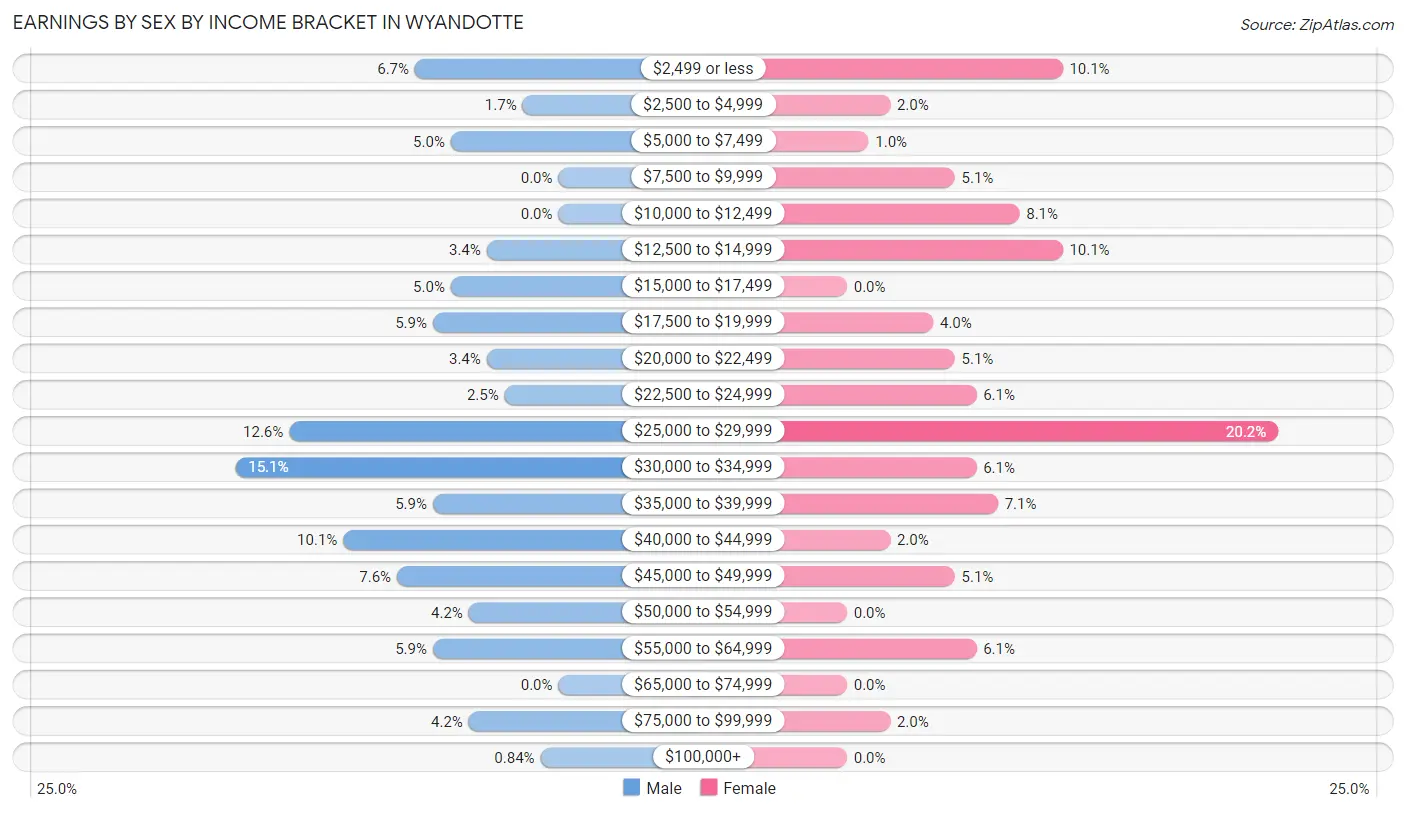
| Income | Male | Female |
| $2,499 or less | 8 (6.7%) | 10 (10.1%) |
| $2,500 to $4,999 | 2 (1.7%) | 2 (2.0%) |
| $5,000 to $7,499 | 6 (5.0%) | 1 (1.0%) |
| $7,500 to $9,999 | 0 (0.0%) | 5 (5.1%) |
| $10,000 to $12,499 | 0 (0.0%) | 8 (8.1%) |
| $12,500 to $14,999 | 4 (3.4%) | 10 (10.1%) |
| $15,000 to $17,499 | 6 (5.0%) | 0 (0.0%) |
| $17,500 to $19,999 | 7 (5.9%) | 4 (4.0%) |
| $20,000 to $22,499 | 4 (3.4%) | 5 (5.1%) |
| $22,500 to $24,999 | 3 (2.5%) | 6 (6.1%) |
| $25,000 to $29,999 | 15 (12.6%) | 20 (20.2%) |
| $30,000 to $34,999 | 18 (15.1%) | 6 (6.1%) |
| $35,000 to $39,999 | 7 (5.9%) | 7 (7.1%) |
| $40,000 to $44,999 | 12 (10.1%) | 2 (2.0%) |
| $45,000 to $49,999 | 9 (7.6%) | 5 (5.1%) |
| $50,000 to $54,999 | 5 (4.2%) | 0 (0.0%) |
| $55,000 to $64,999 | 7 (5.9%) | 6 (6.1%) |
| $65,000 to $74,999 | 0 (0.0%) | 0 (0.0%) |
| $75,000 to $99,999 | 5 (4.2%) | 2 (2.0%) |
| $100,000+ | 1 (0.8%) | 0 (0.0%) |
| Total | 119 (100.0%) | 99 (100.0%) |
Earnings by Sex by Educational Attainment in Wyandotte
Average earnings in Wyandotte are $33,214 for men and $25,673 for women, a difference of 22.7%. Men with an educational attainment of bachelor's degree enjoy the highest average annual earnings of $41,250, while those with high school diploma education earn the least with $30,000. Women with an educational attainment of college or associate's degree earn the most with the average annual earnings of $25,625, while those with high school diploma education have the smallest earnings of $25,313.
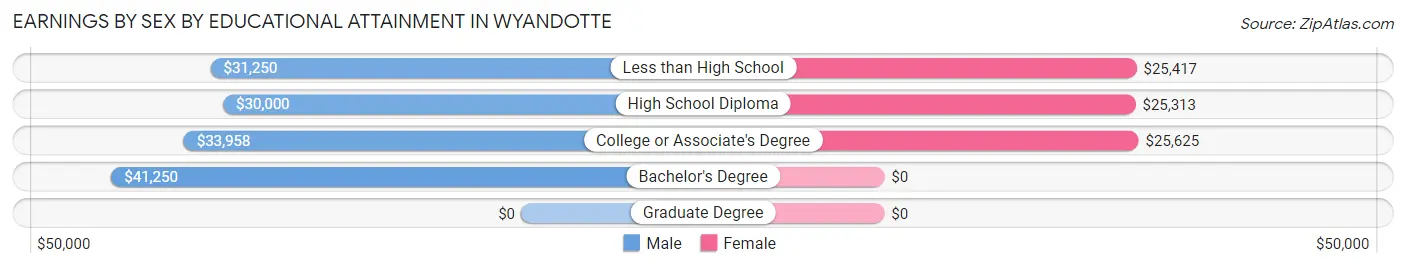
| Educational Attainment | Male Income | Female Income |
| Less than High School | $31,250 | $25,417 |
| High School Diploma | $30,000 | $25,313 |
| College or Associate's Degree | $33,958 | $25,625 |
| Bachelor's Degree | $41,250 | $0 |
| Graduate Degree | - | - |
| Total | $33,214 | $25,673 |
Family Income in Wyandotte
Family Income Brackets in Wyandotte
According to the Wyandotte family income data, there are 27 families falling into the $35,000 to $49,999 income range, which is the most common income bracket and makes up 21.6% of all families.
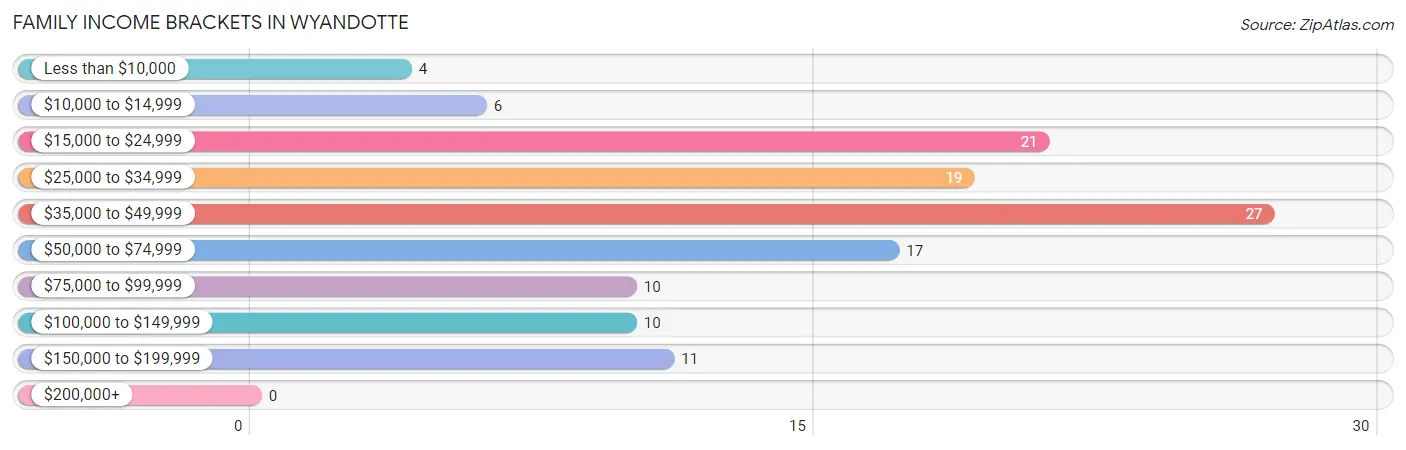
| Income Bracket | # Families | % Families |
| Less than $10,000 | 4 | 3.2% |
| $10,000 to $14,999 | 6 | 4.8% |
| $15,000 to $24,999 | 21 | 16.8% |
| $25,000 to $34,999 | 19 | 15.2% |
| $35,000 to $49,999 | 27 | 21.6% |
| $50,000 to $74,999 | 17 | 13.6% |
| $75,000 to $99,999 | 10 | 8.0% |
| $100,000 to $149,999 | 10 | 8.0% |
| $150,000 to $199,999 | 11 | 8.8% |
| $200,000+ | 0 | 0.0% |
Family Income by Famaliy Size in Wyandotte
3-person families (27 | 21.6%) account for the highest median family income in Wyandotte with $38,906 per family, while 2-person families (49 | 39.2%) have the highest median income of $17,812 per family member.
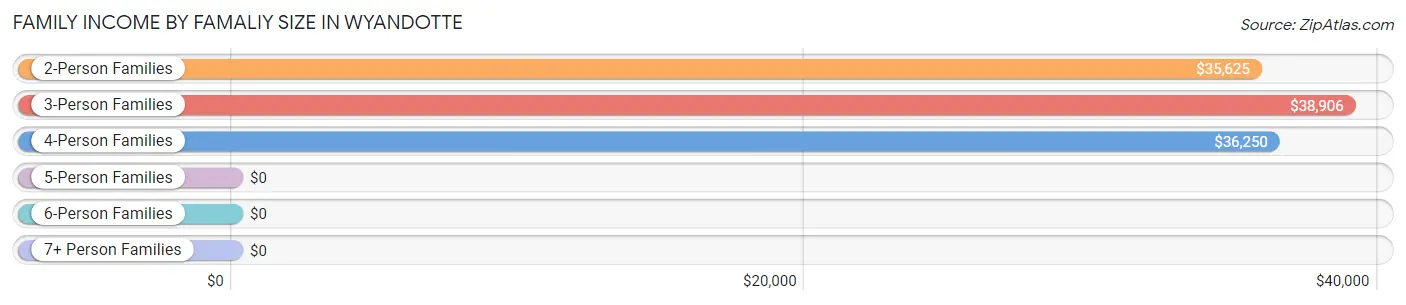
| Income Bracket | # Families | Median Income |
| 2-Person Families | 49 (39.2%) | $35,625 |
| 3-Person Families | 27 (21.6%) | $38,906 |
| 4-Person Families | 19 (15.2%) | $36,250 |
| 5-Person Families | 25 (20.0%) | $0 |
| 6-Person Families | 5 (4.0%) | $0 |
| 7+ Person Families | 0 (0.0%) | $0 |
| Total | 125 (100.0%) | $39,479 |
Family Income by Number of Earners in Wyandotte
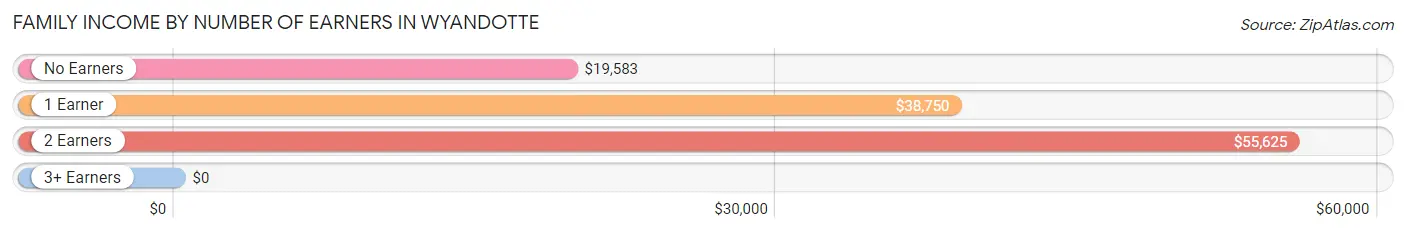
| Number of Earners | # Families | Median Income |
| No Earners | 18 (14.4%) | $19,583 |
| 1 Earner | 50 (40.0%) | $38,750 |
| 2 Earners | 45 (36.0%) | $55,625 |
| 3+ Earners | 12 (9.6%) | $0 |
| Total | 125 (100.0%) | $39,479 |
Household Income in Wyandotte
Household Income Brackets in Wyandotte
With 50 households falling in the category, the $15,000 to $24,999 income range is the most frequent in Wyandotte, accounting for 24.4% of all households.
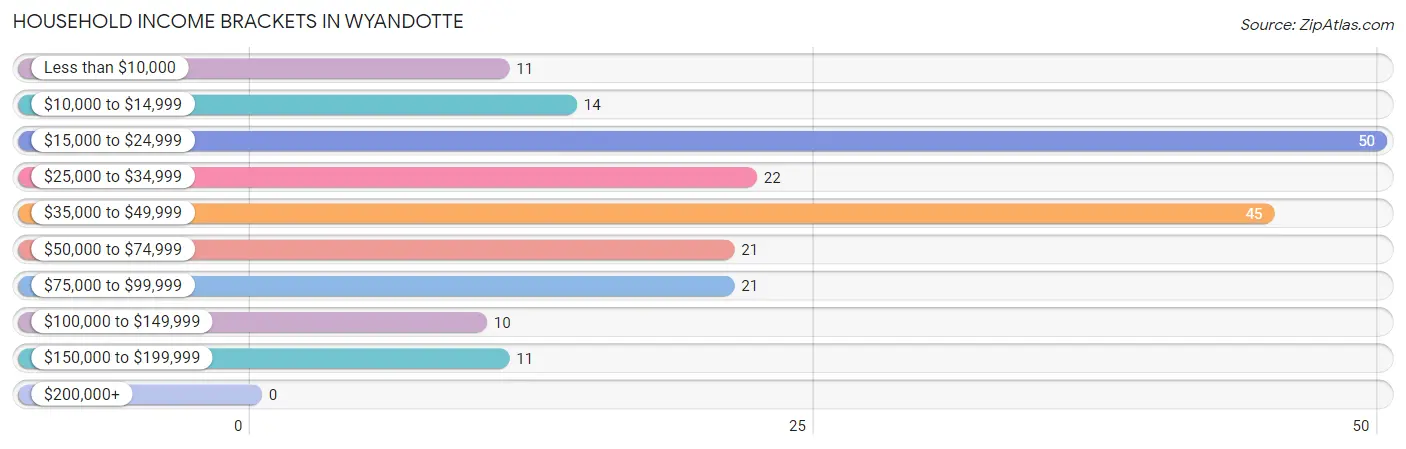
| Income Bracket | # Households | % Households |
| Less than $10,000 | 11 | 5.4% |
| $10,000 to $14,999 | 14 | 6.8% |
| $15,000 to $24,999 | 50 | 24.4% |
| $25,000 to $34,999 | 22 | 10.7% |
| $35,000 to $49,999 | 45 | 22.0% |
| $50,000 to $74,999 | 21 | 10.2% |
| $75,000 to $99,999 | 21 | 10.2% |
| $100,000 to $149,999 | 10 | 4.9% |
| $150,000 to $199,999 | 11 | 5.4% |
| $200,000+ | 0 | 0.0% |
Household Income by Householder Age in Wyandotte
The median household income in Wyandotte is $37,917, with the highest median household income of $45,417 found in the 25 to 44 years age bracket for the primary householder. A total of 63 households (30.7%) fall into this category. Meanwhile, the 65+ years age bracket for the primary householder has the lowest median household income of $22,212, with 75 households (36.6%) in this group.
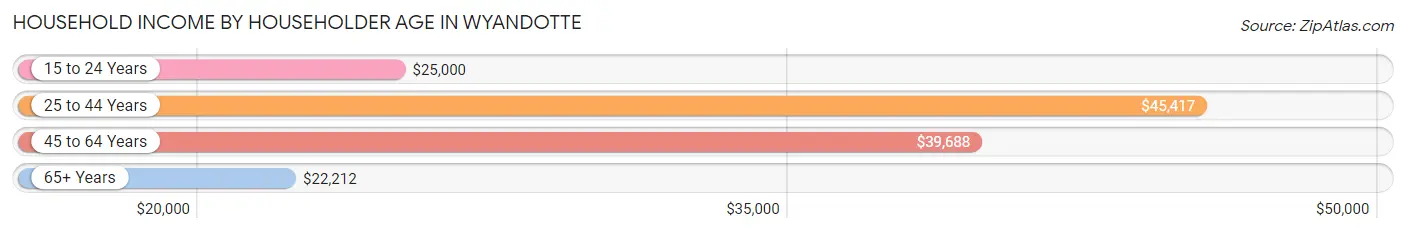
| Income Bracket | # Households | Median Income |
| 15 to 24 Years | 14 (6.8%) | $25,000 |
| 25 to 44 Years | 63 (30.7%) | $45,417 |
| 45 to 64 Years | 53 (25.9%) | $39,688 |
| 65+ Years | 75 (36.6%) | $22,212 |
| Total | 205 (100.0%) | $37,917 |
Poverty in Wyandotte
Income Below Poverty by Sex and Age in Wyandotte
With 21.2% poverty level for males and 33.3% for females among the residents of Wyandotte, under 5 year old males and 16 and 17 year old females are the most vulnerable to poverty, with 13 males (56.5%) and 6 females (66.7%) in their respective age groups living below the poverty level.
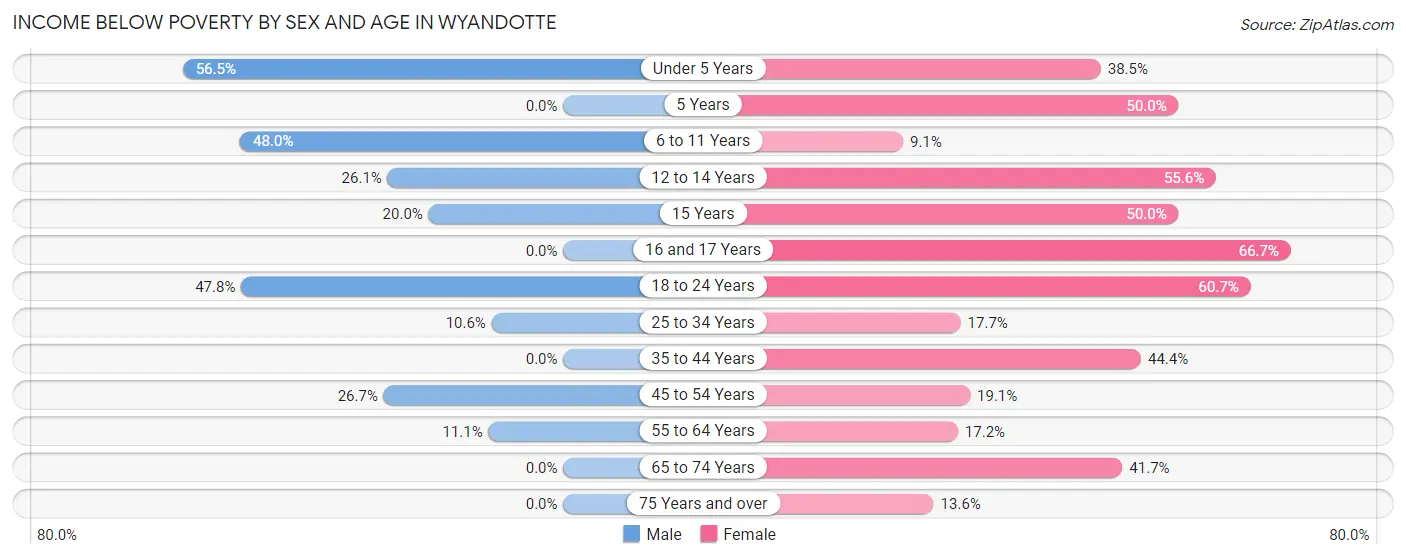
| Age Bracket | Male | Female |
| Under 5 Years | 13 (56.5%) | 5 (38.5%) |
| 5 Years | 0 (0.0%) | 2 (50.0%) |
| 6 to 11 Years | 12 (48.0%) | 1 (9.1%) |
| 12 to 14 Years | 6 (26.1%) | 5 (55.6%) |
| 15 Years | 2 (20.0%) | 3 (50.0%) |
| 16 and 17 Years | 0 (0.0%) | 6 (66.7%) |
| 18 to 24 Years | 11 (47.8%) | 17 (60.7%) |
| 25 to 34 Years | 5 (10.6%) | 6 (17.6%) |
| 35 to 44 Years | 0 (0.0%) | 16 (44.4%) |
| 45 to 54 Years | 4 (26.7%) | 4 (19.1%) |
| 55 to 64 Years | 2 (11.1%) | 5 (17.2%) |
| 65 to 74 Years | 0 (0.0%) | 5 (41.7%) |
| 75 Years and over | 0 (0.0%) | 3 (13.6%) |
| Total | 55 (21.2%) | 78 (33.3%) |
Income Above Poverty by Sex and Age in Wyandotte
According to the poverty statistics in Wyandotte, males aged 5 years and females aged 6 to 11 years are the age groups that are most secure financially, with 100.0% of males and 90.9% of females in these age groups living above the poverty line.
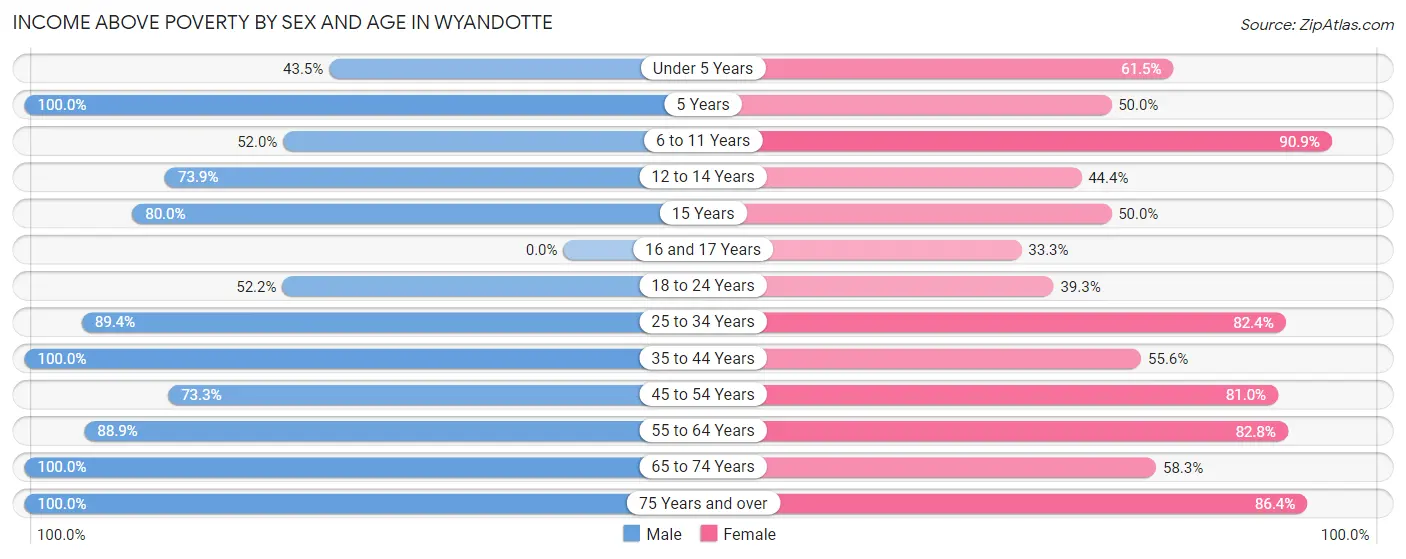
| Age Bracket | Male | Female |
| Under 5 Years | 10 (43.5%) | 8 (61.5%) |
| 5 Years | 7 (100.0%) | 2 (50.0%) |
| 6 to 11 Years | 13 (52.0%) | 10 (90.9%) |
| 12 to 14 Years | 17 (73.9%) | 4 (44.4%) |
| 15 Years | 8 (80.0%) | 3 (50.0%) |
| 16 and 17 Years | 0 (0.0%) | 3 (33.3%) |
| 18 to 24 Years | 12 (52.2%) | 11 (39.3%) |
| 25 to 34 Years | 42 (89.4%) | 28 (82.4%) |
| 35 to 44 Years | 11 (100.0%) | 20 (55.6%) |
| 45 to 54 Years | 11 (73.3%) | 17 (80.9%) |
| 55 to 64 Years | 16 (88.9%) | 24 (82.8%) |
| 65 to 74 Years | 36 (100.0%) | 7 (58.3%) |
| 75 Years and over | 21 (100.0%) | 19 (86.4%) |
| Total | 204 (78.8%) | 156 (66.7%) |
Income Below Poverty Among Married-Couple Families in Wyandotte
The poverty statistics for married-couple families in Wyandotte show that 10.5% or 9 of the total 86 families live below the poverty line. Families with 3 or 4 children have the highest poverty rate of 62.5%, comprising of 5 families. On the other hand, families with no children have the lowest poverty rate of 0.0%, which includes 0 families.
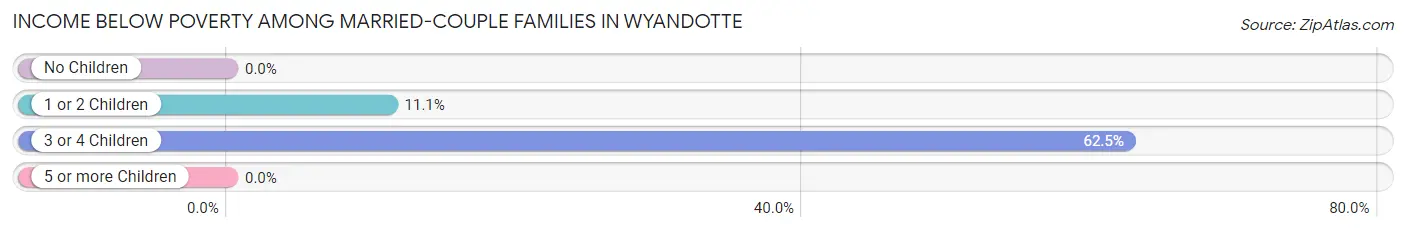
| Children | Above Poverty | Below Poverty |
| No Children | 42 (100.0%) | 0 (0.0%) |
| 1 or 2 Children | 32 (88.9%) | 4 (11.1%) |
| 3 or 4 Children | 3 (37.5%) | 5 (62.5%) |
| 5 or more Children | 0 (0.0%) | 0 (0.0%) |
| Total | 77 (89.5%) | 9 (10.5%) |
Income Below Poverty Among Single-Parent Households in Wyandotte
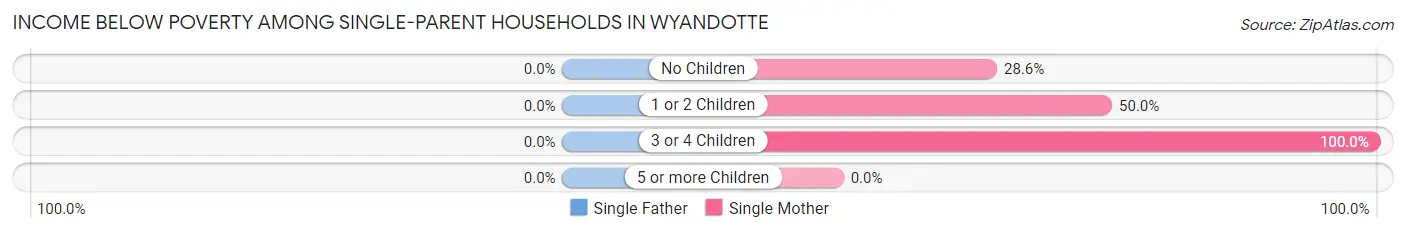
| Children | Single Father | Single Mother |
| No Children | 0 (0.0%) | 2 (28.6%) |
| 1 or 2 Children | 0 (0.0%) | 8 (50.0%) |
| 3 or 4 Children | 0 (0.0%) | 10 (100.0%) |
| 5 or more Children | 0 (0.0%) | 0 (0.0%) |
| Total | 0 (0.0%) | 20 (60.6%) |
Income Below Poverty Among Married-Couple vs Single-Parent Households in Wyandotte
The poverty data for Wyandotte shows that 9 of the married-couple family households (10.5%) and 20 of the single-parent households (51.3%) are living below the poverty level. Within the married-couple family households, those with 3 or 4 children have the highest poverty rate, with 5 households (62.5%) falling below the poverty line. Among the single-parent households, those with 3 or 4 children have the highest poverty rate, with 10 household (83.3%) living below poverty.
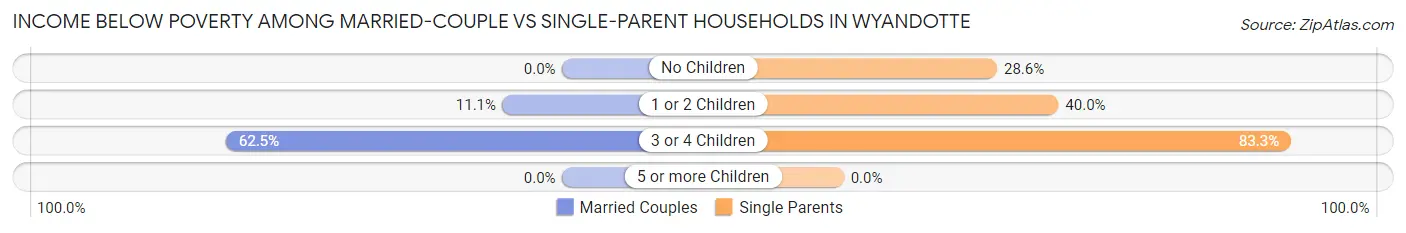
| Children | Married-Couple Families | Single-Parent Households |
| No Children | 0 (0.0%) | 2 (28.6%) |
| 1 or 2 Children | 4 (11.1%) | 8 (40.0%) |
| 3 or 4 Children | 5 (62.5%) | 10 (83.3%) |
| 5 or more Children | 0 (0.0%) | 0 (0.0%) |
| Total | 9 (10.5%) | 20 (51.3%) |
Employment Characteristics in Wyandotte
Employment by Class of Employer in Wyandotte
Among the 189 employed individuals in Wyandotte, private company employees (115 | 60.9%), local government employees (25 | 13.2%), and self-employed (not incorporated) (21 | 11.1%) make up the most common classes of employment.
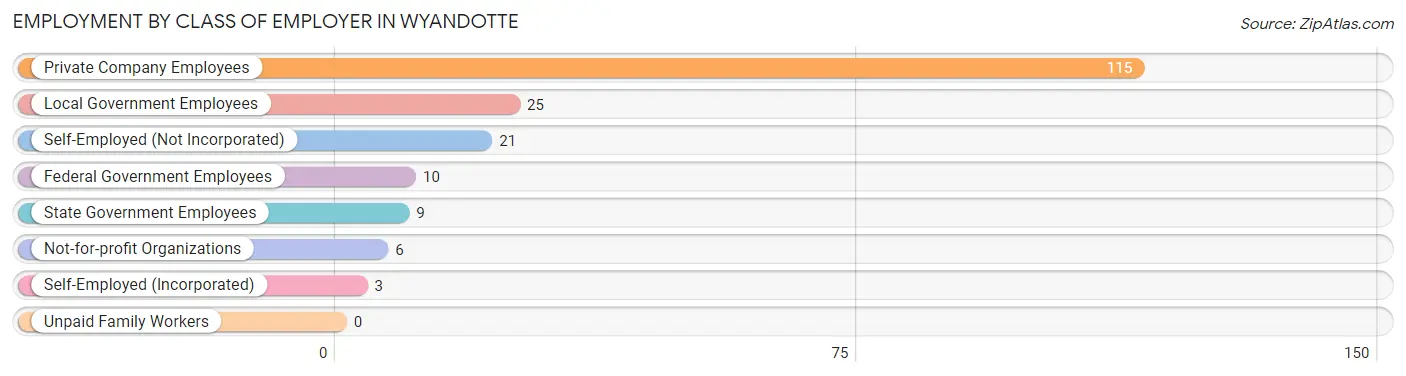
| Employer Class | # Employees | % Employees |
| Private Company Employees | 115 | 60.9% |
| Self-Employed (Incorporated) | 3 | 1.6% |
| Self-Employed (Not Incorporated) | 21 | 11.1% |
| Not-for-profit Organizations | 6 | 3.2% |
| Local Government Employees | 25 | 13.2% |
| State Government Employees | 9 | 4.8% |
| Federal Government Employees | 10 | 5.3% |
| Unpaid Family Workers | 0 | 0.0% |
| Total | 189 | 100.0% |
Employment Status by Age in Wyandotte
According to the labor force statistics for Wyandotte, out of the total population over 16 years of age (362), 58.8% or 213 individuals are in the labor force, with 8.9% or 19 of them unemployed. The age group with the highest labor force participation rate is 30 to 34 years, with 95.1% or 39 individuals in the labor force. Within the labor force, the 30 to 34 years age range has the highest percentage of unemployed individuals, with 30.8% or 12 of them being unemployed.
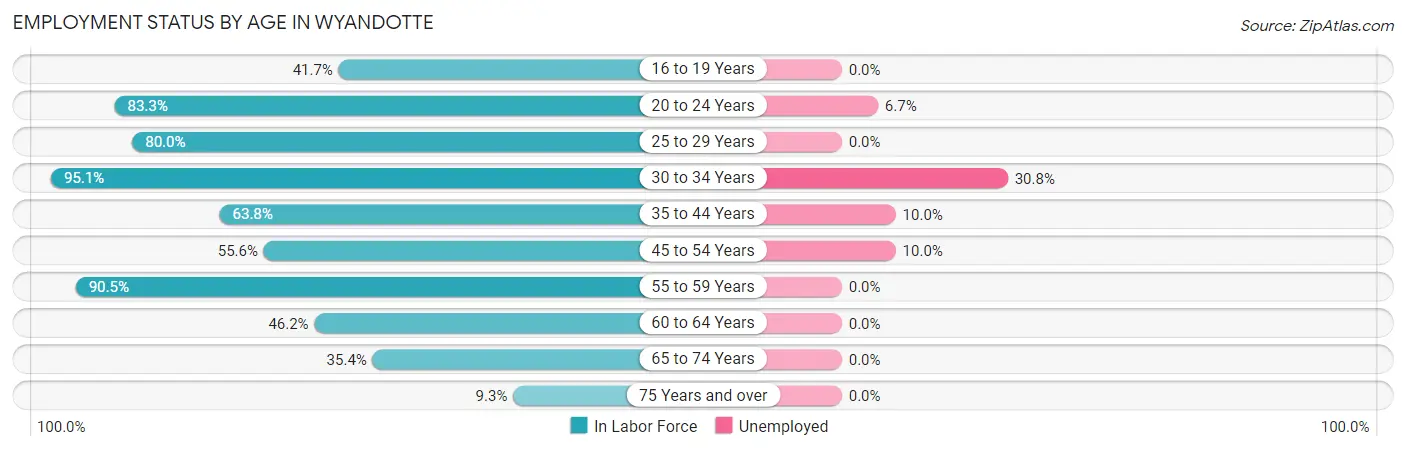
| Age Bracket | In Labor Force | Unemployed |
| 16 to 19 Years | 10 (41.7%) | 0 (0.0%) |
| 20 to 24 Years | 30 (83.3%) | 2 (6.7%) |
| 25 to 29 Years | 32 (80.0%) | 0 (0.0%) |
| 30 to 34 Years | 39 (95.1%) | 12 (30.8%) |
| 35 to 44 Years | 30 (63.8%) | 3 (10.0%) |
| 45 to 54 Years | 20 (55.6%) | 2 (10.0%) |
| 55 to 59 Years | 19 (90.5%) | 0 (0.0%) |
| 60 to 64 Years | 12 (46.2%) | 0 (0.0%) |
| 65 to 74 Years | 17 (35.4%) | 0 (0.0%) |
| 75 Years and over | 4 (9.3%) | 0 (0.0%) |
| Total | 213 (58.8%) | 19 (8.9%) |
Employment Status by Educational Attainment in Wyandotte
According to labor force statistics for Wyandotte, 72.0% of individuals (152) out of the total population between 25 and 64 years of age (211) are in the labor force, with 11.2% or 17 of them being unemployed. The group with the highest labor force participation rate are those with the educational attainment of college / associate degree, with 79.4% or 77 individuals in the labor force. Within the labor force, individuals with less than high school education have the highest percentage of unemployment, with 27.3% or 3 of them being unemployed.
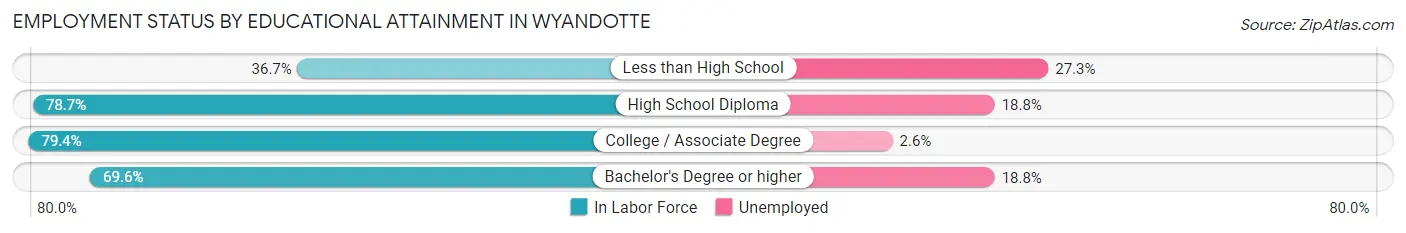
| Educational Attainment | In Labor Force | Unemployed |
| Less than High School | 11 (36.7%) | 8 (27.3%) |
| High School Diploma | 48 (78.7%) | 11 (18.8%) |
| College / Associate Degree | 77 (79.4%) | 3 (2.6%) |
| Bachelor's Degree or higher | 16 (69.6%) | 4 (18.8%) |
| Total | 152 (72.0%) | 24 (11.2%) |
Employment Occupations by Sex in Wyandotte
Management, Business, Science and Arts Occupations
The most common Management, Business, Science and Arts occupations in Wyandotte are Management (22 | 11.3%), Community & Social Service (10 | 5.1%), Education Instruction & Library (9 | 4.6%), Business & Financial (8 | 4.1%), and Health Diagnosing & Treating (8 | 4.1%).
Management, Business, Science and Arts Occupations by Sex
Within the Management, Business, Science and Arts occupations in Wyandotte, the most male-oriented occupations are Computers & Mathematics (100.0%), Education, Arts & Media (100.0%), and Business & Financial (87.5%), while the most female-oriented occupations are Architecture & Engineering (100.0%), Education Instruction & Library (100.0%), and Health Technologists (100.0%).
| Occupation | Male | Female |
| Management | 11 (50.0%) | 11 (50.0%) |
| Business & Financial | 7 (87.5%) | 1 (12.5%) |
| Computers, Engineering & Science | 1 (33.3%) | 2 (66.7%) |
| Computers & Mathematics | 1 (100.0%) | 0 (0.0%) |
| Architecture & Engineering | 0 (0.0%) | 2 (100.0%) |
| Life, Physical & Social Science | 0 (0.0%) | 0 (0.0%) |
| Community & Social Service | 1 (10.0%) | 9 (90.0%) |
| Education, Arts & Media | 1 (100.0%) | 0 (0.0%) |
| Legal Services & Support | 0 (0.0%) | 0 (0.0%) |
| Education Instruction & Library | 0 (0.0%) | 9 (100.0%) |
| Arts, Media & Entertainment | 0 (0.0%) | 0 (0.0%) |
| Health Diagnosing & Treating | 2 (25.0%) | 6 (75.0%) |
| Health Technologists | 0 (0.0%) | 6 (100.0%) |
| Total (Category) | 22 (43.1%) | 29 (56.9%) |
| Total (Overall) | 104 (53.6%) | 90 (46.4%) |
Services Occupations
The most common Services occupations in Wyandotte are Security & Protection (25 | 12.9%), Firefighting & Prevention (18 | 9.3%), Cleaning & Maintenance (12 | 6.2%), Food Preparation & Serving (11 | 5.7%), and Law Enforcement (7 | 3.6%).
Services Occupations by Sex
Within the Services occupations in Wyandotte, the most male-oriented occupations are Law Enforcement (100.0%), Security & Protection (92.0%), and Firefighting & Prevention (88.9%), while the most female-oriented occupations are Healthcare Support (100.0%), Personal Care & Service (100.0%), and Cleaning & Maintenance (58.3%).
| Occupation | Male | Female |
| Healthcare Support | 0 (0.0%) | 4 (100.0%) |
| Security & Protection | 23 (92.0%) | 2 (8.0%) |
| Firefighting & Prevention | 16 (88.9%) | 2 (11.1%) |
| Law Enforcement | 7 (100.0%) | 0 (0.0%) |
| Food Preparation & Serving | 5 (45.5%) | 6 (54.5%) |
| Cleaning & Maintenance | 5 (41.7%) | 7 (58.3%) |
| Personal Care & Service | 0 (0.0%) | 5 (100.0%) |
| Total (Category) | 33 (57.9%) | 24 (42.1%) |
| Total (Overall) | 104 (53.6%) | 90 (46.4%) |
Sales and Office Occupations
The most common Sales and Office occupations in Wyandotte are Office & Administration (23 | 11.9%), and Sales & Related (15 | 7.7%).

Sales and Office Occupations by Sex
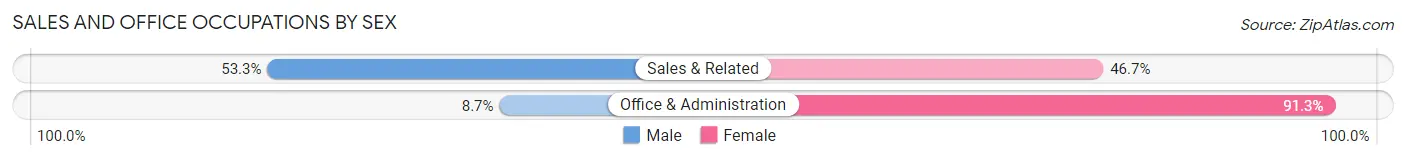
| Occupation | Male | Female |
| Sales & Related | 8 (53.3%) | 7 (46.7%) |
| Office & Administration | 2 (8.7%) | 21 (91.3%) |
| Total (Category) | 10 (26.3%) | 28 (73.7%) |
| Total (Overall) | 104 (53.6%) | 90 (46.4%) |
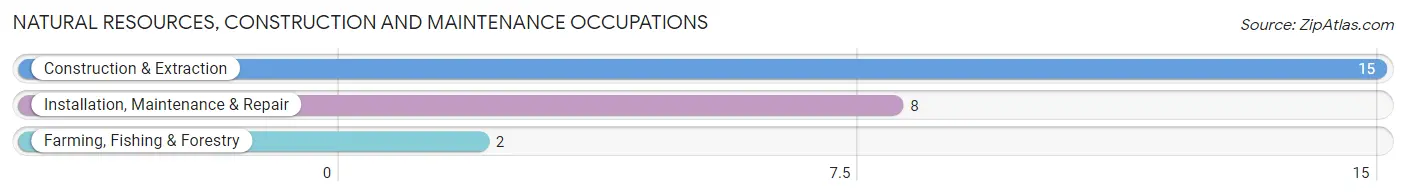
Natural Resources, Construction and Maintenance Occupations
The most common Natural Resources, Construction and Maintenance occupations in Wyandotte are Construction & Extraction (15 | 7.7%), Installation, Maintenance & Repair (8 | 4.1%), and Farming, Fishing & Forestry (2 | 1.0%).
Natural Resources, Construction and Maintenance Occupations by Sex
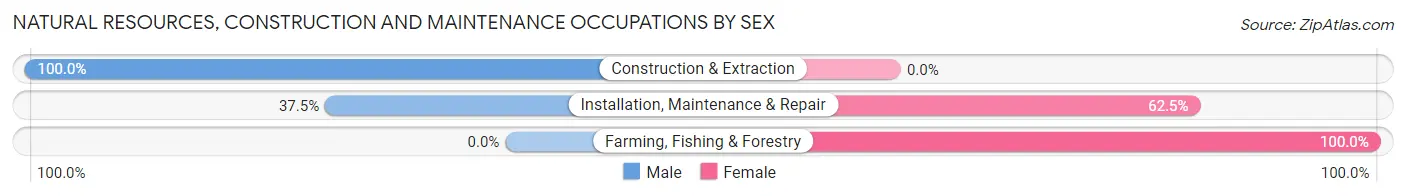
| Occupation | Male | Female |
| Farming, Fishing & Forestry | 0 (0.0%) | 2 (100.0%) |
| Construction & Extraction | 15 (100.0%) | 0 (0.0%) |
| Installation, Maintenance & Repair | 3 (37.5%) | 5 (62.5%) |
| Total (Category) | 18 (72.0%) | 7 (28.0%) |
| Total (Overall) | 104 (53.6%) | 90 (46.4%) |
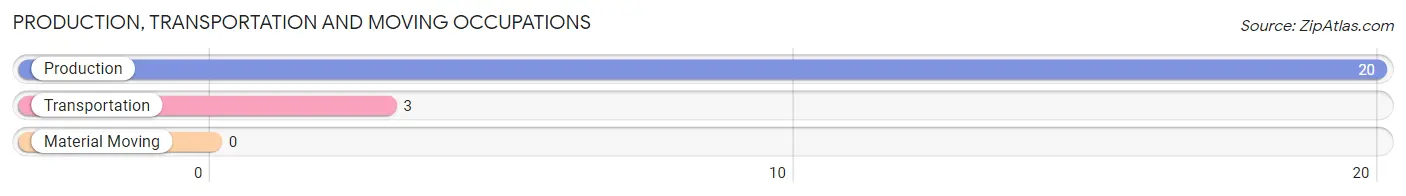
Production, Transportation and Moving Occupations
The most common Production, Transportation and Moving occupations in Wyandotte are Production (20 | 10.3%), and Transportation (3 | 1.5%).
Production, Transportation and Moving Occupations by Sex
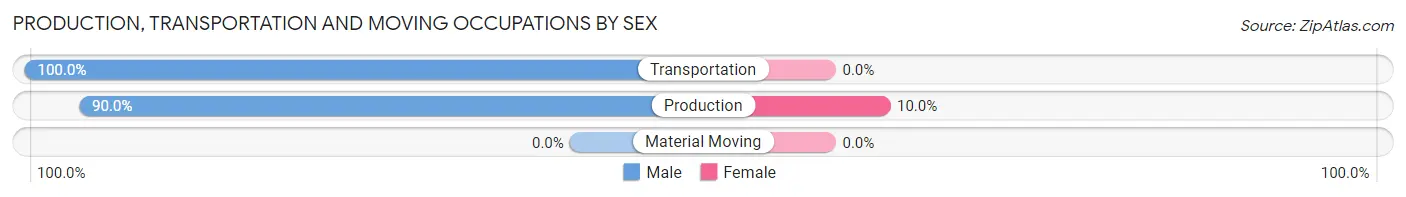
| Occupation | Male | Female |
| Production | 18 (90.0%) | 2 (10.0%) |
| Transportation | 3 (100.0%) | 0 (0.0%) |
| Material Moving | 0 (0.0%) | 0 (0.0%) |
| Total (Category) | 21 (91.3%) | 2 (8.7%) |
| Total (Overall) | 104 (53.6%) | 90 (46.4%) |
Employment Industries by Sex in Wyandotte
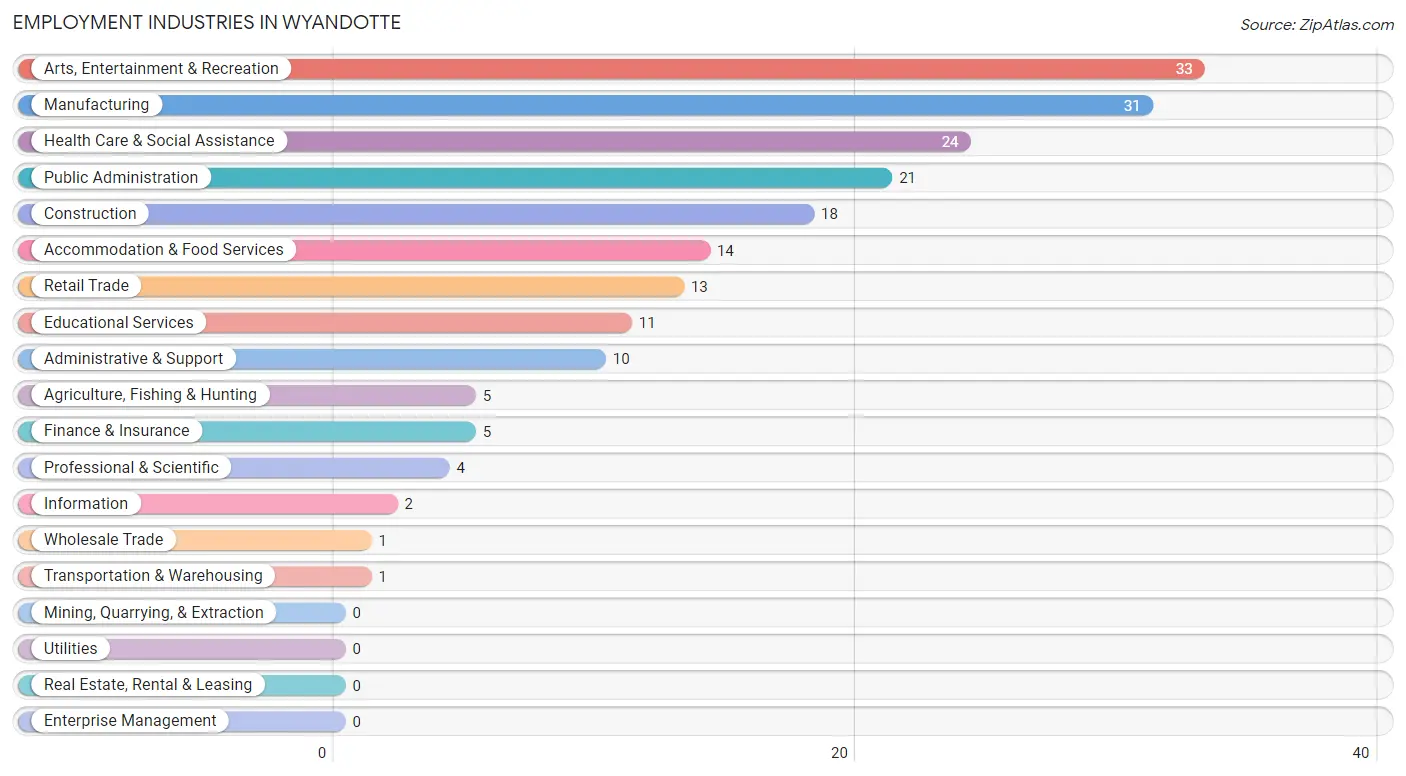
Employment Industries in Wyandotte
The major employment industries in Wyandotte include Arts, Entertainment & Recreation (33 | 17.0%), Manufacturing (31 | 16.0%), Health Care & Social Assistance (24 | 12.4%), Public Administration (21 | 10.8%), and Construction (18 | 9.3%).
Employment Industries by Sex in Wyandotte
The Wyandotte industries that see more men than women are Construction (100.0%), Wholesale Trade (100.0%), and Transportation & Warehousing (100.0%), whereas the industries that tend to have a higher number of women are Educational Services (81.8%), Administrative & Support (80.0%), and Health Care & Social Assistance (75.0%).
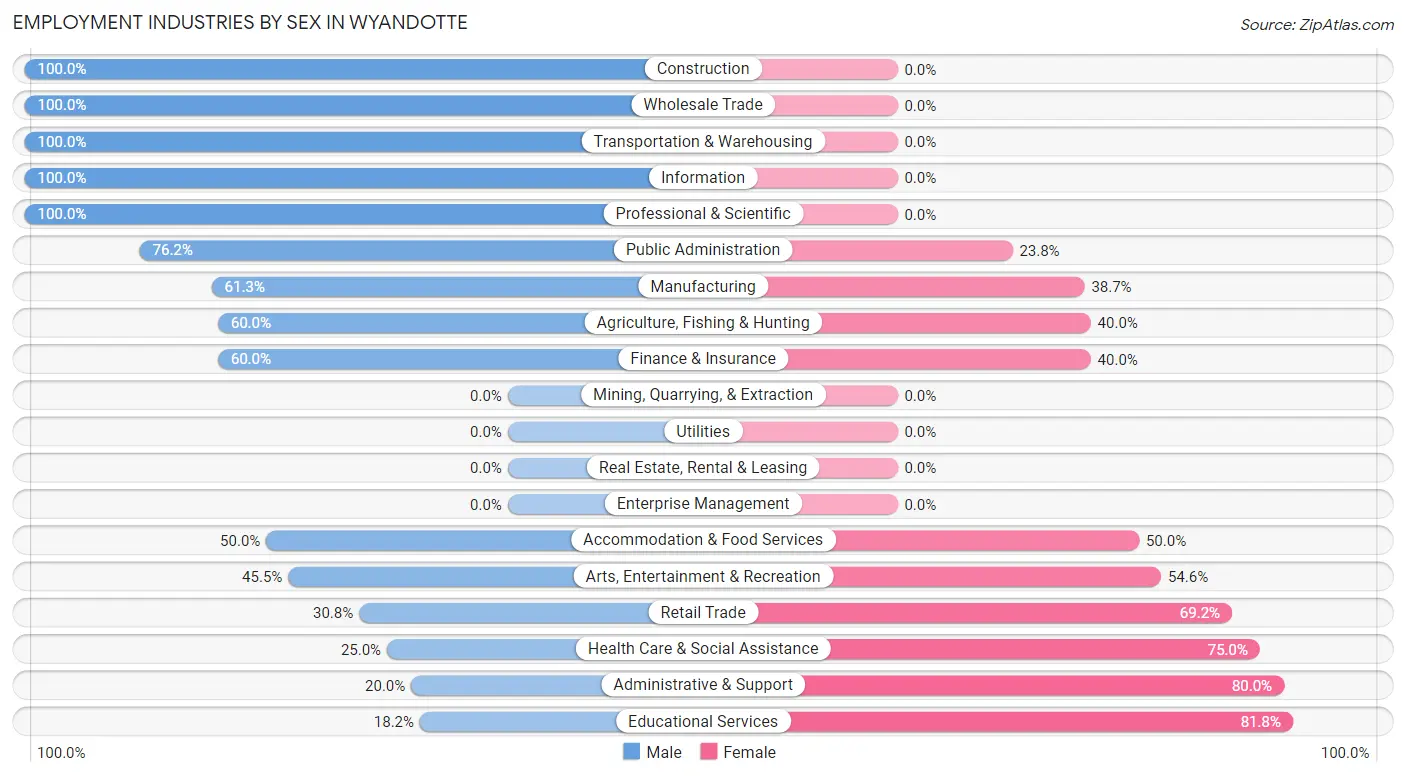
| Industry | Male | Female |
| Agriculture, Fishing & Hunting | 3 (60.0%) | 2 (40.0%) |
| Mining, Quarrying, & Extraction | 0 (0.0%) | 0 (0.0%) |
| Construction | 18 (100.0%) | 0 (0.0%) |
| Manufacturing | 19 (61.3%) | 12 (38.7%) |
| Wholesale Trade | 1 (100.0%) | 0 (0.0%) |
| Retail Trade | 4 (30.8%) | 9 (69.2%) |
| Transportation & Warehousing | 1 (100.0%) | 0 (0.0%) |
| Utilities | 0 (0.0%) | 0 (0.0%) |
| Information | 2 (100.0%) | 0 (0.0%) |
| Finance & Insurance | 3 (60.0%) | 2 (40.0%) |
| Real Estate, Rental & Leasing | 0 (0.0%) | 0 (0.0%) |
| Professional & Scientific | 4 (100.0%) | 0 (0.0%) |
| Enterprise Management | 0 (0.0%) | 0 (0.0%) |
| Administrative & Support | 2 (20.0%) | 8 (80.0%) |
| Educational Services | 2 (18.2%) | 9 (81.8%) |
| Health Care & Social Assistance | 6 (25.0%) | 18 (75.0%) |
| Arts, Entertainment & Recreation | 15 (45.5%) | 18 (54.5%) |
| Accommodation & Food Services | 7 (50.0%) | 7 (50.0%) |
| Public Administration | 16 (76.2%) | 5 (23.8%) |
| Total | 104 (53.6%) | 90 (46.4%) |
Education in Wyandotte
School Enrollment in Wyandotte
The most common levels of schooling among the 144 students in Wyandotte are middle school (45 | 31.2%), high school (36 | 25.0%), and elementary school (26 | 18.1%).
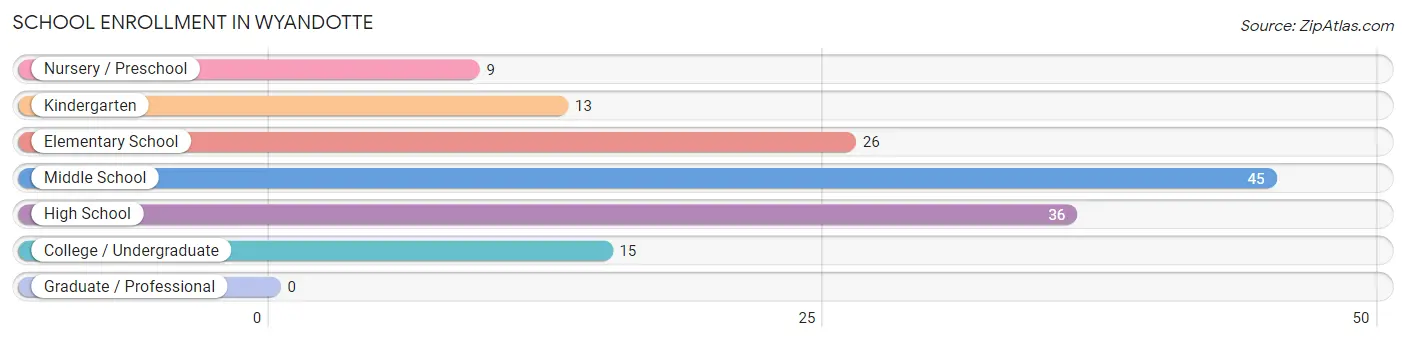
| School Level | # Students | % Students |
| Nursery / Preschool | 9 | 6.2% |
| Kindergarten | 13 | 9.0% |
| Elementary School | 26 | 18.1% |
| Middle School | 45 | 31.2% |
| High School | 36 | 25.0% |
| College / Undergraduate | 15 | 10.4% |
| Graduate / Professional | 0 | 0.0% |
| Total | 144 | 100.0% |
School Enrollment by Age by Funding Source in Wyandotte
Out of a total of 144 students who are enrolled in schools in Wyandotte, 7 (4.9%) attend a private institution, while the remaining 137 (95.1%) are enrolled in public schools. The age group of 18 to 19 year olds has the highest likelihood of being enrolled in private schools, with 2 (20.0% in the age bracket) enrolled. Conversely, the age group of 3 to 4 year olds has the lowest likelihood of being enrolled in a private school, with 5 (100.0% in the age bracket) attending a public institution.
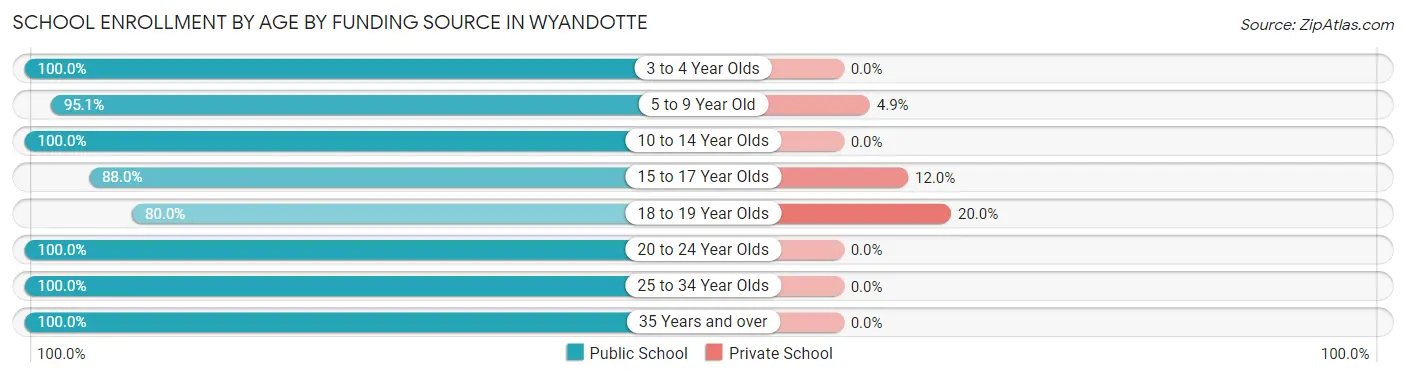
| Age Bracket | Public School | Private School |
| 3 to 4 Year Olds | 5 (100.0%) | 0 (0.0%) |
| 5 to 9 Year Old | 39 (95.1%) | 2 (4.9%) |
| 10 to 14 Year Olds | 48 (100.0%) | 0 (0.0%) |
| 15 to 17 Year Olds | 22 (88.0%) | 3 (12.0%) |
| 18 to 19 Year Olds | 8 (80.0%) | 2 (20.0%) |
| 20 to 24 Year Olds | 6 (100.0%) | 0 (0.0%) |
| 25 to 34 Year Olds | 6 (100.0%) | 0 (0.0%) |
| 35 Years and over | 3 (100.0%) | 0 (0.0%) |
| Total | 137 (95.1%) | 7 (4.9%) |
Educational Attainment by Field of Study in Wyandotte
Business (10 | 33.3%), education (7 | 23.3%), psychology (5 | 16.7%), science & technology (5 | 16.7%), and bio, nature & agricultural (1 | 3.3%) are the most common fields of study among 30 individuals in Wyandotte who have obtained a bachelor's degree or higher.
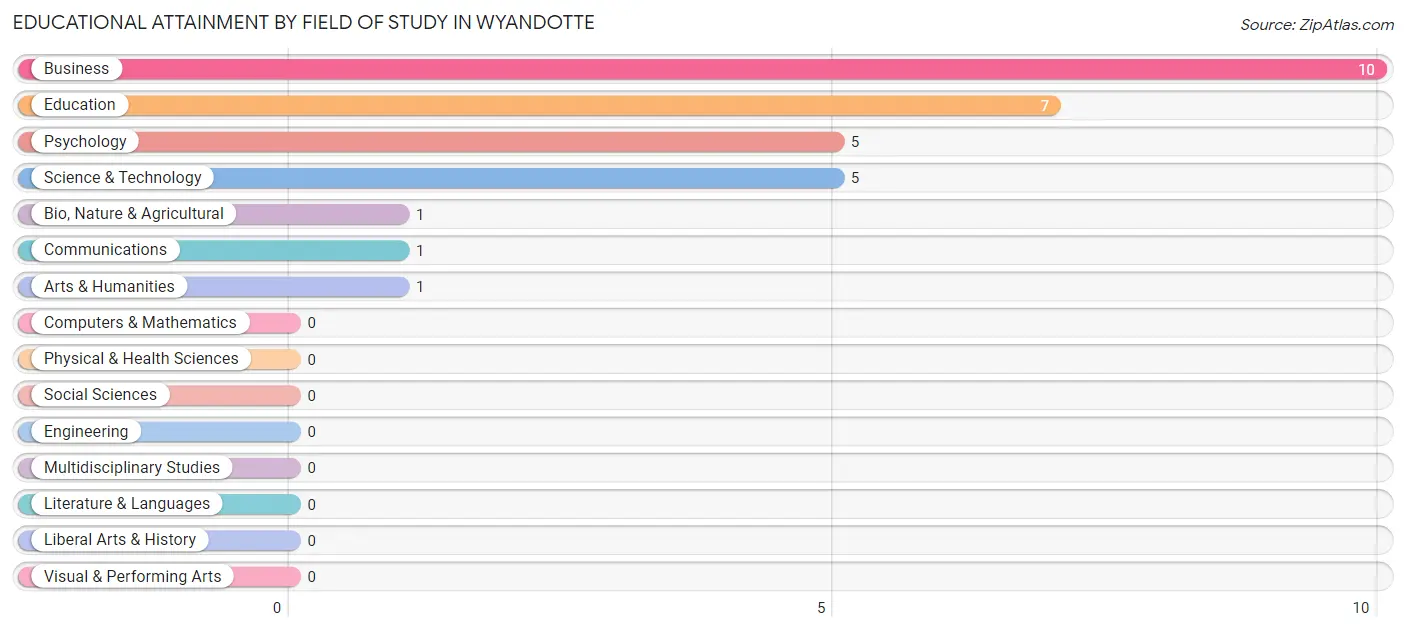
| Field of Study | # Graduates | % Graduates |
| Computers & Mathematics | 0 | 0.0% |
| Bio, Nature & Agricultural | 1 | 3.3% |
| Physical & Health Sciences | 0 | 0.0% |
| Psychology | 5 | 16.7% |
| Social Sciences | 0 | 0.0% |
| Engineering | 0 | 0.0% |
| Multidisciplinary Studies | 0 | 0.0% |
| Science & Technology | 5 | 16.7% |
| Business | 10 | 33.3% |
| Education | 7 | 23.3% |
| Literature & Languages | 0 | 0.0% |
| Liberal Arts & History | 0 | 0.0% |
| Visual & Performing Arts | 0 | 0.0% |
| Communications | 1 | 3.3% |
| Arts & Humanities | 1 | 3.3% |
| Total | 30 | 100.0% |
Transportation & Commute in Wyandotte
Vehicle Availability by Sex in Wyandotte
The most prevalent vehicle ownership categories in Wyandotte are males with 2 vehicles (41, accounting for 40.2%) and females with 2 vehicles (36, making up 47.1%).
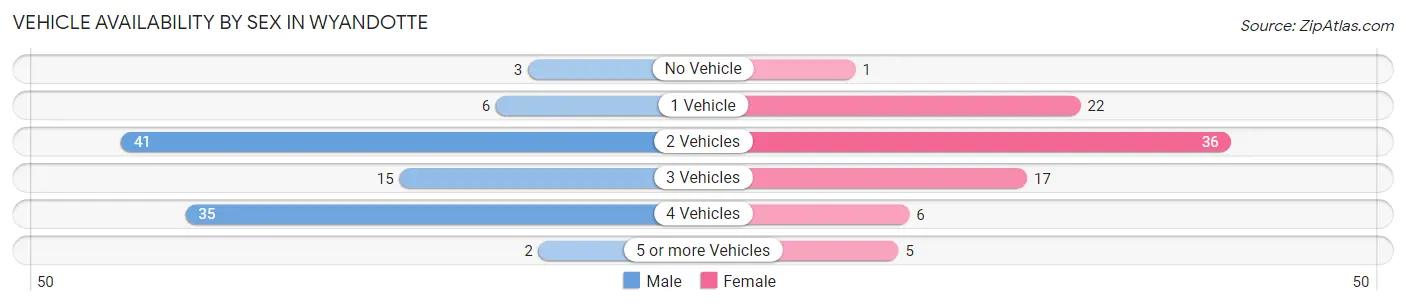
| Vehicles Available | Male | Female |
| No Vehicle | 3 (2.9%) | 1 (1.1%) |
| 1 Vehicle | 6 (5.9%) | 22 (25.3%) |
| 2 Vehicles | 41 (40.2%) | 36 (41.4%) |
| 3 Vehicles | 15 (14.7%) | 17 (19.5%) |
| 4 Vehicles | 35 (34.3%) | 6 (6.9%) |
| 5 or more Vehicles | 2 (2.0%) | 5 (5.8%) |
| Total | 102 (100.0%) | 87 (100.0%) |
Commute Time in Wyandotte
The most frequently occuring commute durations in Wyandotte are less than 5 minutes (27 commuters, 14.3%), 30 to 34 minutes (24 commuters, 12.7%), and 10 to 14 minutes (23 commuters, 12.2%).
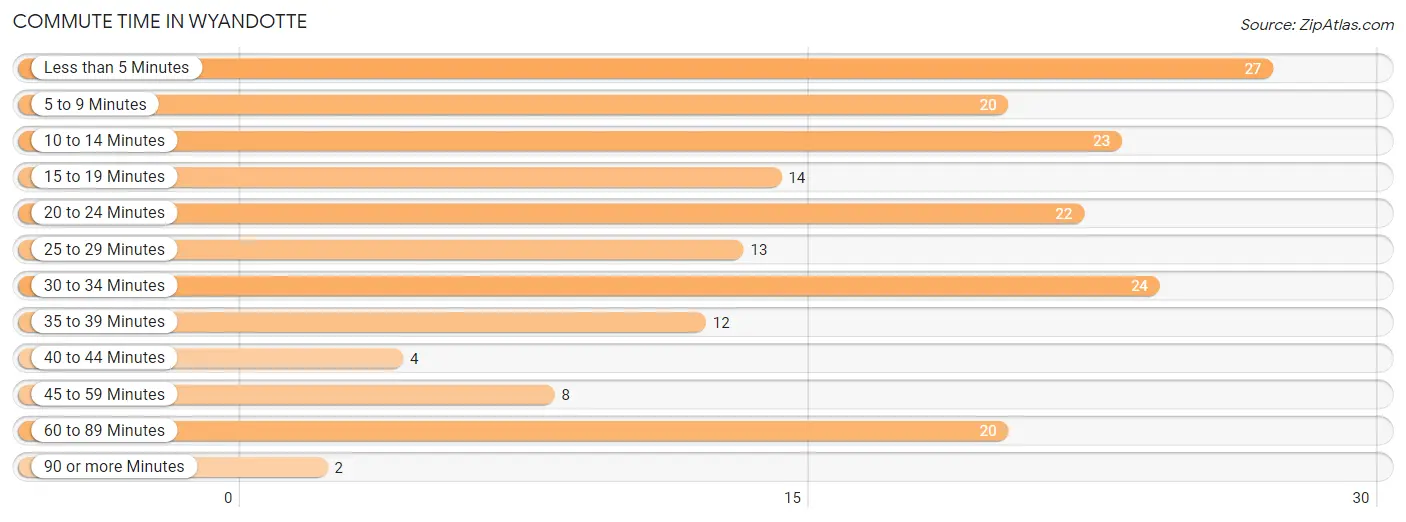
| Commute Time | # Commuters | % Commuters |
| Less than 5 Minutes | 27 | 14.3% |
| 5 to 9 Minutes | 20 | 10.6% |
| 10 to 14 Minutes | 23 | 12.2% |
| 15 to 19 Minutes | 14 | 7.4% |
| 20 to 24 Minutes | 22 | 11.6% |
| 25 to 29 Minutes | 13 | 6.9% |
| 30 to 34 Minutes | 24 | 12.7% |
| 35 to 39 Minutes | 12 | 6.4% |
| 40 to 44 Minutes | 4 | 2.1% |
| 45 to 59 Minutes | 8 | 4.2% |
| 60 to 89 Minutes | 20 | 10.6% |
| 90 or more Minutes | 2 | 1.1% |
Commute Time by Sex in Wyandotte
The most common commute times in Wyandotte are less than 5 minutes (19 commuters, 18.6%) for males and 5 to 9 minutes (13 commuters, 14.9%) for females.
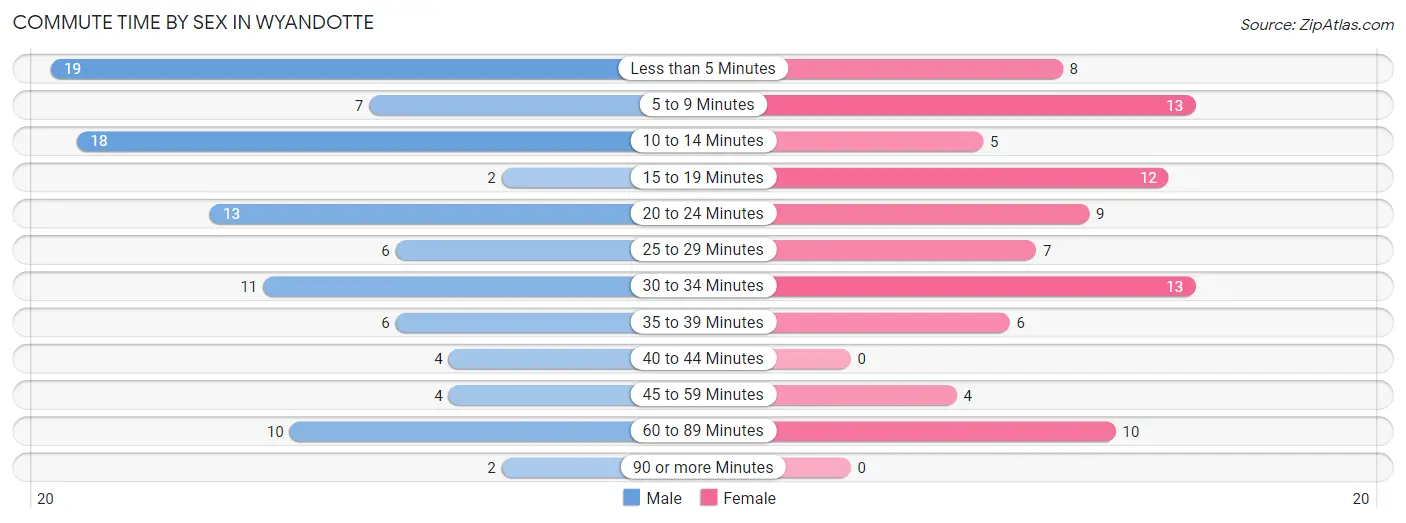
| Commute Time | Male | Female |
| Less than 5 Minutes | 19 (18.6%) | 8 (9.2%) |
| 5 to 9 Minutes | 7 (6.9%) | 13 (14.9%) |
| 10 to 14 Minutes | 18 (17.6%) | 5 (5.8%) |
| 15 to 19 Minutes | 2 (2.0%) | 12 (13.8%) |
| 20 to 24 Minutes | 13 (12.8%) | 9 (10.3%) |
| 25 to 29 Minutes | 6 (5.9%) | 7 (8.1%) |
| 30 to 34 Minutes | 11 (10.8%) | 13 (14.9%) |
| 35 to 39 Minutes | 6 (5.9%) | 6 (6.9%) |
| 40 to 44 Minutes | 4 (3.9%) | 0 (0.0%) |
| 45 to 59 Minutes | 4 (3.9%) | 4 (4.6%) |
| 60 to 89 Minutes | 10 (9.8%) | 10 (11.5%) |
| 90 or more Minutes | 2 (2.0%) | 0 (0.0%) |
Time of Departure to Work by Sex in Wyandotte
The most frequent times of departure to work in Wyandotte are 4:00 PM to 11:59 PM (19, 18.6%) for males and 7:30 AM to 7:59 AM (21, 24.1%) for females.
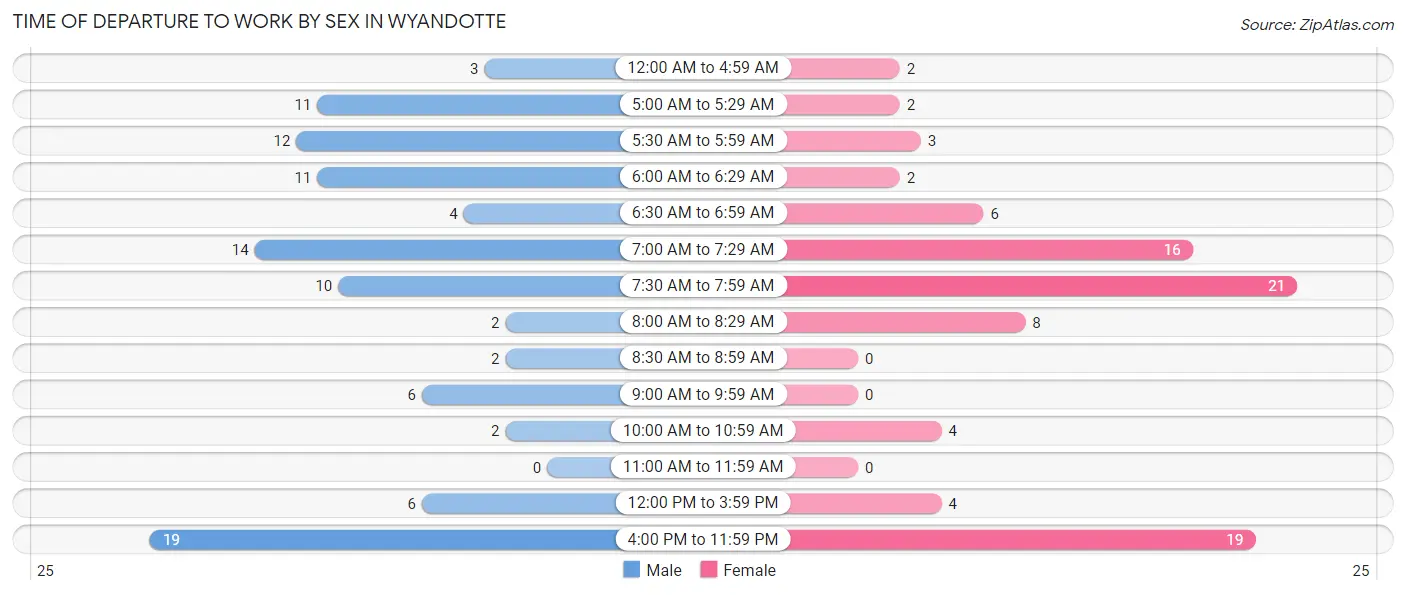
| Time of Departure | Male | Female |
| 12:00 AM to 4:59 AM | 3 (2.9%) | 2 (2.3%) |
| 5:00 AM to 5:29 AM | 11 (10.8%) | 2 (2.3%) |
| 5:30 AM to 5:59 AM | 12 (11.8%) | 3 (3.5%) |
| 6:00 AM to 6:29 AM | 11 (10.8%) | 2 (2.3%) |
| 6:30 AM to 6:59 AM | 4 (3.9%) | 6 (6.9%) |
| 7:00 AM to 7:29 AM | 14 (13.7%) | 16 (18.4%) |
| 7:30 AM to 7:59 AM | 10 (9.8%) | 21 (24.1%) |
| 8:00 AM to 8:29 AM | 2 (2.0%) | 8 (9.2%) |
| 8:30 AM to 8:59 AM | 2 (2.0%) | 0 (0.0%) |
| 9:00 AM to 9:59 AM | 6 (5.9%) | 0 (0.0%) |
| 10:00 AM to 10:59 AM | 2 (2.0%) | 4 (4.6%) |
| 11:00 AM to 11:59 AM | 0 (0.0%) | 0 (0.0%) |
| 12:00 PM to 3:59 PM | 6 (5.9%) | 4 (4.6%) |
| 4:00 PM to 11:59 PM | 19 (18.6%) | 19 (21.8%) |
| Total | 102 (100.0%) | 87 (100.0%) |
Housing Occupancy in Wyandotte
Occupancy by Ownership in Wyandotte
Of the total 205 dwellings in Wyandotte, owner-occupied units account for 113 (55.1%), while renter-occupied units make up 92 (44.9%).
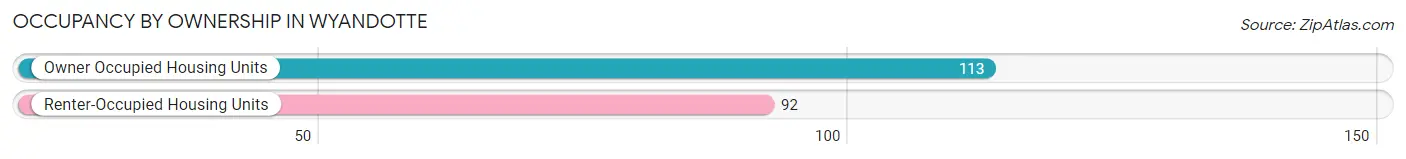
| Occupancy | # Housing Units | % Housing Units |
| Owner Occupied Housing Units | 113 | 55.1% |
| Renter-Occupied Housing Units | 92 | 44.9% |
| Total Occupied Housing Units | 205 | 100.0% |
Occupancy by Household Size in Wyandotte
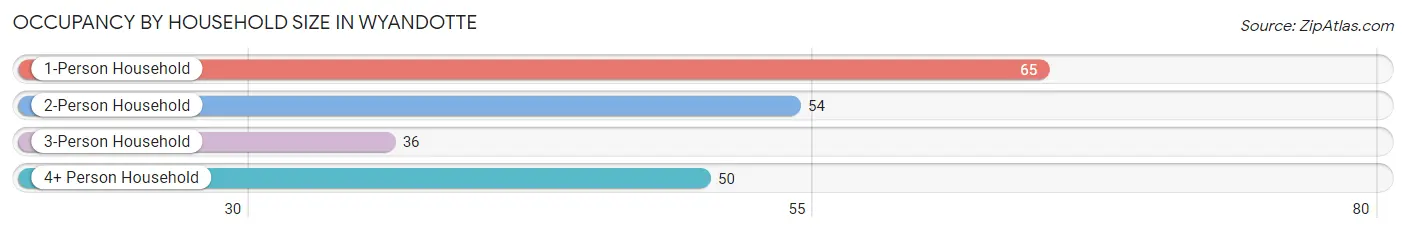
| Household Size | # Housing Units | % Housing Units |
| 1-Person Household | 65 | 31.7% |
| 2-Person Household | 54 | 26.3% |
| 3-Person Household | 36 | 17.6% |
| 4+ Person Household | 50 | 24.4% |
| Total Housing Units | 205 | 100.0% |
Occupancy by Ownership by Household Size in Wyandotte
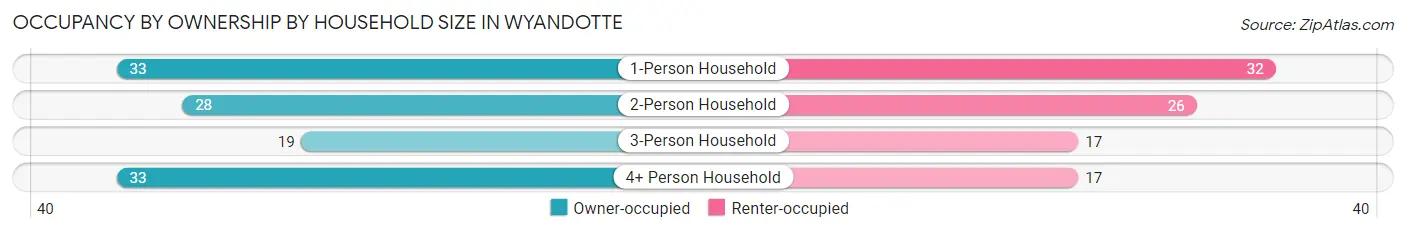
| Household Size | Owner-occupied | Renter-occupied |
| 1-Person Household | 33 (50.8%) | 32 (49.2%) |
| 2-Person Household | 28 (51.8%) | 26 (48.1%) |
| 3-Person Household | 19 (52.8%) | 17 (47.2%) |
| 4+ Person Household | 33 (66.0%) | 17 (34.0%) |
| Total Housing Units | 113 (55.1%) | 92 (44.9%) |
Occupancy by Educational Attainment in Wyandotte
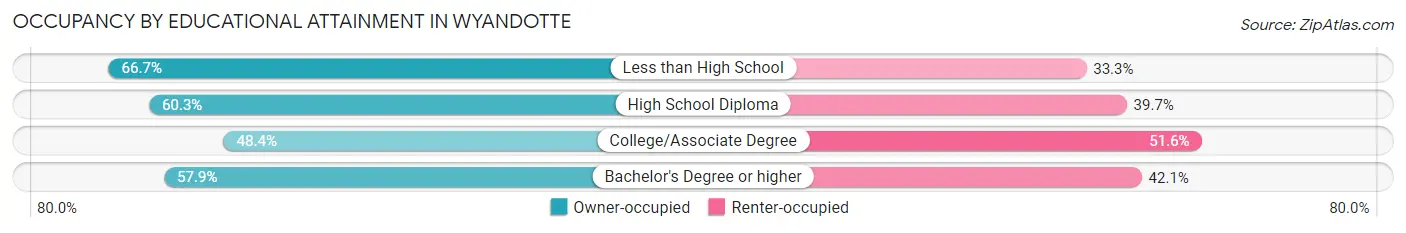
| Household Size | Owner-occupied | Renter-occupied |
| Less than High School | 12 (66.7%) | 6 (33.3%) |
| High School Diploma | 44 (60.3%) | 29 (39.7%) |
| College/Associate Degree | 46 (48.4%) | 49 (51.6%) |
| Bachelor's Degree or higher | 11 (57.9%) | 8 (42.1%) |
Occupancy by Age of Householder in Wyandotte
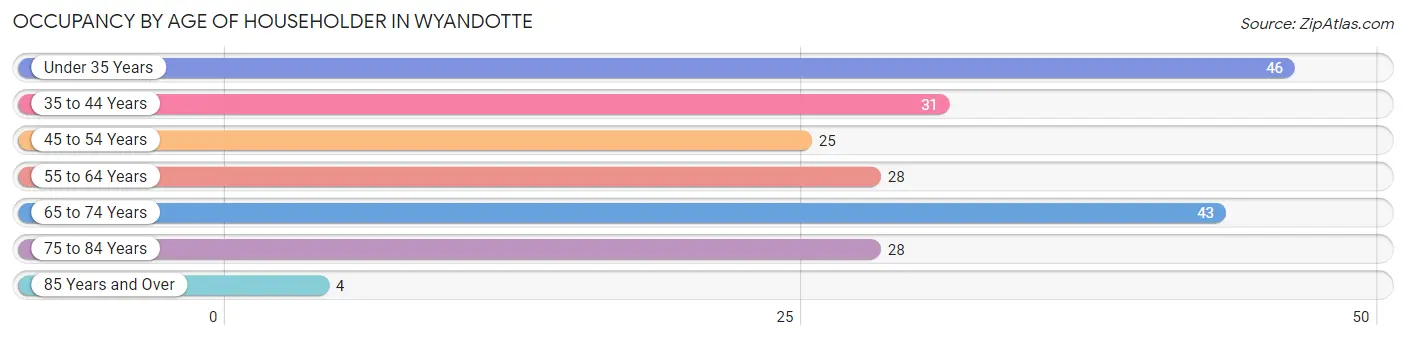
| Age Bracket | # Households | % Households |
| Under 35 Years | 46 | 22.4% |
| 35 to 44 Years | 31 | 15.1% |
| 45 to 54 Years | 25 | 12.2% |
| 55 to 64 Years | 28 | 13.7% |
| 65 to 74 Years | 43 | 21.0% |
| 75 to 84 Years | 28 | 13.7% |
| 85 Years and Over | 4 | 1.9% |
| Total | 205 | 100.0% |
Housing Finances in Wyandotte
Median Income by Occupancy in Wyandotte
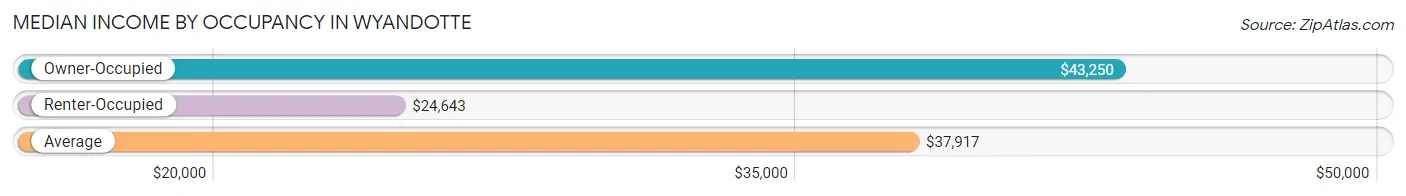
| Occupancy Type | # Households | Median Income |
| Owner-Occupied | 113 (55.1%) | $43,250 |
| Renter-Occupied | 92 (44.9%) | $24,643 |
| Average | 205 (100.0%) | $37,917 |
Occupancy by Householder Income Bracket in Wyandotte
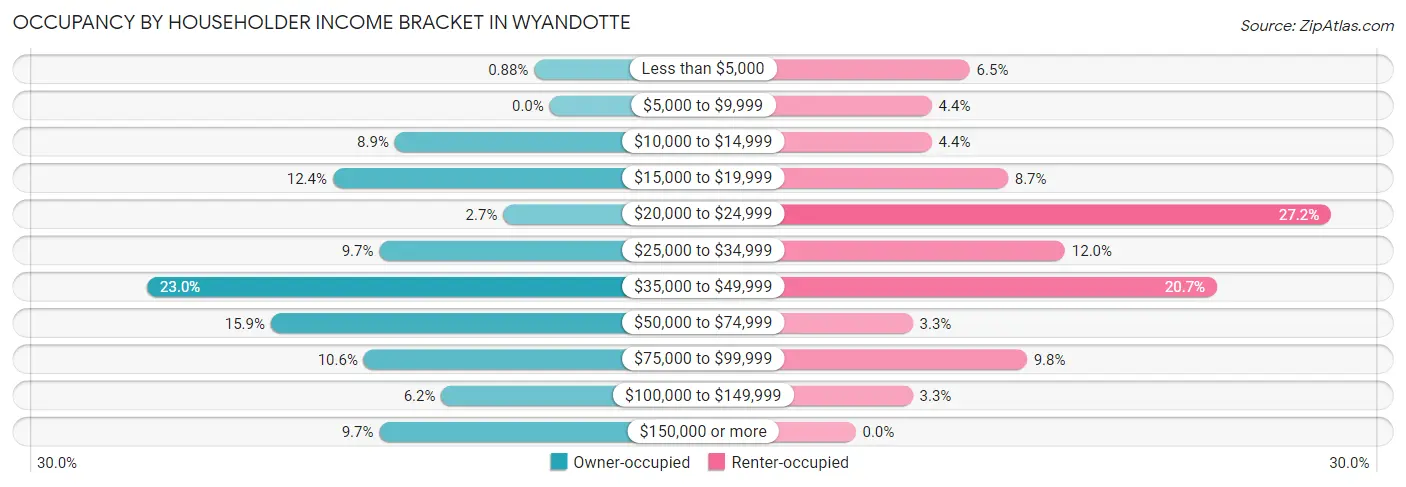
| Income Bracket | Owner-occupied | Renter-occupied |
| Less than $5,000 | 1 (0.9%) | 6 (6.5%) |
| $5,000 to $9,999 | 0 (0.0%) | 4 (4.3%) |
| $10,000 to $14,999 | 10 (8.8%) | 4 (4.3%) |
| $15,000 to $19,999 | 14 (12.4%) | 8 (8.7%) |
| $20,000 to $24,999 | 3 (2.6%) | 25 (27.2%) |
| $25,000 to $34,999 | 11 (9.7%) | 11 (12.0%) |
| $35,000 to $49,999 | 26 (23.0%) | 19 (20.6%) |
| $50,000 to $74,999 | 18 (15.9%) | 3 (3.3%) |
| $75,000 to $99,999 | 12 (10.6%) | 9 (9.8%) |
| $100,000 to $149,999 | 7 (6.2%) | 3 (3.3%) |
| $150,000 or more | 11 (9.7%) | 0 (0.0%) |
| Total | 113 (100.0%) | 92 (100.0%) |
Monthly Housing Cost Tiers in Wyandotte
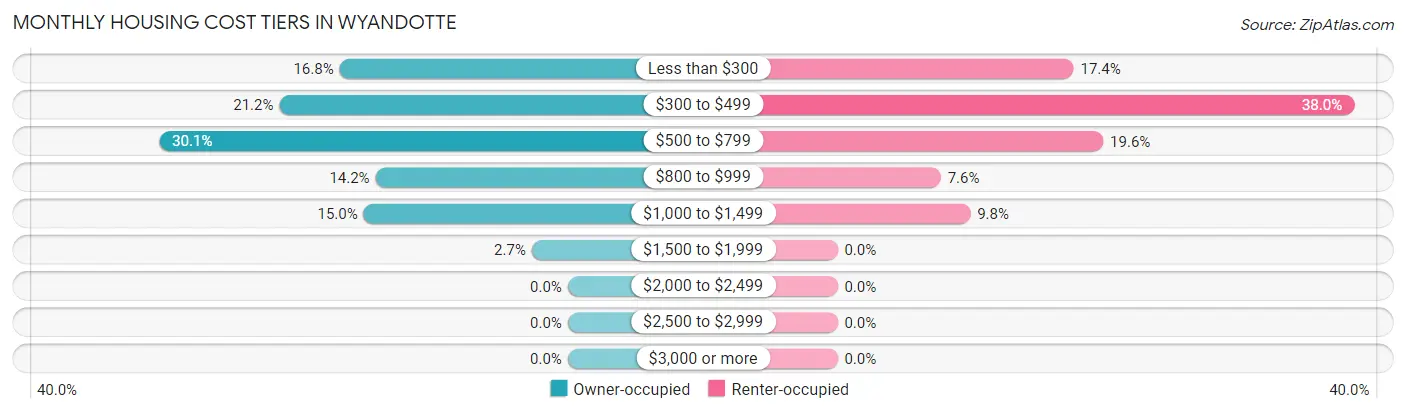
| Monthly Cost | Owner-occupied | Renter-occupied |
| Less than $300 | 19 (16.8%) | 16 (17.4%) |
| $300 to $499 | 24 (21.2%) | 35 (38.0%) |
| $500 to $799 | 34 (30.1%) | 18 (19.6%) |
| $800 to $999 | 16 (14.2%) | 7 (7.6%) |
| $1,000 to $1,499 | 17 (15.0%) | 9 (9.8%) |
| $1,500 to $1,999 | 3 (2.6%) | 0 (0.0%) |
| $2,000 to $2,499 | 0 (0.0%) | 0 (0.0%) |
| $2,500 to $2,999 | 0 (0.0%) | 0 (0.0%) |
| $3,000 or more | 0 (0.0%) | 0 (0.0%) |
| Total | 113 (100.0%) | 92 (100.0%) |
Physical Housing Characteristics in Wyandotte
Housing Structures in Wyandotte
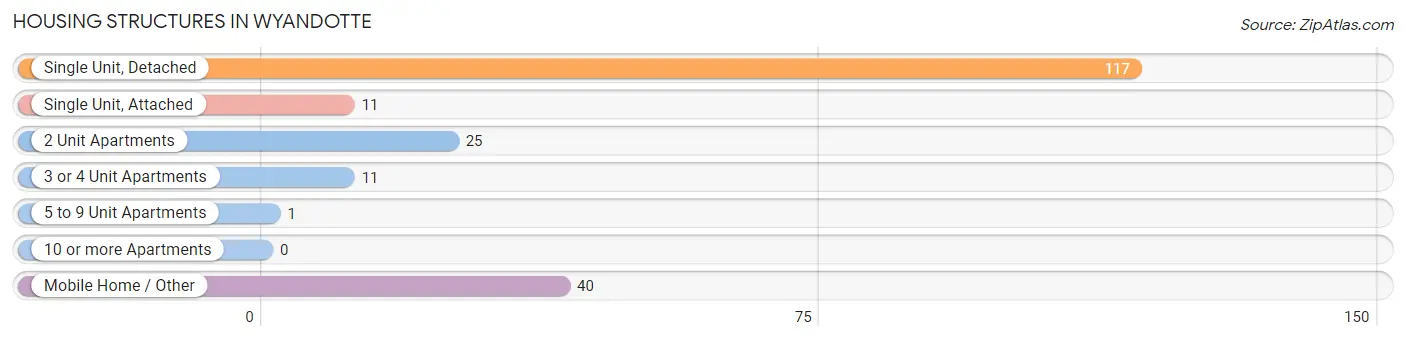
| Structure Type | # Housing Units | % Housing Units |
| Single Unit, Detached | 117 | 57.1% |
| Single Unit, Attached | 11 | 5.4% |
| 2 Unit Apartments | 25 | 12.2% |
| 3 or 4 Unit Apartments | 11 | 5.4% |
| 5 to 9 Unit Apartments | 1 | 0.5% |
| 10 or more Apartments | 0 | 0.0% |
| Mobile Home / Other | 40 | 19.5% |
| Total | 205 | 100.0% |
Housing Structures by Occupancy in Wyandotte
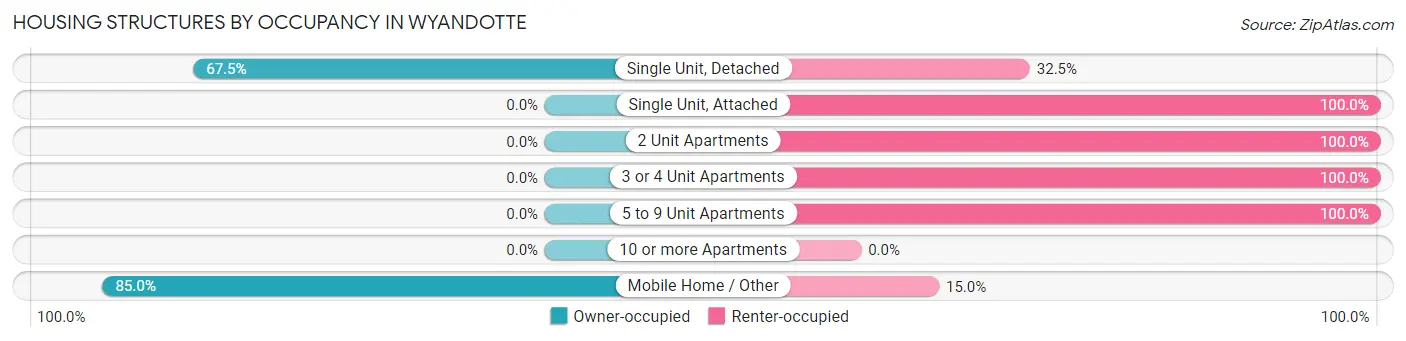
| Structure Type | Owner-occupied | Renter-occupied |
| Single Unit, Detached | 79 (67.5%) | 38 (32.5%) |
| Single Unit, Attached | 0 (0.0%) | 11 (100.0%) |
| 2 Unit Apartments | 0 (0.0%) | 25 (100.0%) |
| 3 or 4 Unit Apartments | 0 (0.0%) | 11 (100.0%) |
| 5 to 9 Unit Apartments | 0 (0.0%) | 1 (100.0%) |
| 10 or more Apartments | 0 (0.0%) | 0 (0.0%) |
| Mobile Home / Other | 34 (85.0%) | 6 (15.0%) |
| Total | 113 (55.1%) | 92 (44.9%) |
Housing Structures by Number of Rooms in Wyandotte
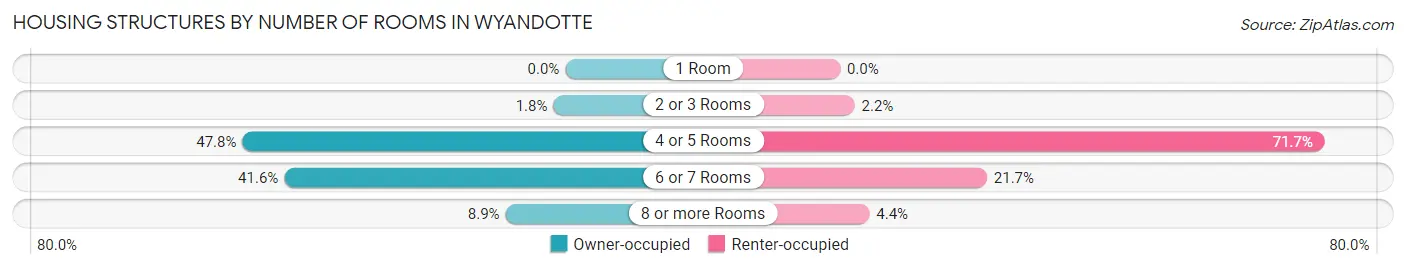
| Number of Rooms | Owner-occupied | Renter-occupied |
| 1 Room | 0 (0.0%) | 0 (0.0%) |
| 2 or 3 Rooms | 2 (1.8%) | 2 (2.2%) |
| 4 or 5 Rooms | 54 (47.8%) | 66 (71.7%) |
| 6 or 7 Rooms | 47 (41.6%) | 20 (21.7%) |
| 8 or more Rooms | 10 (8.8%) | 4 (4.3%) |
| Total | 113 (100.0%) | 92 (100.0%) |
Housing Structure by Heating Type in Wyandotte
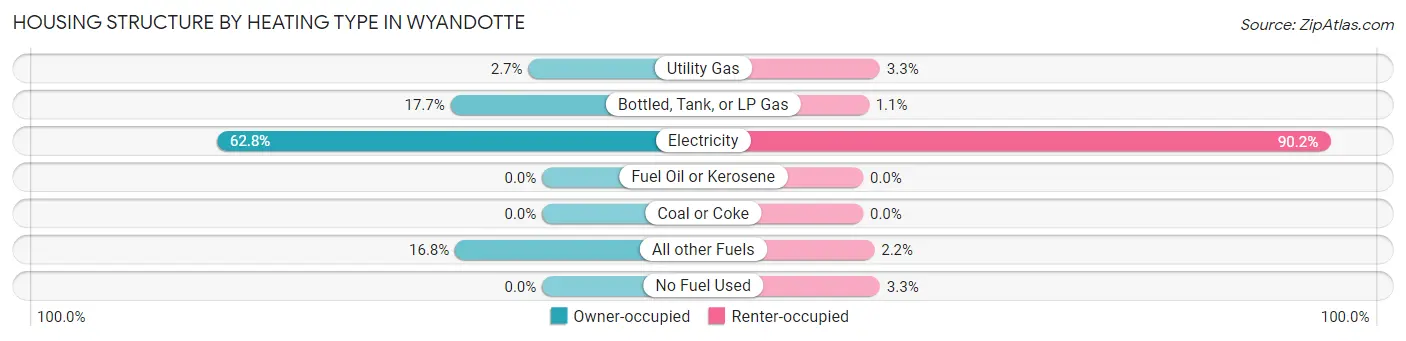
| Heating Type | Owner-occupied | Renter-occupied |
| Utility Gas | 3 (2.6%) | 3 (3.3%) |
| Bottled, Tank, or LP Gas | 20 (17.7%) | 1 (1.1%) |
| Electricity | 71 (62.8%) | 83 (90.2%) |
| Fuel Oil or Kerosene | 0 (0.0%) | 0 (0.0%) |
| Coal or Coke | 0 (0.0%) | 0 (0.0%) |
| All other Fuels | 19 (16.8%) | 2 (2.2%) |
| No Fuel Used | 0 (0.0%) | 3 (3.3%) |
| Total | 113 (100.0%) | 92 (100.0%) |
Household Vehicle Usage in Wyandotte
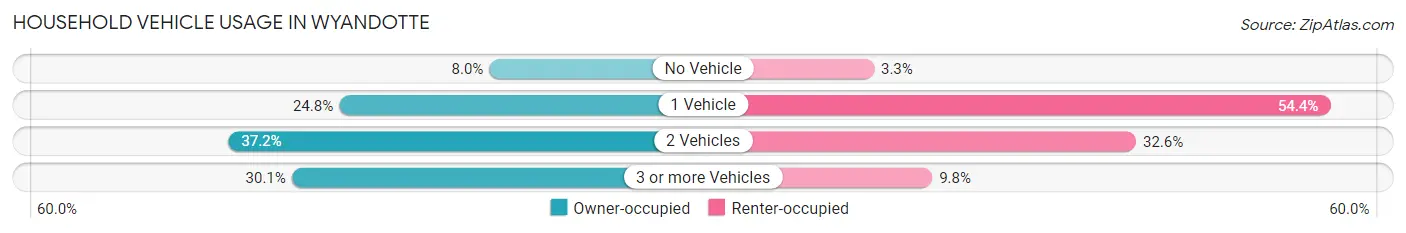
| Vehicles per Household | Owner-occupied | Renter-occupied |
| No Vehicle | 9 (8.0%) | 3 (3.3%) |
| 1 Vehicle | 28 (24.8%) | 50 (54.3%) |
| 2 Vehicles | 42 (37.2%) | 30 (32.6%) |
| 3 or more Vehicles | 34 (30.1%) | 9 (9.8%) |
| Total | 113 (100.0%) | 92 (100.0%) |
Real Estate & Mortgages in Wyandotte
Real Estate and Mortgage Overview in Wyandotte
| Characteristic | Without Mortgage | With Mortgage |
| Housing Units | 57 | 56 |
| Median Property Value | - | - |
| Median Household Income | $37,813 | $11 |
| Monthly Housing Costs | $368 | $0 |
| Real Estate Taxes | $306 | $5 |
Property Value by Mortgage Status in Wyandotte
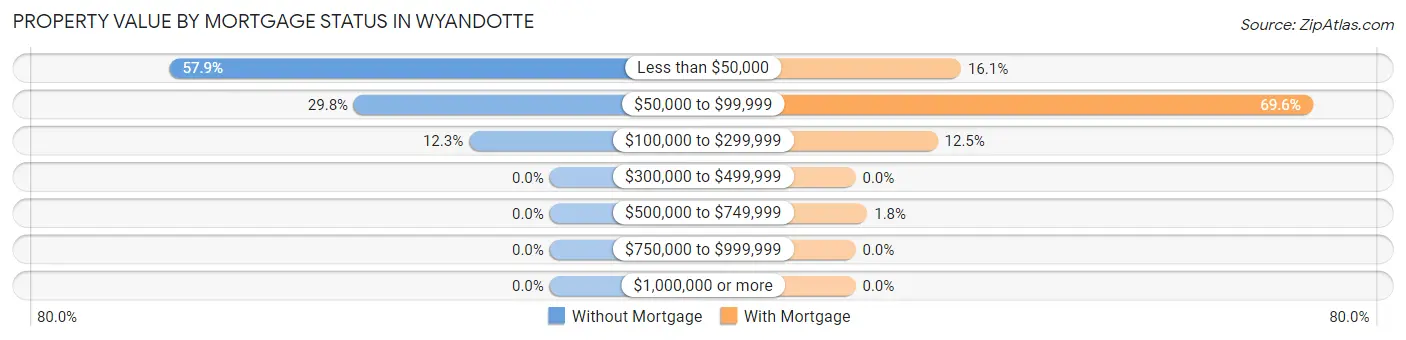
| Property Value | Without Mortgage | With Mortgage |
| Less than $50,000 | 33 (57.9%) | 9 (16.1%) |
| $50,000 to $99,999 | 17 (29.8%) | 39 (69.6%) |
| $100,000 to $299,999 | 7 (12.3%) | 7 (12.5%) |
| $300,000 to $499,999 | 0 (0.0%) | 0 (0.0%) |
| $500,000 to $749,999 | 0 (0.0%) | 1 (1.8%) |
| $750,000 to $999,999 | 0 (0.0%) | 0 (0.0%) |
| $1,000,000 or more | 0 (0.0%) | 0 (0.0%) |
| Total | 57 (100.0%) | 56 (100.0%) |
Household Income by Mortgage Status in Wyandotte
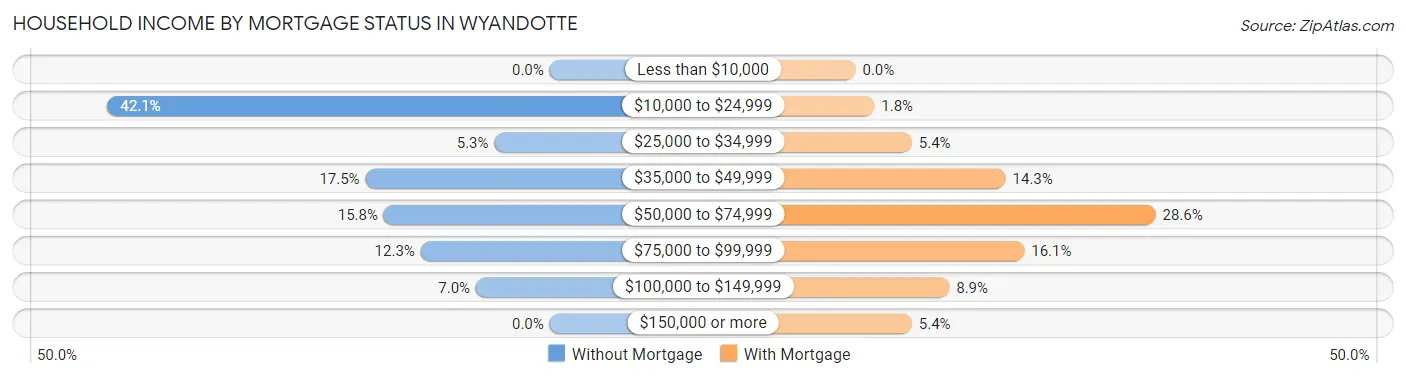
| Household Income | Without Mortgage | With Mortgage |
| Less than $10,000 | 0 (0.0%) | 0 (0.0%) |
| $10,000 to $24,999 | 24 (42.1%) | 1 (1.8%) |
| $25,000 to $34,999 | 3 (5.3%) | 3 (5.4%) |
| $35,000 to $49,999 | 10 (17.5%) | 8 (14.3%) |
| $50,000 to $74,999 | 9 (15.8%) | 16 (28.6%) |
| $75,000 to $99,999 | 7 (12.3%) | 9 (16.1%) |
| $100,000 to $149,999 | 4 (7.0%) | 5 (8.9%) |
| $150,000 or more | 0 (0.0%) | 3 (5.4%) |
| Total | 57 (100.0%) | 56 (100.0%) |
Property Value to Household Income Ratio in Wyandotte
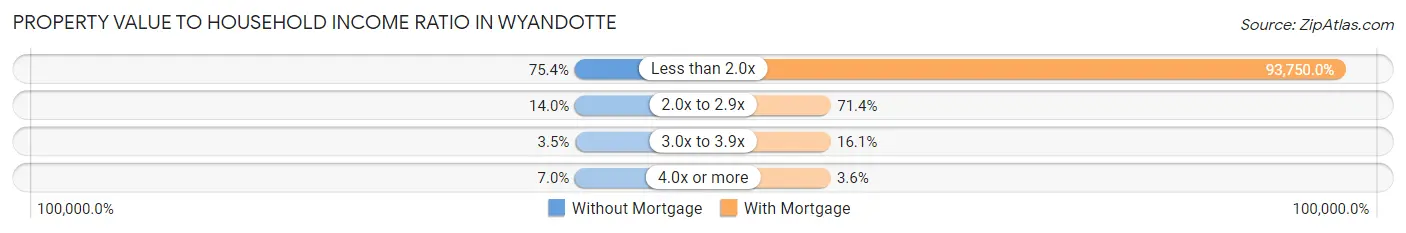
| Value-to-Income Ratio | Without Mortgage | With Mortgage |
| Less than 2.0x | 43 (75.4%) | 52,500 (93,750.0%) |
| 2.0x to 2.9x | 8 (14.0%) | 40 (71.4%) |
| 3.0x to 3.9x | 2 (3.5%) | 9 (16.1%) |
| 4.0x or more | 4 (7.0%) | 2 (3.6%) |
| Total | 57 (100.0%) | 56 (100.0%) |
Real Estate Taxes by Mortgage Status in Wyandotte
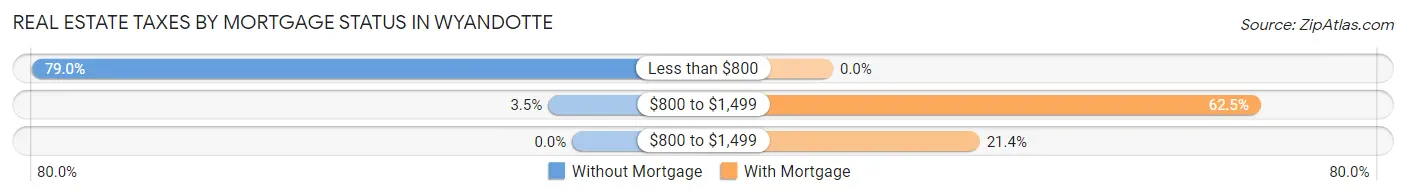
| Property Taxes | Without Mortgage | With Mortgage |
| Less than $800 | 45 (78.9%) | 0 (0.0%) |
| $800 to $1,499 | 2 (3.5%) | 35 (62.5%) |
| $800 to $1,499 | 0 (0.0%) | 12 (21.4%) |
| Total | 57 (100.0%) | 56 (100.0%) |
Health & Disability in Wyandotte
Health Insurance Coverage by Age in Wyandotte
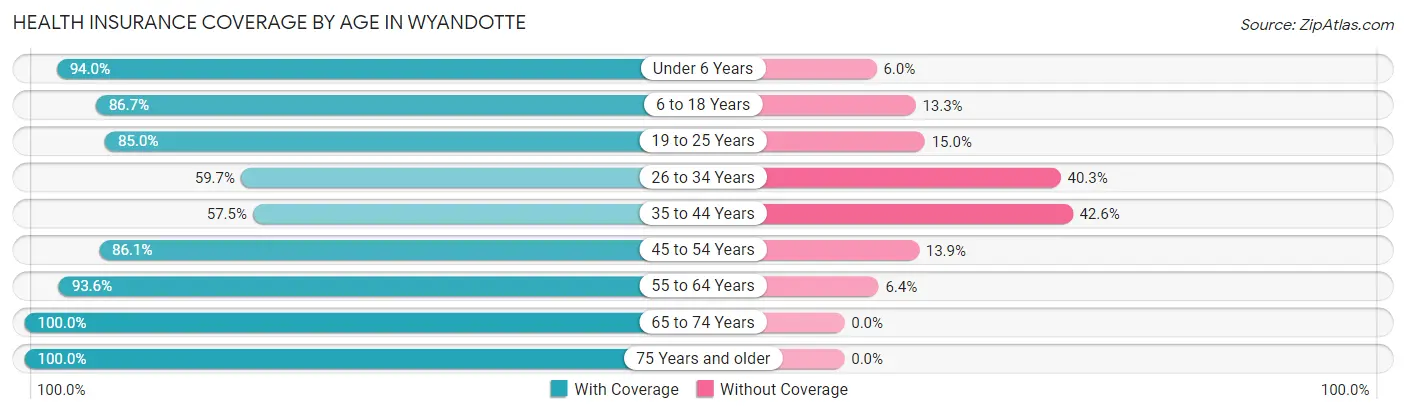
| Age Bracket | With Coverage | Without Coverage |
| Under 6 Years | 47 (94.0%) | 3 (6.0%) |
| 6 to 18 Years | 98 (86.7%) | 15 (13.3%) |
| 19 to 25 Years | 51 (85.0%) | 9 (15.0%) |
| 26 to 34 Years | 37 (59.7%) | 25 (40.3%) |
| 35 to 44 Years | 27 (57.5%) | 20 (42.5%) |
| 45 to 54 Years | 31 (86.1%) | 5 (13.9%) |
| 55 to 64 Years | 44 (93.6%) | 3 (6.4%) |
| 65 to 74 Years | 48 (100.0%) | 0 (0.0%) |
| 75 Years and older | 43 (100.0%) | 0 (0.0%) |
| Total | 426 (84.2%) | 80 (15.8%) |
Health Insurance Coverage by Citizenship Status in Wyandotte
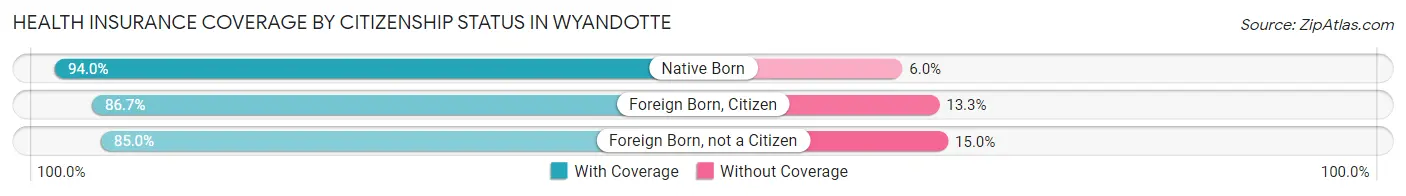
| Citizenship Status | With Coverage | Without Coverage |
| Native Born | 47 (94.0%) | 3 (6.0%) |
| Foreign Born, Citizen | 98 (86.7%) | 15 (13.3%) |
| Foreign Born, not a Citizen | 51 (85.0%) | 9 (15.0%) |
Health Insurance Coverage by Household Income in Wyandotte
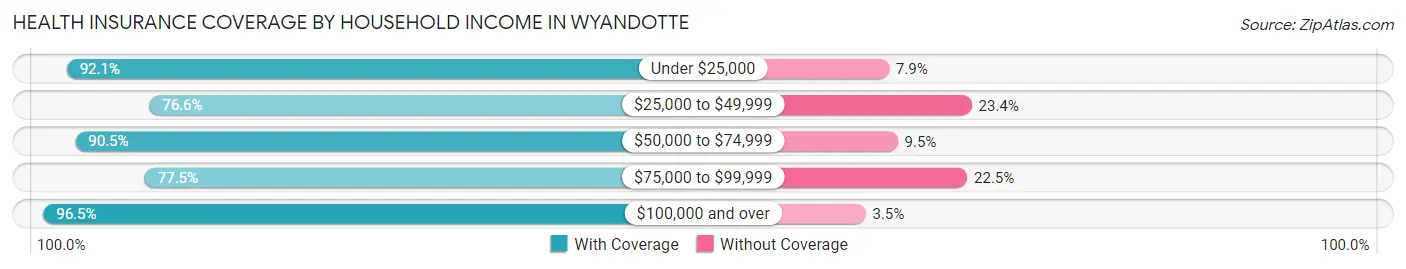
| Household Income | With Coverage | Without Coverage |
| Under $25,000 | 105 (92.1%) | 9 (7.9%) |
| $25,000 to $49,999 | 154 (76.6%) | 47 (23.4%) |
| $50,000 to $74,999 | 57 (90.5%) | 6 (9.5%) |
| $75,000 to $99,999 | 55 (77.5%) | 16 (22.5%) |
| $100,000 and over | 55 (96.5%) | 2 (3.5%) |
Public vs Private Health Insurance Coverage by Age in Wyandotte
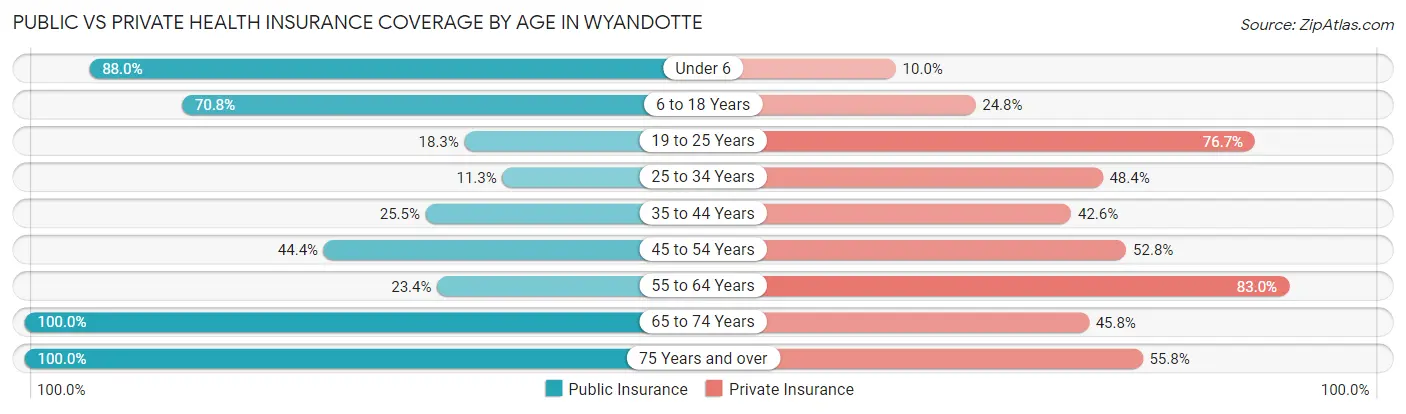
| Age Bracket | Public Insurance | Private Insurance |
| Under 6 | 44 (88.0%) | 5 (10.0%) |
| 6 to 18 Years | 80 (70.8%) | 28 (24.8%) |
| 19 to 25 Years | 11 (18.3%) | 46 (76.7%) |
| 25 to 34 Years | 7 (11.3%) | 30 (48.4%) |
| 35 to 44 Years | 12 (25.5%) | 20 (42.5%) |
| 45 to 54 Years | 16 (44.4%) | 19 (52.8%) |
| 55 to 64 Years | 11 (23.4%) | 39 (83.0%) |
| 65 to 74 Years | 48 (100.0%) | 22 (45.8%) |
| 75 Years and over | 43 (100.0%) | 24 (55.8%) |
| Total | 272 (53.7%) | 233 (46.1%) |
Disability Status by Sex by Age in Wyandotte
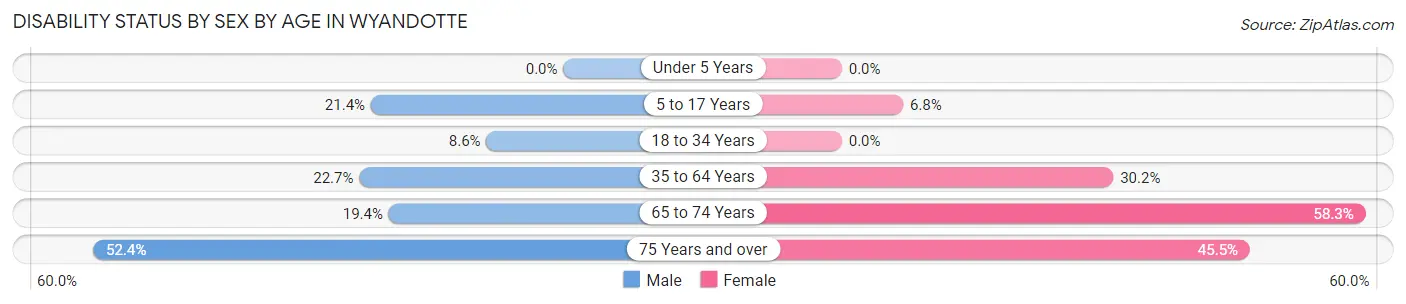
| Age Bracket | Male | Female |
| Under 5 Years | 0 (0.0%) | 0 (0.0%) |
| 5 to 17 Years | 15 (21.4%) | 3 (6.8%) |
| 18 to 34 Years | 6 (8.6%) | 0 (0.0%) |
| 35 to 64 Years | 10 (22.7%) | 26 (30.2%) |
| 65 to 74 Years | 7 (19.4%) | 7 (58.3%) |
| 75 Years and over | 11 (52.4%) | 10 (45.5%) |
Disability Class by Sex by Age in Wyandotte
Disability Class: Hearing Difficulty
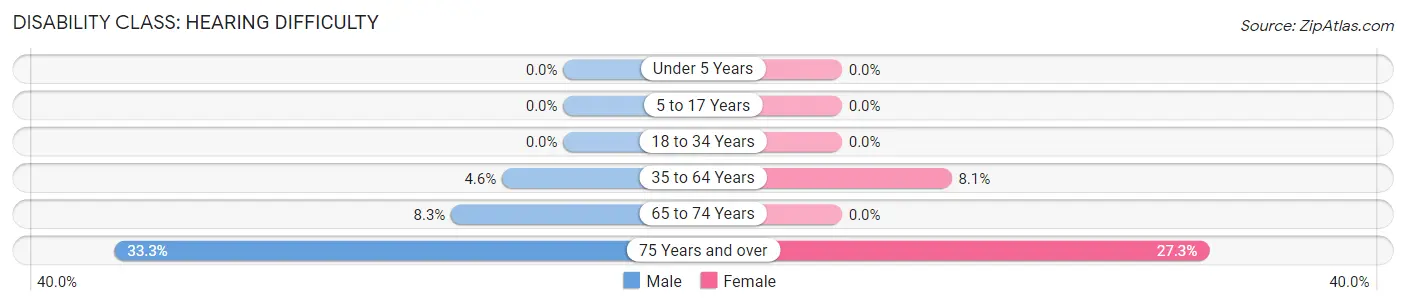
| Age Bracket | Male | Female |
| Under 5 Years | 0 (0.0%) | 0 (0.0%) |
| 5 to 17 Years | 0 (0.0%) | 0 (0.0%) |
| 18 to 34 Years | 0 (0.0%) | 0 (0.0%) |
| 35 to 64 Years | 2 (4.5%) | 7 (8.1%) |
| 65 to 74 Years | 3 (8.3%) | 0 (0.0%) |
| 75 Years and over | 7 (33.3%) | 6 (27.3%) |
Disability Class: Vision Difficulty
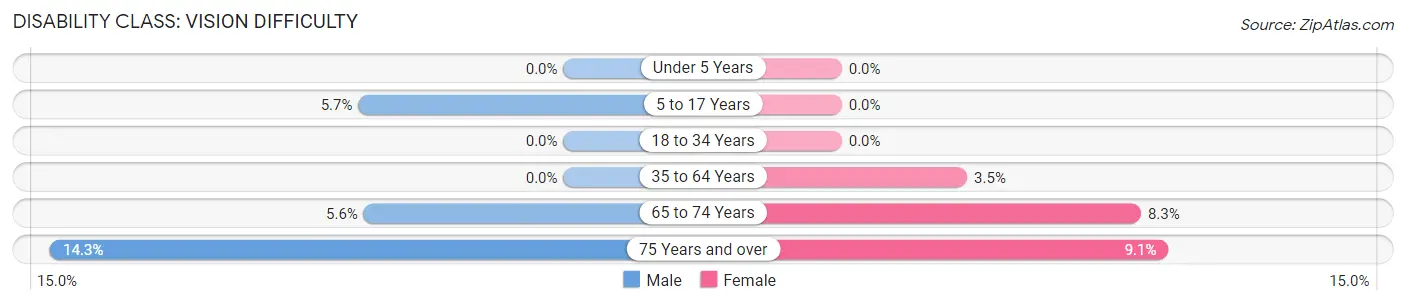
| Age Bracket | Male | Female |
| Under 5 Years | 0 (0.0%) | 0 (0.0%) |
| 5 to 17 Years | 4 (5.7%) | 0 (0.0%) |
| 18 to 34 Years | 0 (0.0%) | 0 (0.0%) |
| 35 to 64 Years | 0 (0.0%) | 3 (3.5%) |
| 65 to 74 Years | 2 (5.6%) | 1 (8.3%) |
| 75 Years and over | 3 (14.3%) | 2 (9.1%) |
Disability Class: Cognitive Difficulty
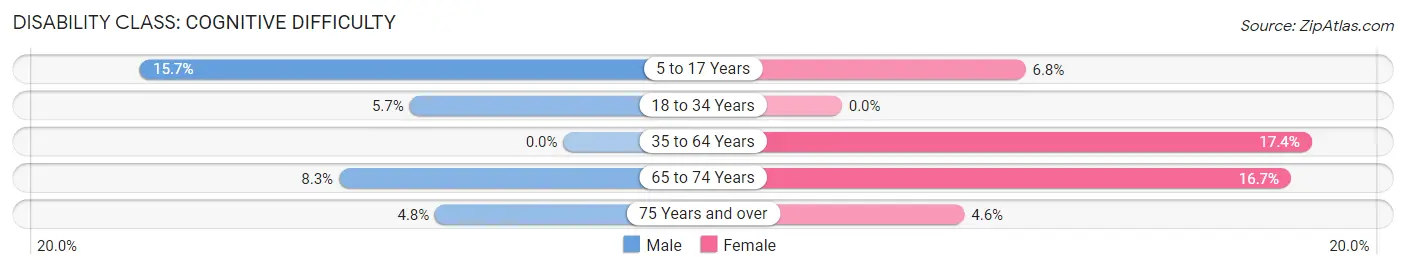
| Age Bracket | Male | Female |
| 5 to 17 Years | 11 (15.7%) | 3 (6.8%) |
| 18 to 34 Years | 4 (5.7%) | 0 (0.0%) |
| 35 to 64 Years | 0 (0.0%) | 15 (17.4%) |
| 65 to 74 Years | 3 (8.3%) | 2 (16.7%) |
| 75 Years and over | 1 (4.8%) | 1 (4.5%) |
Disability Class: Ambulatory Difficulty
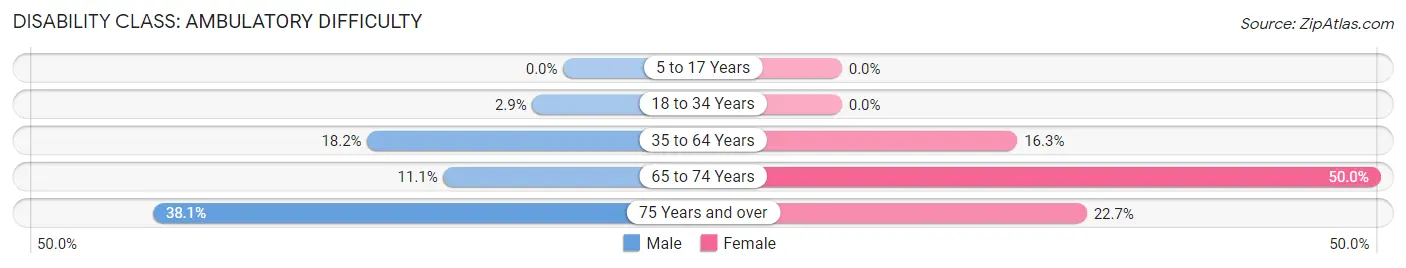
| Age Bracket | Male | Female |
| 5 to 17 Years | 0 (0.0%) | 0 (0.0%) |
| 18 to 34 Years | 2 (2.9%) | 0 (0.0%) |
| 35 to 64 Years | 8 (18.2%) | 14 (16.3%) |
| 65 to 74 Years | 4 (11.1%) | 6 (50.0%) |
| 75 Years and over | 8 (38.1%) | 5 (22.7%) |
Disability Class: Self-Care Difficulty
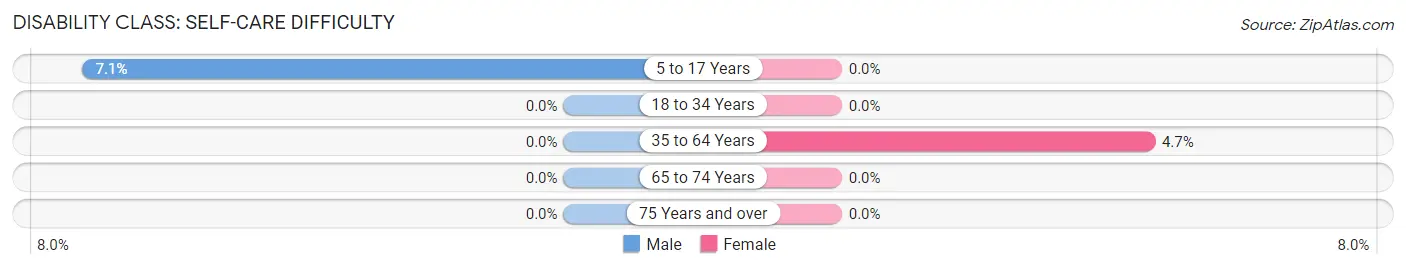
| Age Bracket | Male | Female |
| 5 to 17 Years | 5 (7.1%) | 0 (0.0%) |
| 18 to 34 Years | 0 (0.0%) | 0 (0.0%) |
| 35 to 64 Years | 0 (0.0%) | 4 (4.6%) |
| 65 to 74 Years | 0 (0.0%) | 0 (0.0%) |
| 75 Years and over | 0 (0.0%) | 0 (0.0%) |
Technology Access in Wyandotte
Computing Device Access in Wyandotte
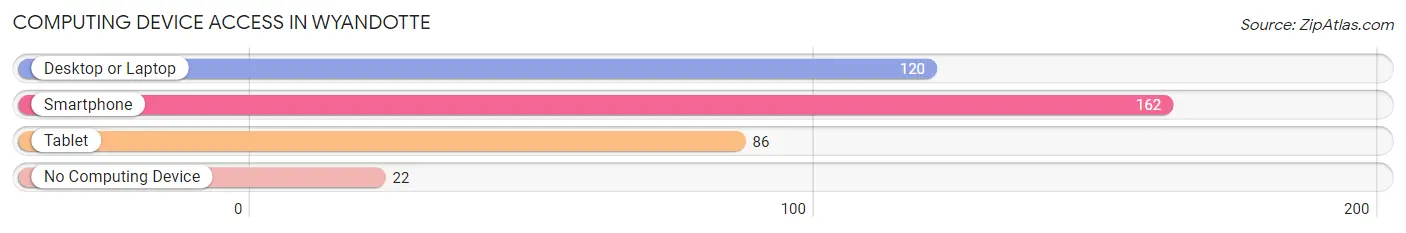
| Device Type | # Households | % Households |
| Desktop or Laptop | 120 | 58.5% |
| Smartphone | 162 | 79.0% |
| Tablet | 86 | 41.9% |
| No Computing Device | 22 | 10.7% |
| Total | 205 | 100.0% |
Internet Access in Wyandotte
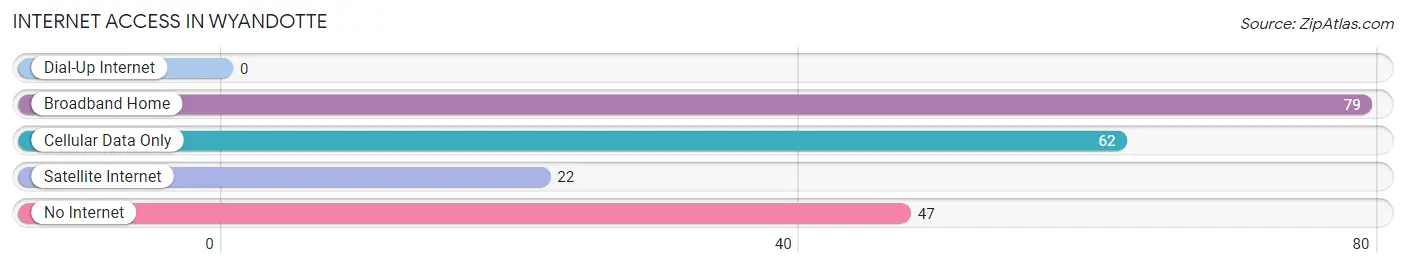
| Internet Type | # Households | % Households |
| Dial-Up Internet | 0 | 0.0% |
| Broadband Home | 79 | 38.5% |
| Cellular Data Only | 62 | 30.2% |
| Satellite Internet | 22 | 10.7% |
| No Internet | 47 | 22.9% |
| Total | 205 | 100.0% |
Wyandotte Summary
Wyandotte is a small town located in Ottawa County, Oklahoma, United States. It is situated on the banks of the Grand River, approximately 10 miles south of Miami, Oklahoma. The town was founded in 1872 by the Wyandotte Nation of Native Americans, who were relocated to the area from their ancestral homelands in the Great Lakes region. The town was named after the Wyandotte Nation, and the name is derived from the Wyandot language, meaning “dwellers on the peninsula”.
Geography
Wyandotte is located in the northeastern corner of Ottawa County, Oklahoma, at the intersection of U.S. Route 59 and State Highway 10. The town is situated on the banks of the Grand River, approximately 10 miles south of Miami, Oklahoma. The town is surrounded by rolling hills and wooded areas, and is located in the foothills of the Ozark Mountains. The town has a total area of 1.2 square miles, all of which is land.
Demographics
As of the 2010 census, Wyandotte had a population of 1,092. The racial makeup of the town was 79.2% White, 0.2% African American, 16.2% Native American, 0.2% Asian, 0.1% Pacific Islander, 0.7% from other races, and 3.6% from two or more races. Hispanic or Latino of any race were 2.2% of the population.
Economy
Wyandotte’s economy is largely based on agriculture and tourism. The town is home to several small businesses, including a grocery store, a hardware store, a restaurant, and a gas station. The town also has a small airport, which is used for recreational flying.
The town is also home to the Wyandotte Nation Casino, which opened in 2004. The casino is owned and operated by the Wyandotte Nation, and offers a variety of gaming options, including slots, table games, and a poker room. The casino also features a hotel, a restaurant, and a bar.
History
Wyandotte was founded in 1872 by the Wyandotte Nation of Native Americans, who were relocated to the area from their ancestral homelands in the Great Lakes region. The town was named after the Wyandotte Nation, and the name is derived from the Wyandot language, meaning “dwellers on the peninsula”.
The town was originally a small farming community, and the main crops grown were corn, wheat, and cotton. The town also had a small sawmill, which provided lumber for the local area.
In the early 1900s, the town began to grow and develop, and the population increased. The town was incorporated in 1910, and the first mayor was elected in 1911.
In the 1920s, the town began to experience a period of economic growth, and several new businesses were established. The town also saw the construction of a new school, a bank, and a post office.
In the 1930s, the town experienced a period of decline, as the Great Depression hit the area. The population decreased, and many businesses closed.
In the 1940s, the town began to experience a period of recovery, and the population began to increase. The town also saw the construction of a new hospital, and the opening of a new movie theater.
In the 1950s, the town experienced a period of growth, and the population increased. The town also saw the construction of a new library, and the opening of a new shopping center.
In the 1960s, the town experienced a period of decline, as the population decreased and businesses closed.
In the 1970s, the town began to experience a period of recovery, and the population began to increase. The town also saw the construction of a new fire station, and the opening of a new library.
In the 1980s, the town experienced a period of growth, and the population increased. The town also saw the construction of a new police station, and the opening of a new hospital.
In the 1990s, the town experienced a period of decline, as the population decreased and businesses closed.
Today, Wyandotte is a small town with a population of approximately 1,092. The town is largely a bedroom community, and the economy is based on agriculture and tourism. The town is home to several small businesses, including a grocery store, a hardware store, a restaurant, and a gas station. The town also has a small airport, which is used for recreational flying. The town is also home to the Wyandotte Nation Casino, which opened in 2004.
Common Questions
What is the Total Population of Wyandotte?
Total Population of Wyandotte is 506.
What is the Total Male Population of Wyandotte?
Total Male Population of Wyandotte is 264.
What is the Total Female Population of Wyandotte?
Total Female Population of Wyandotte is 242.
What is the Ratio of Males per 100 Females in Wyandotte?
There are 109.09 Males per 100 Females in Wyandotte.
What is the Ratio of Females per 100 Males in Wyandotte?
There are 91.67 Females per 100 Males in Wyandotte.
What is the Median Population Age in Wyandotte?
Median Population Age in Wyandotte is 30.7 Years.
What is the Average Family Size in Wyandotte
Average Family Size in Wyandotte is 3.1 People.
What is the Average Household Size in Wyandotte
Average Household Size in Wyandotte is 2.5 People.
What is Per Capita Income in Wyandotte?
Per Capita income in Wyandotte is $17,896.
What is the Median Family Income in Wyandotte?
Median Family Income in Wyandotte is $39,479.
What is the Median Household income in Wyandotte?
Median Household Income in Wyandotte is $37,917.
What is Income or Wage Gap in Wyandotte?
Income or Wage Gap in Wyandotte is 22.4%.
Women in Wyandotte earn 77.6 cents for every dollar earned by a man.
What is Family Income Deficit in Wyandotte?
Family Income Deficit in Wyandotte is $8,869.
Families that are below poverty line in Wyandotte earn $8,869 less on average than the poverty threshold level.
What is Inequality or Gini Index in Wyandotte?
Inequality or Gini Index in Wyandotte is 0.42.
How Large is the Labor Force in Wyandotte?
There are 213 People in the Labor Forcein in Wyandotte.
What is the Percentage of People in the Labor Force in Wyandotte?
58.8% of People are in the Labor Force in Wyandotte.
What is the Unemployment Rate in Wyandotte?
Unemployment Rate in Wyandotte is 8.9%.