Zip Codes with the Highest Percentage of Population Employed in Security & Protection in Stillwater, OK
RELATED REPORTS & OPTIONS
Security & Protection
Stillwater
Compare Zip Codes
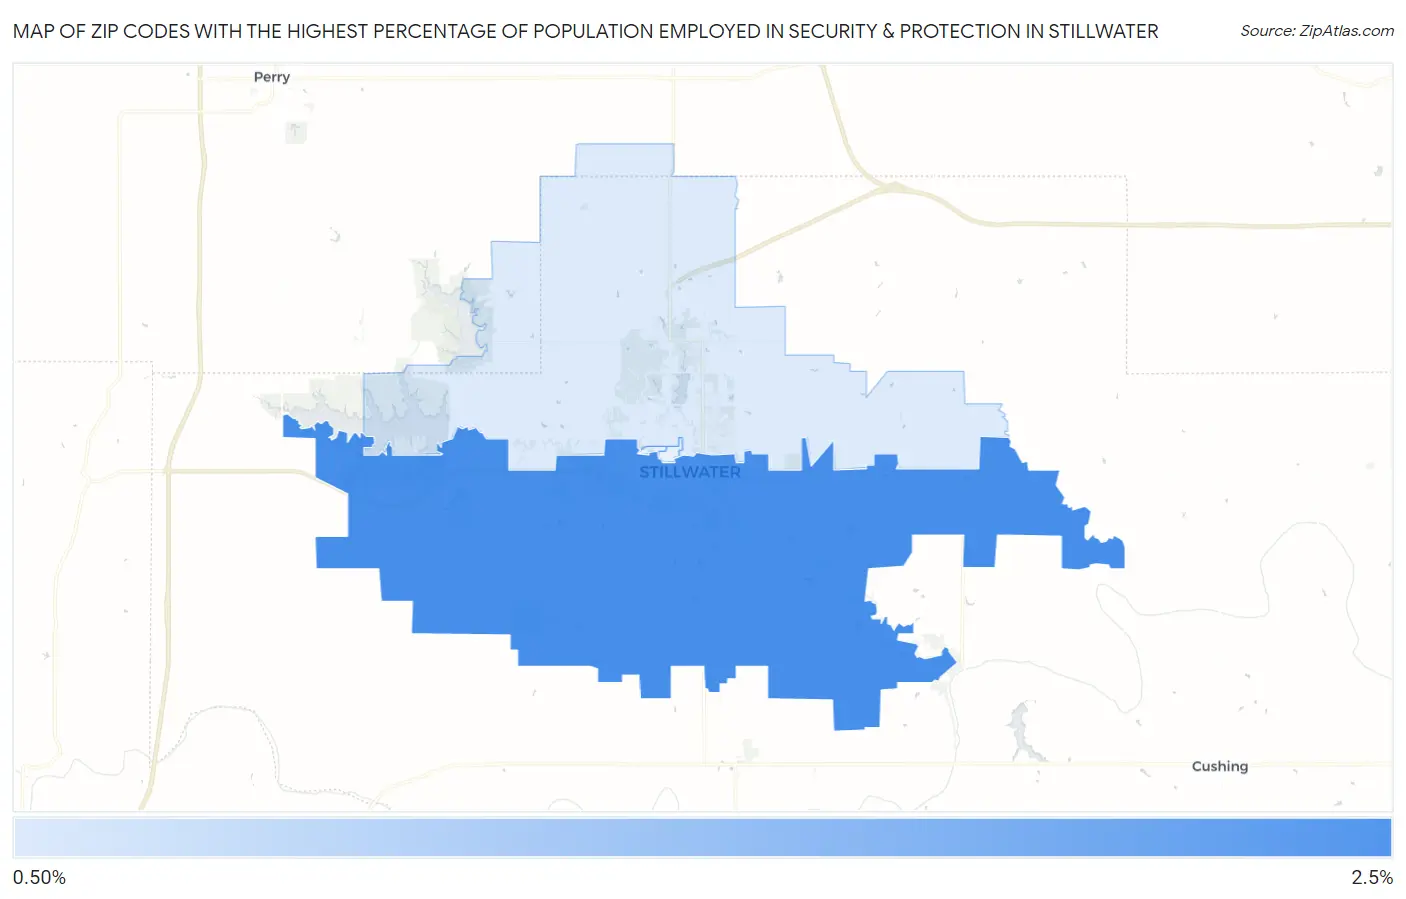
Map of Zip Codes with the Highest Percentage of Population Employed in Security & Protection in Stillwater
0.0%
2.5%
Zip Codes with the Highest Percentage of Population Employed in Security & Protection in Stillwater, OK
| Zip Code | % Employed | vs State | vs National | |
| 1. | 74074 | 2.2% | 2.0%(+0.159)#257 | 2.1%(+0.019)#11,457 |
| 2. | 74075 | 1.1% | 2.0%(-0.943)#433 | 2.1%(-1.08)#19,529 |
1
Common Questions
What are the Top 3 Zip Codes with the Highest Percentage of Population Employed in Security & Protection in Stillwater, OK?
Top 3 Zip Codes with the Highest Percentage of Population Employed in Security & Protection in Stillwater, OK are:
What zip code has the Highest Percentage of Population Employed in Security & Protection in Stillwater, OK?
74074 has the Highest Percentage of Population Employed in Security & Protection in Stillwater, OK with 2.2%.
What is the Percentage of Population Employed in Security & Protection in Stillwater, OK?
Percentage of Population Employed in Security & Protection in Stillwater is 1.6%.
What is the Percentage of Population Employed in Security & Protection in Oklahoma?
Percentage of Population Employed in Security & Protection in Oklahoma is 2.0%.
What is the Percentage of Population Employed in Security & Protection in the United States?
Percentage of Population Employed in Security & Protection in the United States is 2.1%.