Fort Coffee, OK
Fort Coffee Map
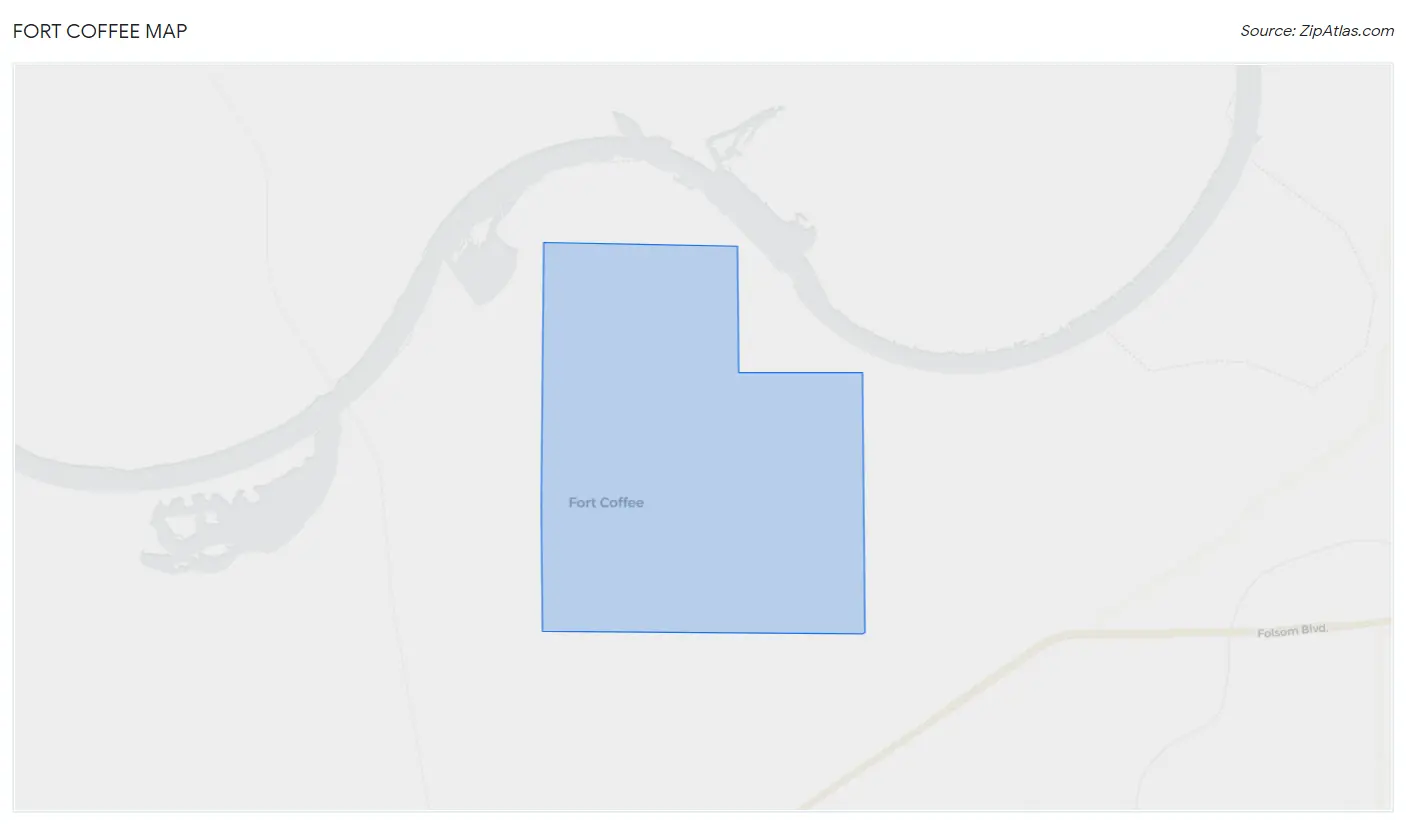
Fort Coffee Overview
381
TOTAL POPULATION
186
MALE POPULATION
195
FEMALE POPULATION
95.38
MALES / 100 FEMALES
104.84
FEMALES / 100 MALES
45.1
MEDIAN AGE
3.2
AVG FAMILY SIZE
2.3
AVG HOUSEHOLD SIZE
$25,598
PER CAPITA INCOME
$54,375
AVG FAMILY INCOME
$34,375
AVG HOUSEHOLD INCOME
0.44
INEQUALITY / GINI INDEX
137
LABOR FORCE [ PEOPLE ]
46.8%
PERCENT IN LABOR FORCE
0.7%
UNEMPLOYMENT RATE
Fort Coffee Area Codes
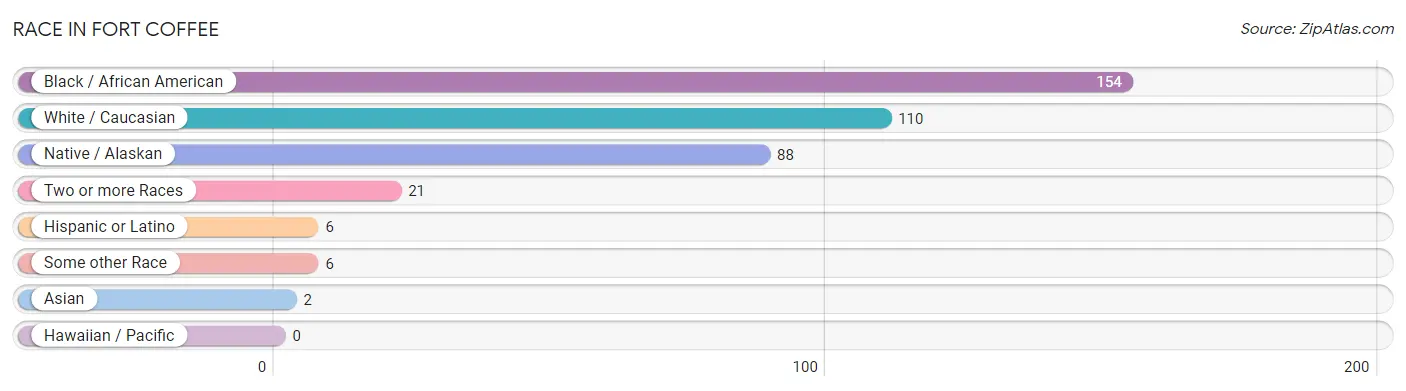
Race in Fort Coffee
The most populous races in Fort Coffee are Black / African American (154 | 40.4%), White / Caucasian (110 | 28.9%), and Native / Alaskan (88 | 23.1%).
| Race | # Population | % Population |
| Asian | 2 | 0.5% |
| Black / African American | 154 | 40.4% |
| Hawaiian / Pacific | 0 | 0.0% |
| Hispanic or Latino | 6 | 1.6% |
| Native / Alaskan | 88 | 23.1% |
| White / Caucasian | 110 | 28.9% |
| Two or more Races | 21 | 5.5% |
| Some other Race | 6 | 1.6% |
| Total | 381 | 100.0% |
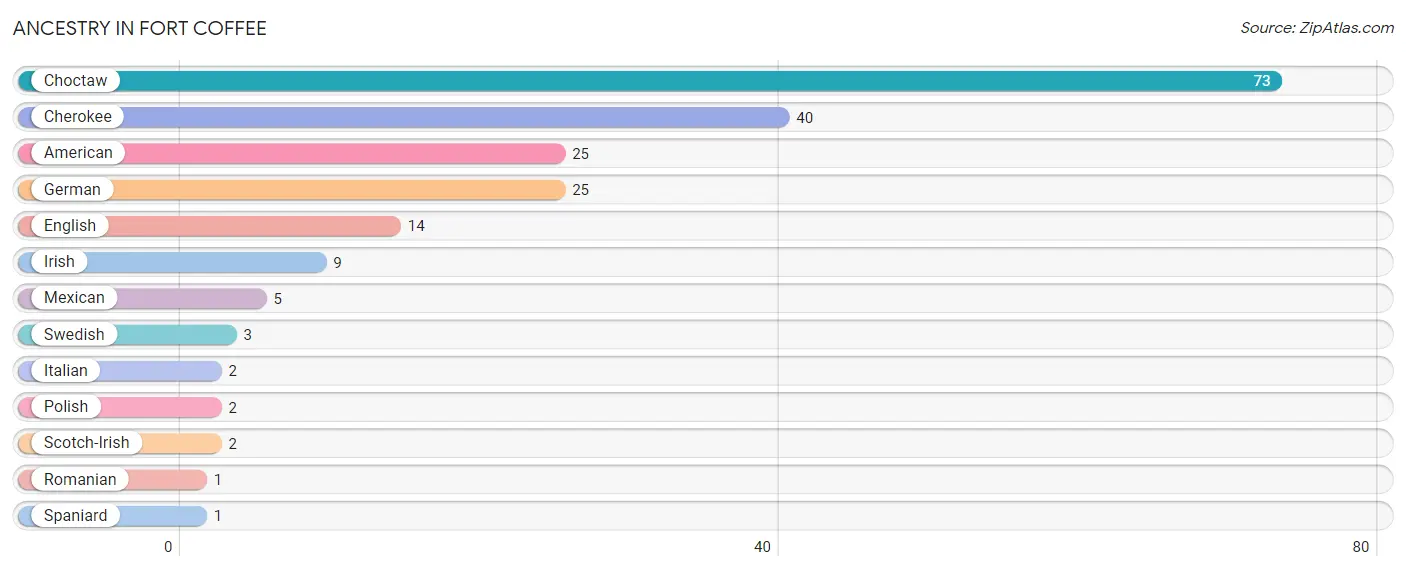
Ancestry in Fort Coffee
The most populous ancestries reported in Fort Coffee are Choctaw (73 | 19.2%), Cherokee (40 | 10.5%), American (25 | 6.6%), German (25 | 6.6%), and English (14 | 3.7%), together accounting for 46.4% of all Fort Coffee residents.
| Ancestry | # Population | % Population |
| American | 25 | 6.6% |
| Cherokee | 40 | 10.5% |
| Choctaw | 73 | 19.2% |
| English | 14 | 3.7% |
| German | 25 | 6.6% |
| Irish | 9 | 2.4% |
| Italian | 2 | 0.5% |
| Mexican | 5 | 1.3% |
| Polish | 2 | 0.5% |
| Romanian | 1 | 0.3% |
| Scotch-Irish | 2 | 0.5% |
| Spaniard | 1 | 0.3% |
| Swedish | 3 | 0.8% | View All 13 Rows |
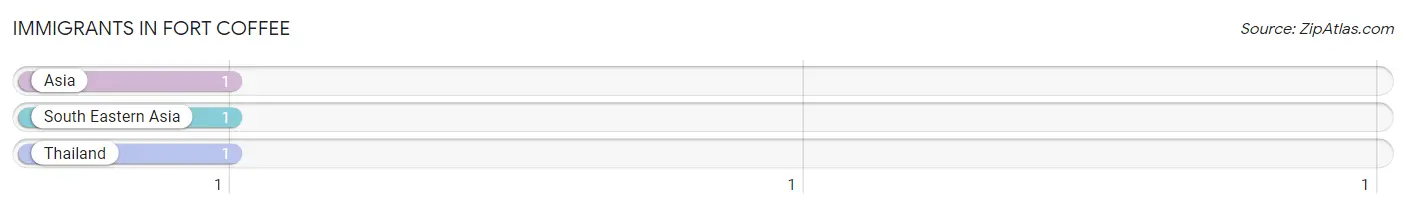
Immigrants in Fort Coffee
The most numerous immigrant groups reported in Fort Coffee came from Asia (1 | 0.3%), South Eastern Asia (1 | 0.3%), and Thailand (1 | 0.3%), together accounting for 0.8% of all Fort Coffee residents.
| Immigration Origin | # Population | % Population |
| Asia | 1 | 0.3% |
| South Eastern Asia | 1 | 0.3% |
| Thailand | 1 | 0.3% | View All 3 Rows |
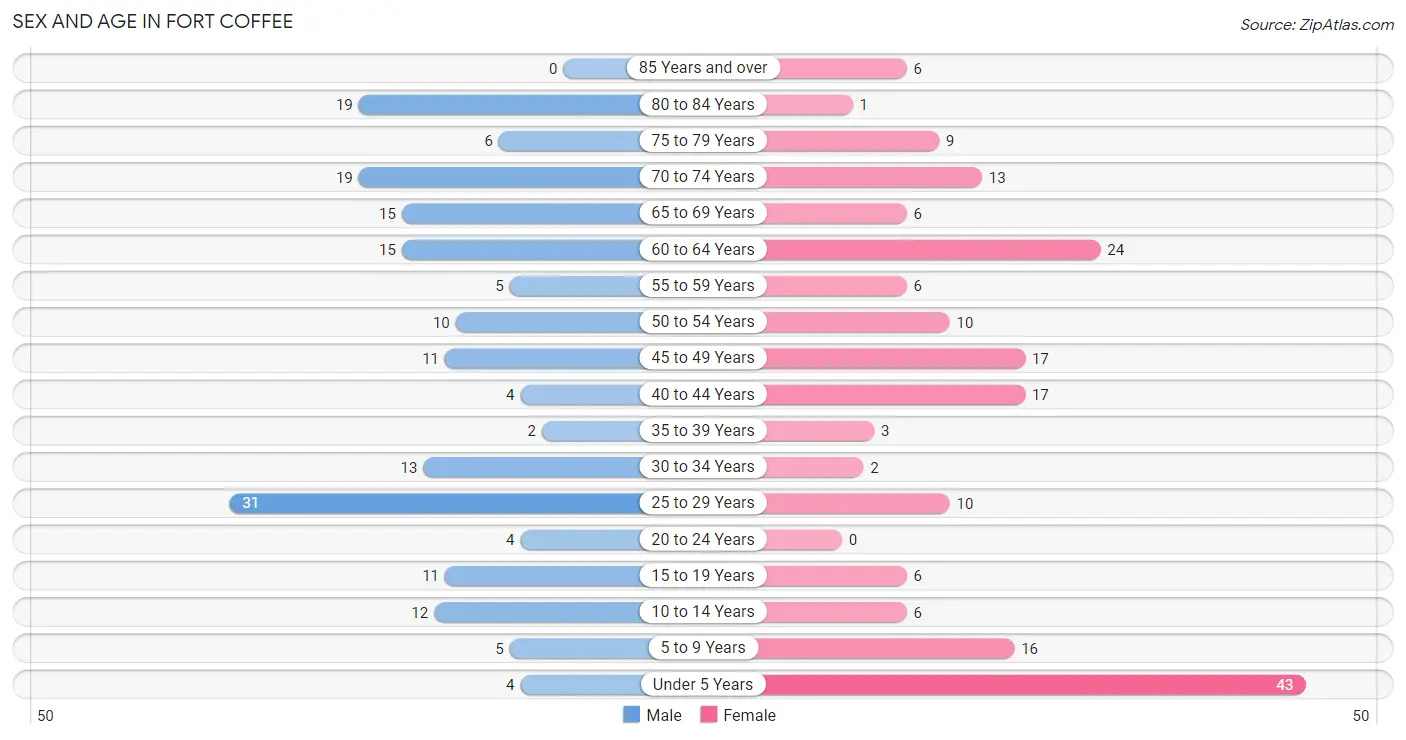
Sex and Age in Fort Coffee
Sex and Age in Fort Coffee
The most populous age groups in Fort Coffee are 25 to 29 Years (31 | 16.7%) for men and Under 5 Years (43 | 22.1%) for women.
| Age Bracket | Male | Female |
| Under 5 Years | 4 (2.1%) | 43 (22.1%) |
| 5 to 9 Years | 5 (2.7%) | 16 (8.2%) |
| 10 to 14 Years | 12 (6.5%) | 6 (3.1%) |
| 15 to 19 Years | 11 (5.9%) | 6 (3.1%) |
| 20 to 24 Years | 4 (2.1%) | 0 (0.0%) |
| 25 to 29 Years | 31 (16.7%) | 10 (5.1%) |
| 30 to 34 Years | 13 (7.0%) | 2 (1.0%) |
| 35 to 39 Years | 2 (1.1%) | 3 (1.5%) |
| 40 to 44 Years | 4 (2.1%) | 17 (8.7%) |
| 45 to 49 Years | 11 (5.9%) | 17 (8.7%) |
| 50 to 54 Years | 10 (5.4%) | 10 (5.1%) |
| 55 to 59 Years | 5 (2.7%) | 6 (3.1%) |
| 60 to 64 Years | 15 (8.1%) | 24 (12.3%) |
| 65 to 69 Years | 15 (8.1%) | 6 (3.1%) |
| 70 to 74 Years | 19 (10.2%) | 13 (6.7%) |
| 75 to 79 Years | 6 (3.2%) | 9 (4.6%) |
| 80 to 84 Years | 19 (10.2%) | 1 (0.5%) |
| 85 Years and over | 0 (0.0%) | 6 (3.1%) |
| Total | 186 (100.0%) | 195 (100.0%) |
Families and Households in Fort Coffee
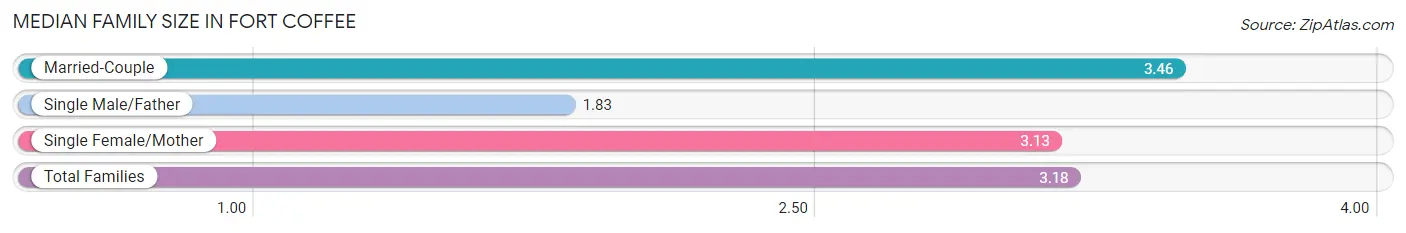
Median Family Size in Fort Coffee
The median family size in Fort Coffee is 3.18 persons per family, with married-couple families (61 | 62.9%) accounting for the largest median family size of 3.46 persons per family. On the other hand, single male/father families (12 | 12.4%) represent the smallest median family size with 1.83 persons per family.
| Family Type | # Families | Family Size |
| Married-Couple | 61 (62.9%) | 3.46 |
| Single Male/Father | 12 (12.4%) | 1.83 |
| Single Female/Mother | 24 (24.7%) | 3.13 |
| Total Families | 97 (100.0%) | 3.18 |
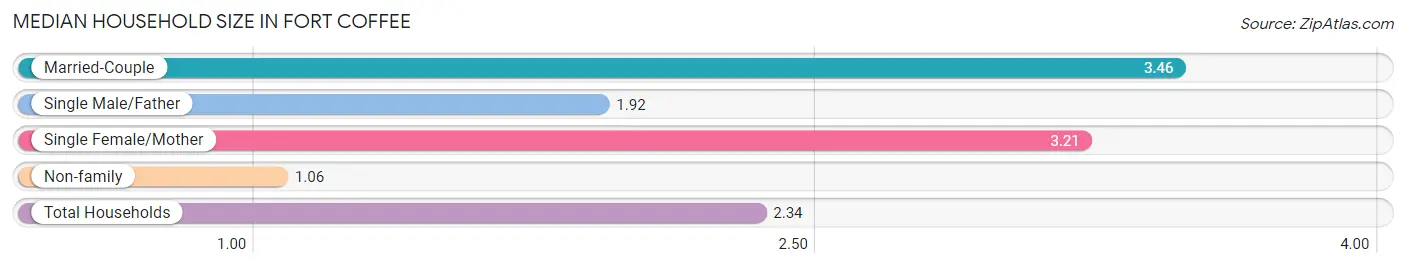
Median Household Size in Fort Coffee
The median household size in Fort Coffee is 2.34 persons per household, with married-couple households (61 | 37.4%) accounting for the largest median household size of 3.46 persons per household. non-family households (66 | 40.5%) represent the smallest median household size with 1.06 persons per household.
| Household Type | # Households | Household Size |
| Married-Couple | 61 (37.4%) | 3.46 |
| Single Male/Father | 12 (7.4%) | 1.92 |
| Single Female/Mother | 24 (14.7%) | 3.21 |
| Non-family | 66 (40.5%) | 1.06 |
| Total Households | 163 (100.0%) | 2.34 |
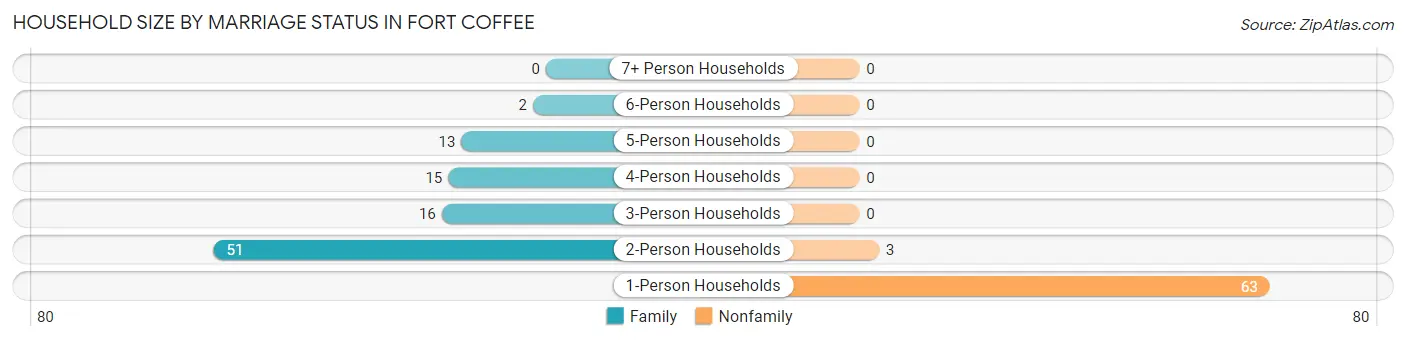
Household Size by Marriage Status in Fort Coffee
Out of a total of 163 households in Fort Coffee, 97 (59.5%) are family households, while 66 (40.5%) are nonfamily households. The most numerous type of family households are 2-person households, comprising 51, and the most common type of nonfamily households are 1-person households, comprising 63.
| Household Size | Family Households | Nonfamily Households |
| 1-Person Households | - | 63 (38.7%) |
| 2-Person Households | 51 (31.3%) | 3 (1.8%) |
| 3-Person Households | 16 (9.8%) | 0 (0.0%) |
| 4-Person Households | 15 (9.2%) | 0 (0.0%) |
| 5-Person Households | 13 (8.0%) | 0 (0.0%) |
| 6-Person Households | 2 (1.2%) | 0 (0.0%) |
| 7+ Person Households | 0 (0.0%) | 0 (0.0%) |
| Total | 97 (59.5%) | 66 (40.5%) |
Female Fertility in Fort Coffee
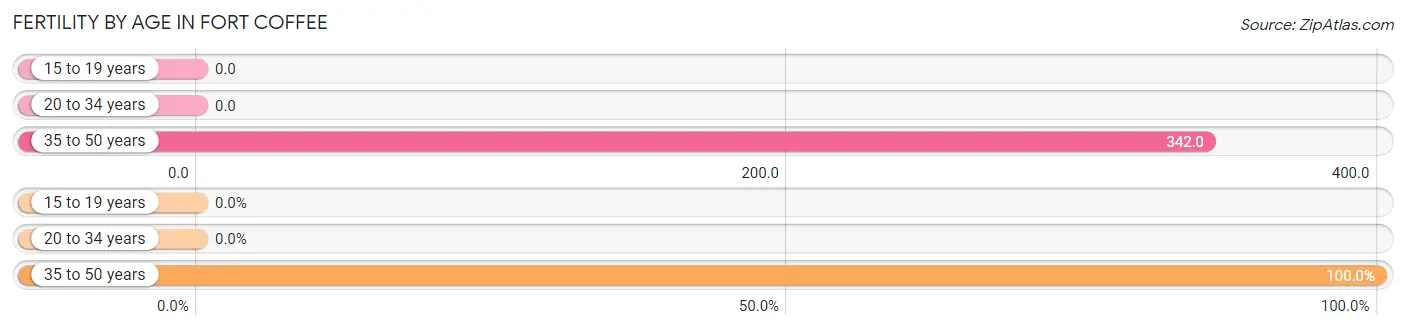
Fertility by Age in Fort Coffee
Average fertility rate in Fort Coffee is 232.0 births per 1,000 women. Women in the age bracket of 35 to 50 years have the highest fertility rate with 342.0 births per 1,000 women. Women in the age bracket of 35 to 50 years acount for 100.0% of all women with births.
| Age Bracket | Women with Births | Births / 1,000 Women |
| 15 to 19 years | 0 (0.0%) | 0.0 |
| 20 to 34 years | 0 (0.0%) | 0.0 |
| 35 to 50 years | 13 (100.0%) | 342.0 |
| Total | 13 (100.0%) | 232.0 |
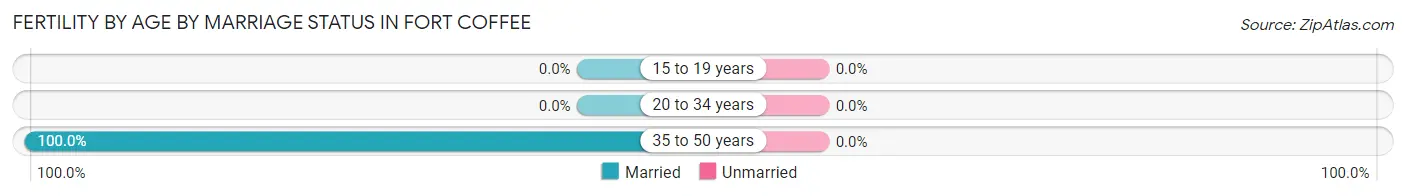
Fertility by Age by Marriage Status in Fort Coffee
| Age Bracket | Married | Unmarried |
| 15 to 19 years | 0 (0.0%) | 0 (0.0%) |
| 20 to 34 years | 0 (0.0%) | 0 (0.0%) |
| 35 to 50 years | 13 (100.0%) | 0 (0.0%) |
| Total | 13 (100.0%) | 0 (0.0%) |
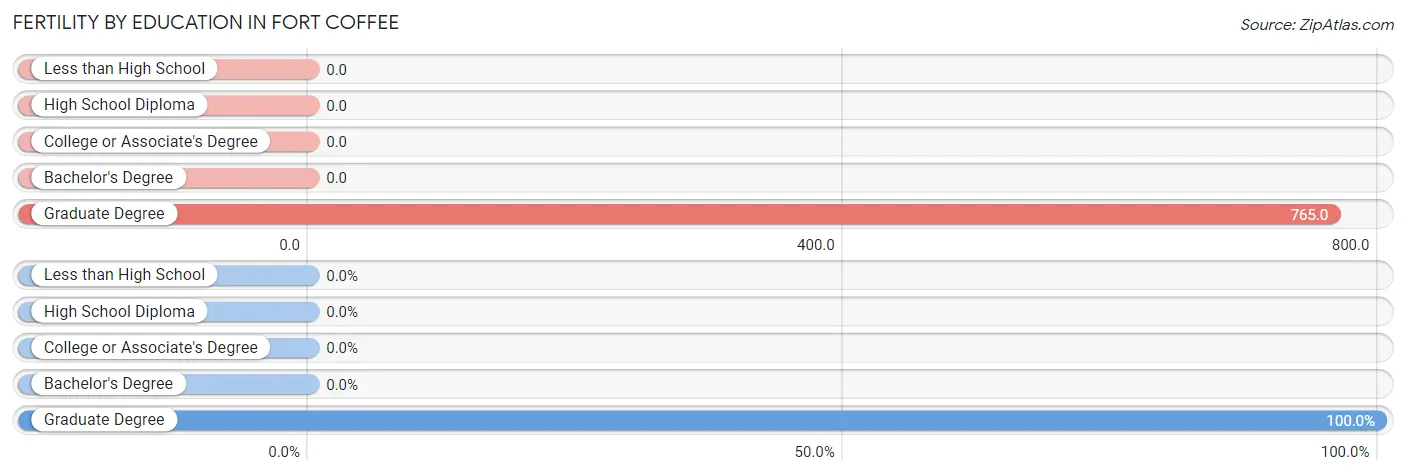
Fertility by Education in Fort Coffee
| Educational Attainment | Women with Births | Births / 1,000 Women |
| Less than High School | 0 (0.0%) | 0.0 |
| High School Diploma | 0 (0.0%) | 0.0 |
| College or Associate's Degree | 0 (0.0%) | 0.0 |
| Bachelor's Degree | 0 (0.0%) | 0.0 |
| Graduate Degree | 13 (100.0%) | 765.0 |
| Total | 13 (100.0%) | 232.0 |
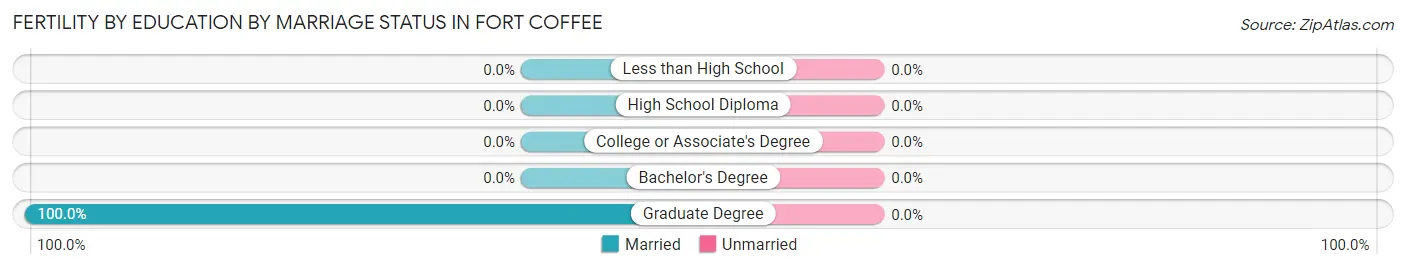
Fertility by Education by Marriage Status in Fort Coffee
| Educational Attainment | Married | Unmarried |
| Less than High School | 0 (0.0%) | 0 (0.0%) |
| High School Diploma | 0 (0.0%) | 0 (0.0%) |
| College or Associate's Degree | 0 (0.0%) | 0 (0.0%) |
| Bachelor's Degree | 0 (0.0%) | 0 (0.0%) |
| Graduate Degree | 13 (100.0%) | 0 (0.0%) |
| Total | 13 (100.0%) | 0 (0.0%) |
Income in Fort Coffee
Income Overview in Fort Coffee
Per Capita Income in Fort Coffee is $25,598, while median incomes of families and households are $54,375 and $34,375 respectively.
| Characteristic | Number | Measure |
| Per Capita Income | 381 | $25,598 |
| Median Family Income | 97 | $54,375 |
| Mean Family Income | 97 | $71,820 |
| Median Household Income | 163 | $34,375 |
| Mean Household Income | 163 | $54,525 |
| Income Deficit | 97 | $0 |
| Wage / Income Gap (%) | 381 | 0.00% |
| Wage / Income Gap ($) | 381 | 100.00¢ per $1 |
| Gini / Inequality Index | 381 | 0.44 |
Earnings by Sex in Fort Coffee
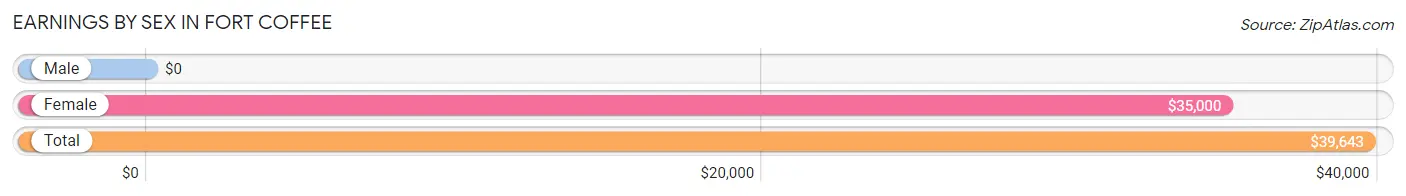
| Sex | Number | Average Earnings |
| Male | 64 (45.7%) | $0 |
| Female | 76 (54.3%) | $35,000 |
| Total | 140 (100.0%) | $39,643 |
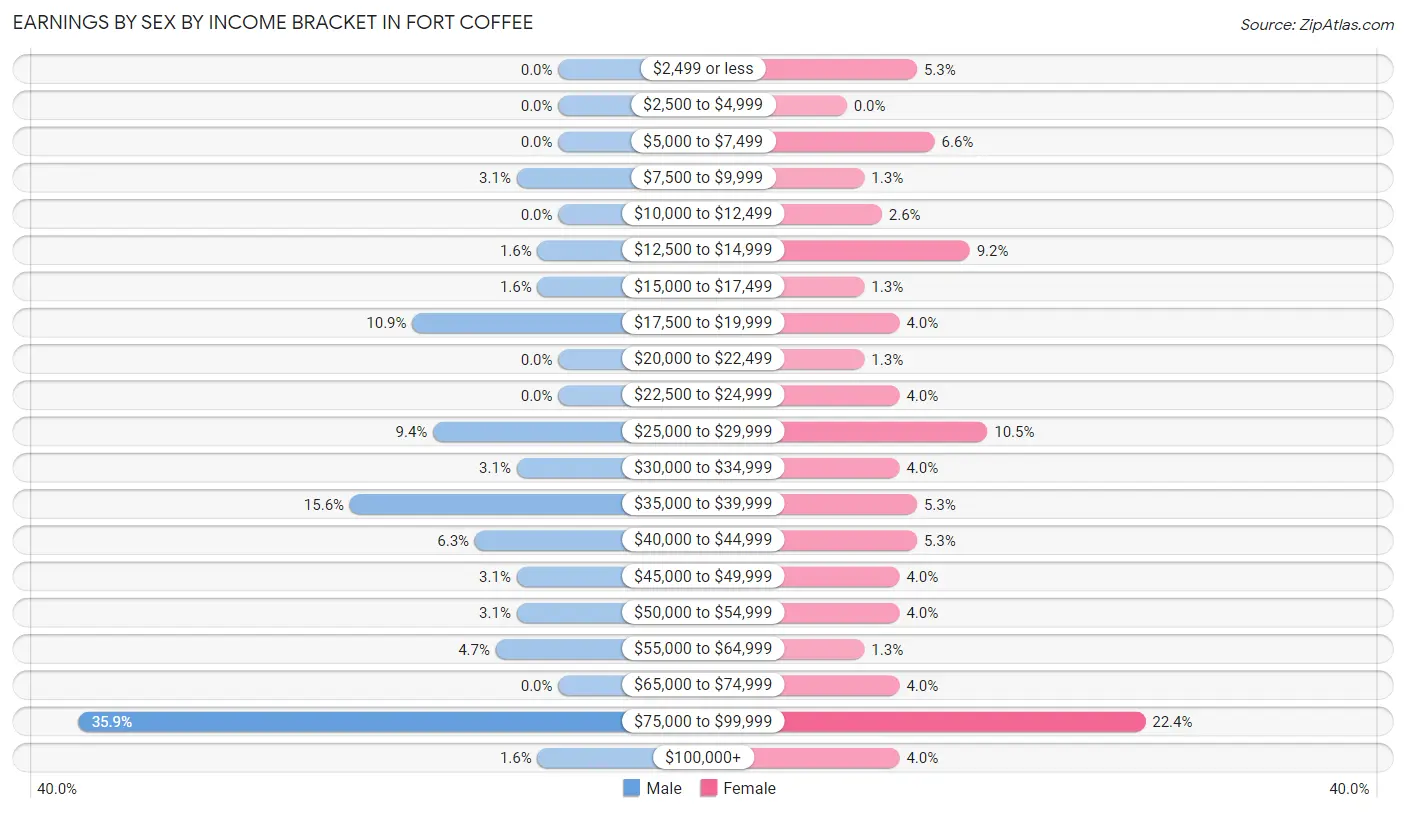
Earnings by Sex by Income Bracket in Fort Coffee
The most common earnings brackets in Fort Coffee are $75,000 to $99,999 for men (23 | 35.9%) and $75,000 to $99,999 for women (17 | 22.4%).
| Income | Male | Female |
| $2,499 or less | 0 (0.0%) | 4 (5.3%) |
| $2,500 to $4,999 | 0 (0.0%) | 0 (0.0%) |
| $5,000 to $7,499 | 0 (0.0%) | 5 (6.6%) |
| $7,500 to $9,999 | 2 (3.1%) | 1 (1.3%) |
| $10,000 to $12,499 | 0 (0.0%) | 2 (2.6%) |
| $12,500 to $14,999 | 1 (1.6%) | 7 (9.2%) |
| $15,000 to $17,499 | 1 (1.6%) | 1 (1.3%) |
| $17,500 to $19,999 | 7 (10.9%) | 3 (4.0%) |
| $20,000 to $22,499 | 0 (0.0%) | 1 (1.3%) |
| $22,500 to $24,999 | 0 (0.0%) | 3 (4.0%) |
| $25,000 to $29,999 | 6 (9.4%) | 8 (10.5%) |
| $30,000 to $34,999 | 2 (3.1%) | 3 (4.0%) |
| $35,000 to $39,999 | 10 (15.6%) | 4 (5.3%) |
| $40,000 to $44,999 | 4 (6.2%) | 4 (5.3%) |
| $45,000 to $49,999 | 2 (3.1%) | 3 (4.0%) |
| $50,000 to $54,999 | 2 (3.1%) | 3 (4.0%) |
| $55,000 to $64,999 | 3 (4.7%) | 1 (1.3%) |
| $65,000 to $74,999 | 0 (0.0%) | 3 (4.0%) |
| $75,000 to $99,999 | 23 (35.9%) | 17 (22.4%) |
| $100,000+ | 1 (1.6%) | 3 (4.0%) |
| Total | 64 (100.0%) | 76 (100.0%) |
Earnings by Sex by Educational Attainment in Fort Coffee
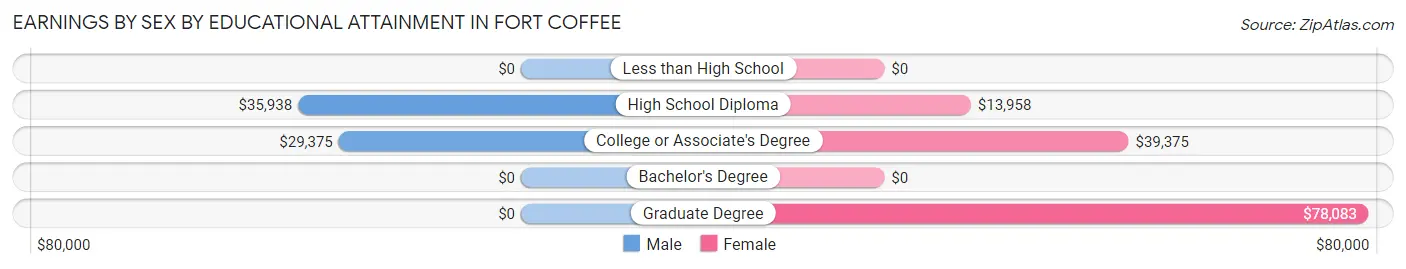
| Educational Attainment | Male Income | Female Income |
| Less than High School | - | - |
| High School Diploma | $35,938 | $13,958 |
| College or Associate's Degree | $29,375 | $39,375 |
| Bachelor's Degree | - | - |
| Graduate Degree | - | - |
| Total | - | - |
Family Income in Fort Coffee
Family Income Brackets in Fort Coffee
According to the Fort Coffee family income data, there are 18 families falling into the $150,000 to $199,999 income range, which is the most common income bracket and makes up 18.6% of all families.
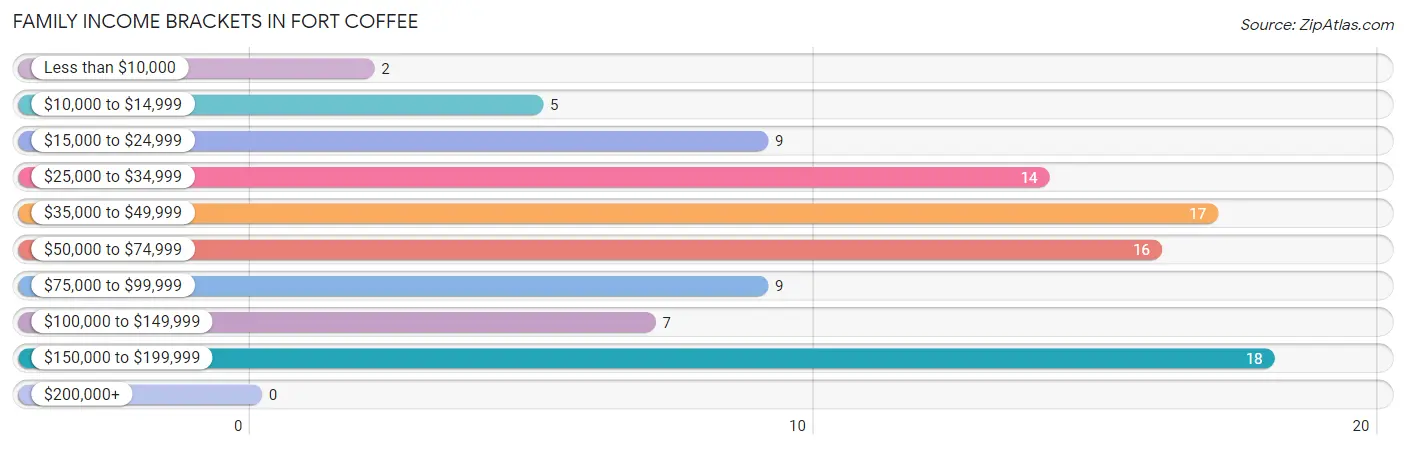
| Income Bracket | # Families | % Families |
| Less than $10,000 | 2 | 2.1% |
| $10,000 to $14,999 | 5 | 5.2% |
| $15,000 to $24,999 | 9 | 9.3% |
| $25,000 to $34,999 | 14 | 14.4% |
| $35,000 to $49,999 | 17 | 17.5% |
| $50,000 to $74,999 | 16 | 16.5% |
| $75,000 to $99,999 | 9 | 9.3% |
| $100,000 to $149,999 | 7 | 7.2% |
| $150,000 to $199,999 | 18 | 18.6% |
| $200,000+ | 0 | 0.0% |
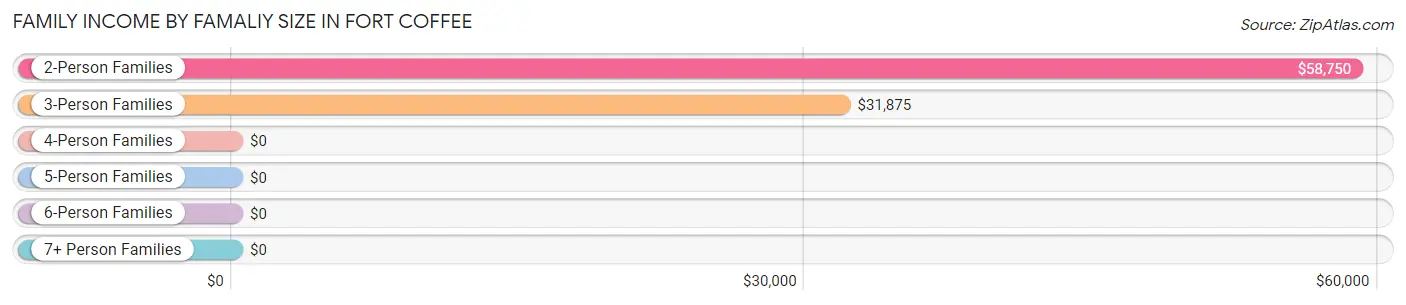
Family Income by Famaliy Size in Fort Coffee
2-person families (53 | 54.6%) account for the highest median family income in Fort Coffee with $58,750 per family, while 2-person families (53 | 54.6%) have the highest median income of $29,375 per family member.
| Income Bracket | # Families | Median Income |
| 2-Person Families | 53 (54.6%) | $58,750 |
| 3-Person Families | 15 (15.5%) | $31,875 |
| 4-Person Families | 14 (14.4%) | $0 |
| 5-Person Families | 13 (13.4%) | $0 |
| 6-Person Families | 2 (2.1%) | $0 |
| 7+ Person Families | 0 (0.0%) | $0 |
| Total | 97 (100.0%) | $54,375 |
Family Income by Number of Earners in Fort Coffee
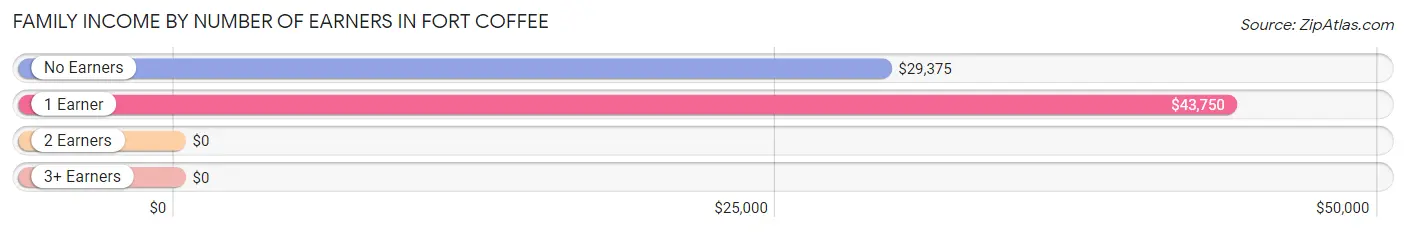
| Number of Earners | # Families | Median Income |
| No Earners | 24 (24.7%) | $29,375 |
| 1 Earner | 39 (40.2%) | $43,750 |
| 2 Earners | 33 (34.0%) | $0 |
| 3+ Earners | 1 (1.0%) | $0 |
| Total | 97 (100.0%) | $54,375 |
Household Income in Fort Coffee
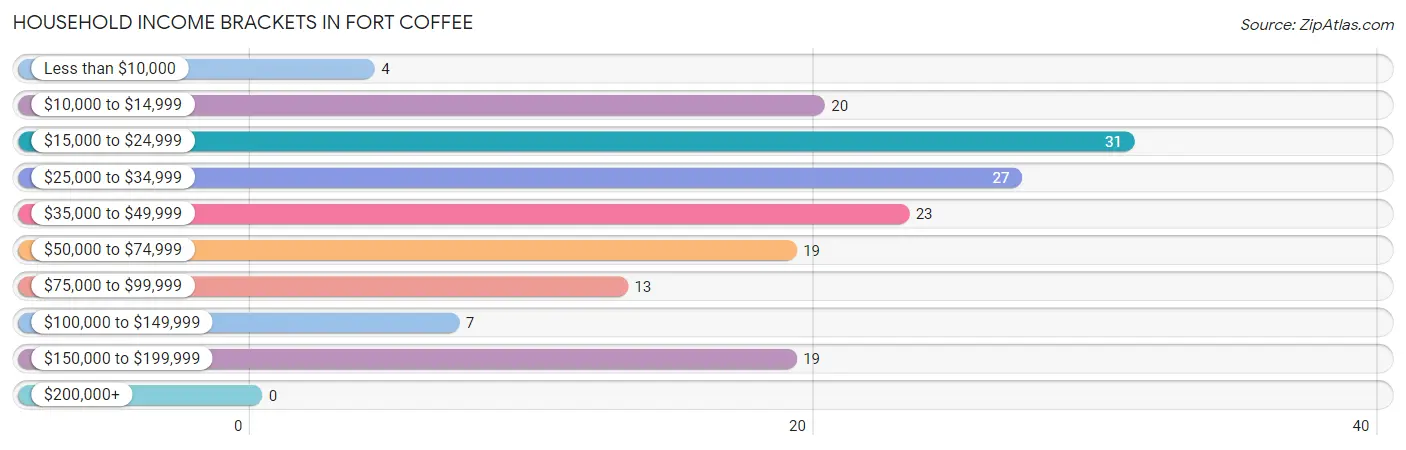
Household Income Brackets in Fort Coffee
With 31 households falling in the category, the $15,000 to $24,999 income range is the most frequent in Fort Coffee, accounting for 19.0% of all households.
| Income Bracket | # Households | % Households |
| Less than $10,000 | 4 | 2.5% |
| $10,000 to $14,999 | 20 | 12.3% |
| $15,000 to $24,999 | 31 | 19.0% |
| $25,000 to $34,999 | 27 | 16.6% |
| $35,000 to $49,999 | 23 | 14.1% |
| $50,000 to $74,999 | 19 | 11.7% |
| $75,000 to $99,999 | 13 | 8.0% |
| $100,000 to $149,999 | 7 | 4.3% |
| $150,000 to $199,999 | 19 | 11.7% |
| $200,000+ | 0 | 0.0% |
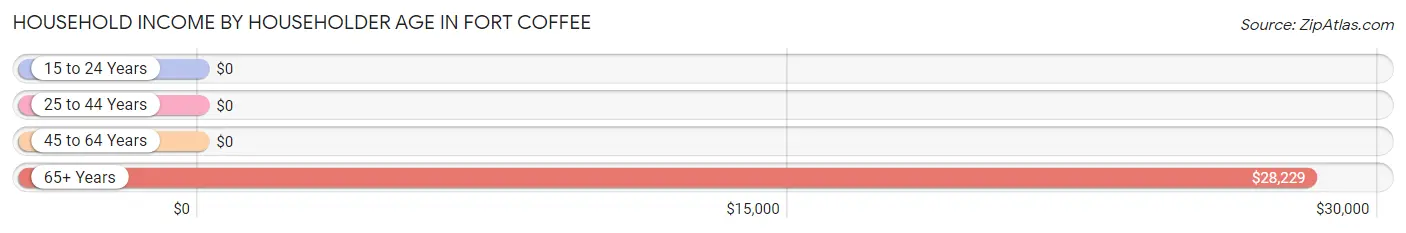
Household Income by Householder Age in Fort Coffee
The median household income in Fort Coffee is $34,375, with the highest median household income of $28,229 found in the 65+ years age bracket for the primary householder. A total of 69 households (42.3%) fall into this category. Meanwhile, the 15 to 24 years age bracket for the primary householder has the lowest median household income of $0, with 1 households (0.6%) in this group.
| Income Bracket | # Households | Median Income |
| 15 to 24 Years | 1 (0.6%) | $0 |
| 25 to 44 Years | 38 (23.3%) | $0 |
| 45 to 64 Years | 55 (33.7%) | $0 |
| 65+ Years | 69 (42.3%) | $28,229 |
| Total | 163 (100.0%) | $34,375 |
Poverty in Fort Coffee
Income Below Poverty by Sex and Age in Fort Coffee
With 14.5% poverty level for males and 19.0% for females among the residents of Fort Coffee, 16 and 17 year old males and 5 year old females are the most vulnerable to poverty, with 4 males (66.7%) and 2 females (100.0%) in their respective age groups living below the poverty level.
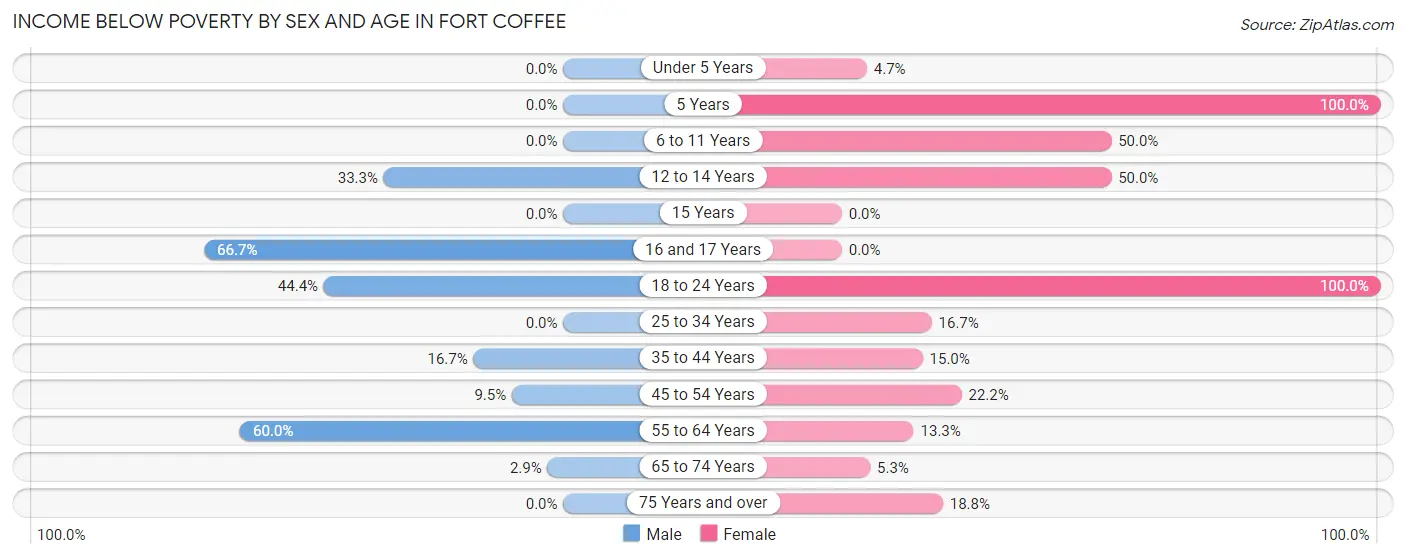
| Age Bracket | Male | Female |
| Under 5 Years | 0 (0.0%) | 2 (4.6%) |
| 5 Years | 0 (0.0%) | 2 (100.0%) |
| 6 to 11 Years | 0 (0.0%) | 8 (50.0%) |
| 12 to 14 Years | 3 (33.3%) | 2 (50.0%) |
| 15 Years | 0 (0.0%) | 0 (0.0%) |
| 16 and 17 Years | 4 (66.7%) | 0 (0.0%) |
| 18 to 24 Years | 4 (44.4%) | 4 (100.0%) |
| 25 to 34 Years | 0 (0.0%) | 2 (16.7%) |
| 35 to 44 Years | 1 (16.7%) | 3 (15.0%) |
| 45 to 54 Years | 2 (9.5%) | 6 (22.2%) |
| 55 to 64 Years | 12 (60.0%) | 4 (13.3%) |
| 65 to 74 Years | 1 (2.9%) | 1 (5.3%) |
| 75 Years and over | 0 (0.0%) | 3 (18.8%) |
| Total | 27 (14.5%) | 37 (19.0%) |
Income Above Poverty by Sex and Age in Fort Coffee
According to the poverty statistics in Fort Coffee, males aged under 5 years and females aged 15 years are the age groups that are most secure financially, with 100.0% of males and 100.0% of females in these age groups living above the poverty line.
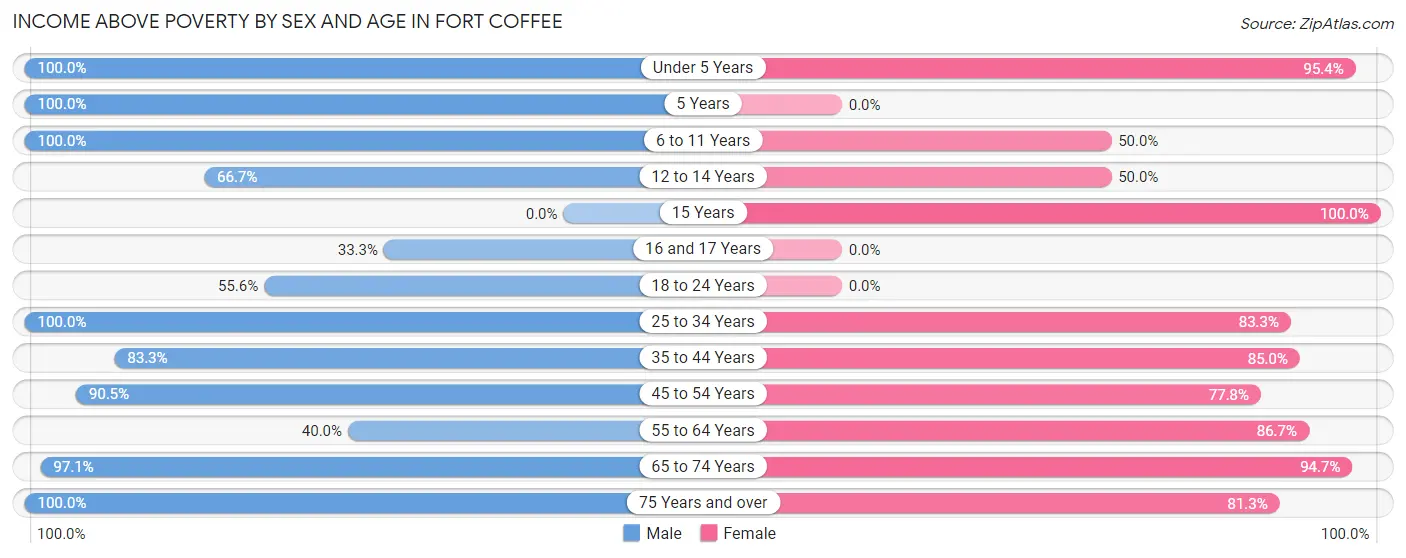
| Age Bracket | Male | Female |
| Under 5 Years | 4 (100.0%) | 41 (95.4%) |
| 5 Years | 1 (100.0%) | 0 (0.0%) |
| 6 to 11 Years | 7 (100.0%) | 8 (50.0%) |
| 12 to 14 Years | 6 (66.7%) | 2 (50.0%) |
| 15 Years | 0 (0.0%) | 2 (100.0%) |
| 16 and 17 Years | 2 (33.3%) | 0 (0.0%) |
| 18 to 24 Years | 5 (55.6%) | 0 (0.0%) |
| 25 to 34 Years | 44 (100.0%) | 10 (83.3%) |
| 35 to 44 Years | 5 (83.3%) | 17 (85.0%) |
| 45 to 54 Years | 19 (90.5%) | 21 (77.8%) |
| 55 to 64 Years | 8 (40.0%) | 26 (86.7%) |
| 65 to 74 Years | 33 (97.1%) | 18 (94.7%) |
| 75 Years and over | 25 (100.0%) | 13 (81.2%) |
| Total | 159 (85.5%) | 158 (81.0%) |
Income Below Poverty Among Married-Couple Families in Fort Coffee
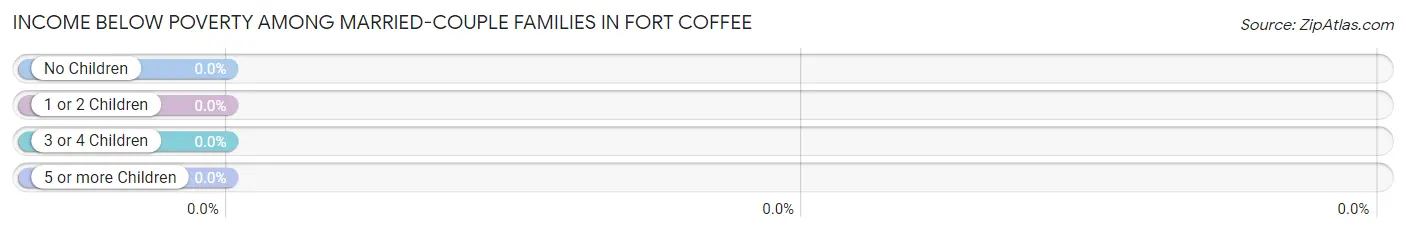
| Children | Above Poverty | Below Poverty |
| No Children | 34 (100.0%) | 0 (0.0%) |
| 1 or 2 Children | 21 (100.0%) | 0 (0.0%) |
| 3 or 4 Children | 6 (100.0%) | 0 (0.0%) |
| 5 or more Children | 0 (0.0%) | 0 (0.0%) |
| Total | 61 (100.0%) | 0 (0.0%) |
Income Below Poverty Among Single-Parent Households in Fort Coffee
According to the poverty data in Fort Coffee, 8.3% or 1 single-father households and 37.5% or 9 single-mother households are living below the poverty line. Among single-father households, those with no children have the highest poverty rate, with 1 households (9.1%) experiencing poverty. Likewise, among single-mother households, those with 3 or 4 children have the highest poverty rate, with 2 households (100.0%) falling below the poverty line.
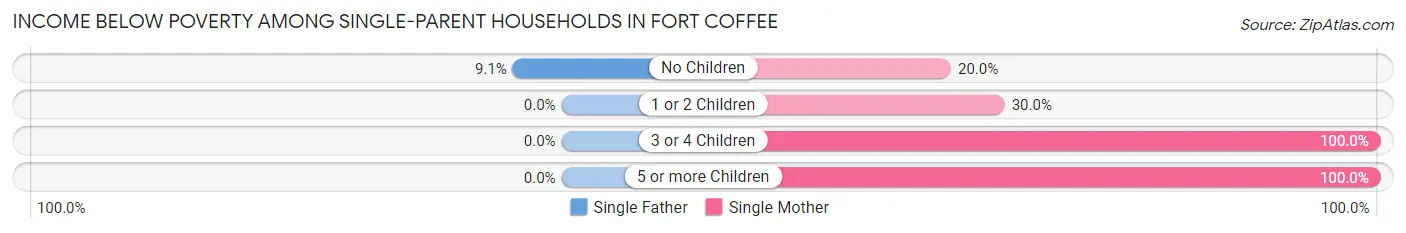
| Children | Single Father | Single Mother |
| No Children | 1 (9.1%) | 2 (20.0%) |
| 1 or 2 Children | 0 (0.0%) | 3 (30.0%) |
| 3 or 4 Children | 0 (0.0%) | 2 (100.0%) |
| 5 or more Children | 0 (0.0%) | 2 (100.0%) |
| Total | 1 (8.3%) | 9 (37.5%) |
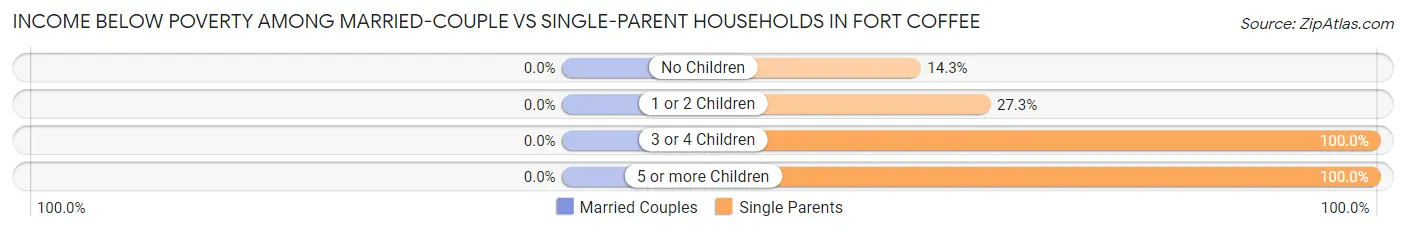
Income Below Poverty Among Married-Couple vs Single-Parent Households in Fort Coffee
| Children | Married-Couple Families | Single-Parent Households |
| No Children | 0 (0.0%) | 3 (14.3%) |
| 1 or 2 Children | 0 (0.0%) | 3 (27.3%) |
| 3 or 4 Children | 0 (0.0%) | 2 (100.0%) |
| 5 or more Children | 0 (0.0%) | 2 (100.0%) |
| Total | 0 (0.0%) | 10 (27.8%) |
Employment Characteristics in Fort Coffee
Employment by Class of Employer in Fort Coffee
Among the 135 employed individuals in Fort Coffee, private company employees (71 | 52.6%), local government employees (24 | 17.8%), and state government employees (24 | 17.8%) make up the most common classes of employment.
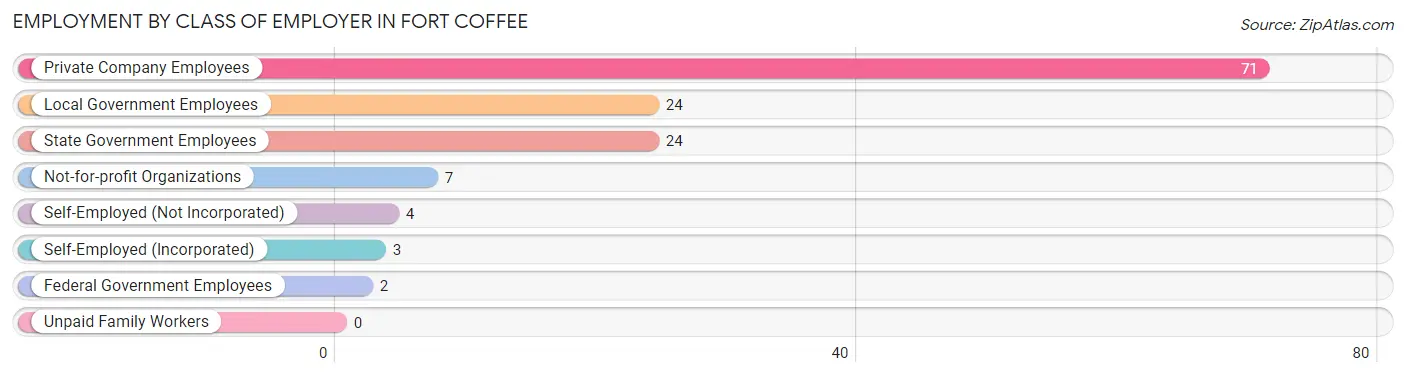
| Employer Class | # Employees | % Employees |
| Private Company Employees | 71 | 52.6% |
| Self-Employed (Incorporated) | 3 | 2.2% |
| Self-Employed (Not Incorporated) | 4 | 3.0% |
| Not-for-profit Organizations | 7 | 5.2% |
| Local Government Employees | 24 | 17.8% |
| State Government Employees | 24 | 17.8% |
| Federal Government Employees | 2 | 1.5% |
| Unpaid Family Workers | 0 | 0.0% |
| Total | 135 | 100.0% |
Employment Status by Age in Fort Coffee
According to the labor force statistics for Fort Coffee, out of the total population over 16 years of age (293), 46.8% or 137 individuals are in the labor force, with 0.7% or 1 of them unemployed. The age group with the highest labor force participation rate is 25 to 29 years, with 85.4% or 35 individuals in the labor force. Within the labor force, the 45 to 54 years age range has the highest percentage of unemployed individuals, with 3.2% or 1 of them being unemployed.
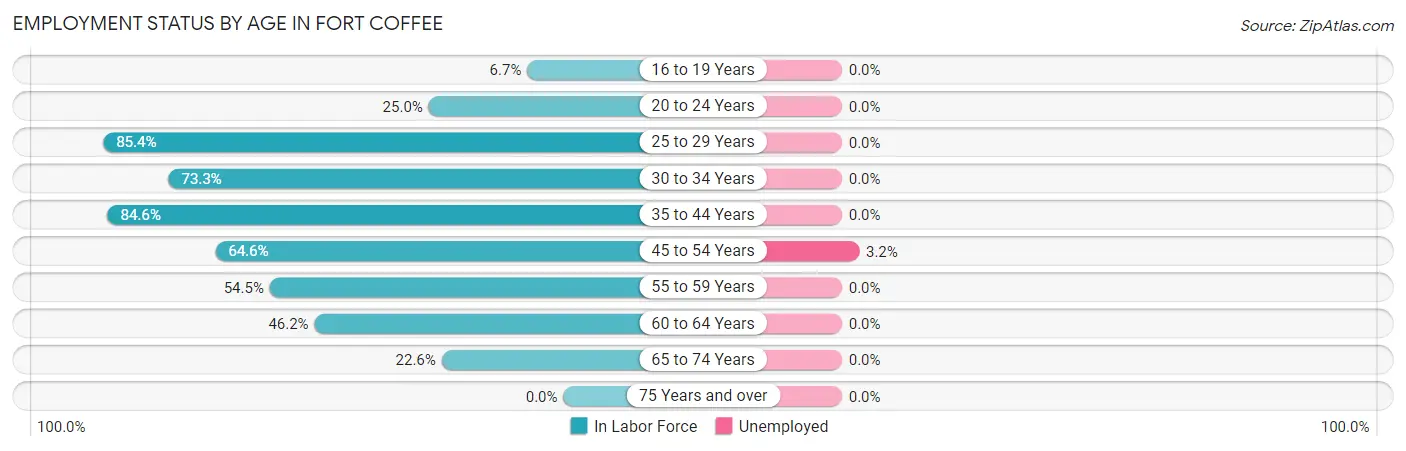
| Age Bracket | In Labor Force | Unemployed |
| 16 to 19 Years | 1 (6.7%) | 0 (0.0%) |
| 20 to 24 Years | 1 (25.0%) | 0 (0.0%) |
| 25 to 29 Years | 35 (85.4%) | 0 (0.0%) |
| 30 to 34 Years | 11 (73.3%) | 0 (0.0%) |
| 35 to 44 Years | 22 (84.6%) | 0 (0.0%) |
| 45 to 54 Years | 31 (64.6%) | 1 (3.2%) |
| 55 to 59 Years | 6 (54.5%) | 0 (0.0%) |
| 60 to 64 Years | 18 (46.2%) | 0 (0.0%) |
| 65 to 74 Years | 12 (22.6%) | 0 (0.0%) |
| 75 Years and over | 0 (0.0%) | 0 (0.0%) |
| Total | 137 (46.8%) | 1 (0.7%) |
Employment Status by Educational Attainment in Fort Coffee
According to labor force statistics for Fort Coffee, 68.3% of individuals (123) out of the total population between 25 and 64 years of age (180) are in the labor force, with 0.8% or 1 of them being unemployed. The group with the highest labor force participation rate are those with the educational attainment of bachelor's degree or higher, with 93.0% or 53 individuals in the labor force. Within the labor force, individuals with bachelor's degree or higher education have the highest percentage of unemployment, with 1.9% or 1 of them being unemployed.
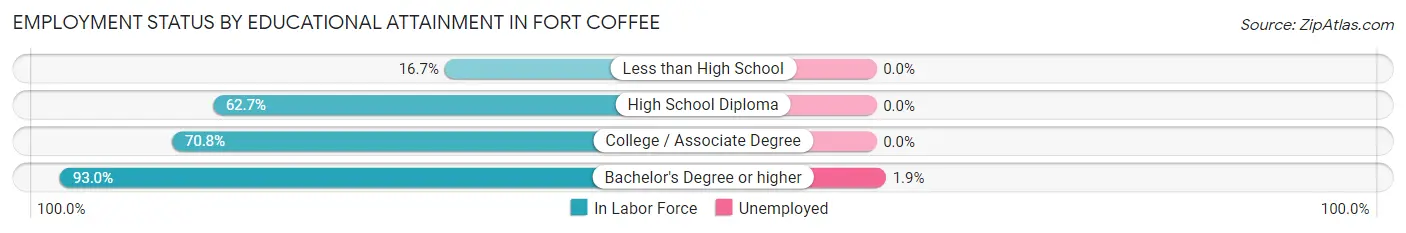
| Educational Attainment | In Labor Force | Unemployed |
| Less than High School | 4 (16.7%) | 0 (0.0%) |
| High School Diploma | 32 (62.7%) | 0 (0.0%) |
| College / Associate Degree | 34 (70.8%) | 0 (0.0%) |
| Bachelor's Degree or higher | 53 (93.0%) | 1 (1.9%) |
| Total | 123 (68.3%) | 1 (0.8%) |
Employment Occupations by Sex in Fort Coffee
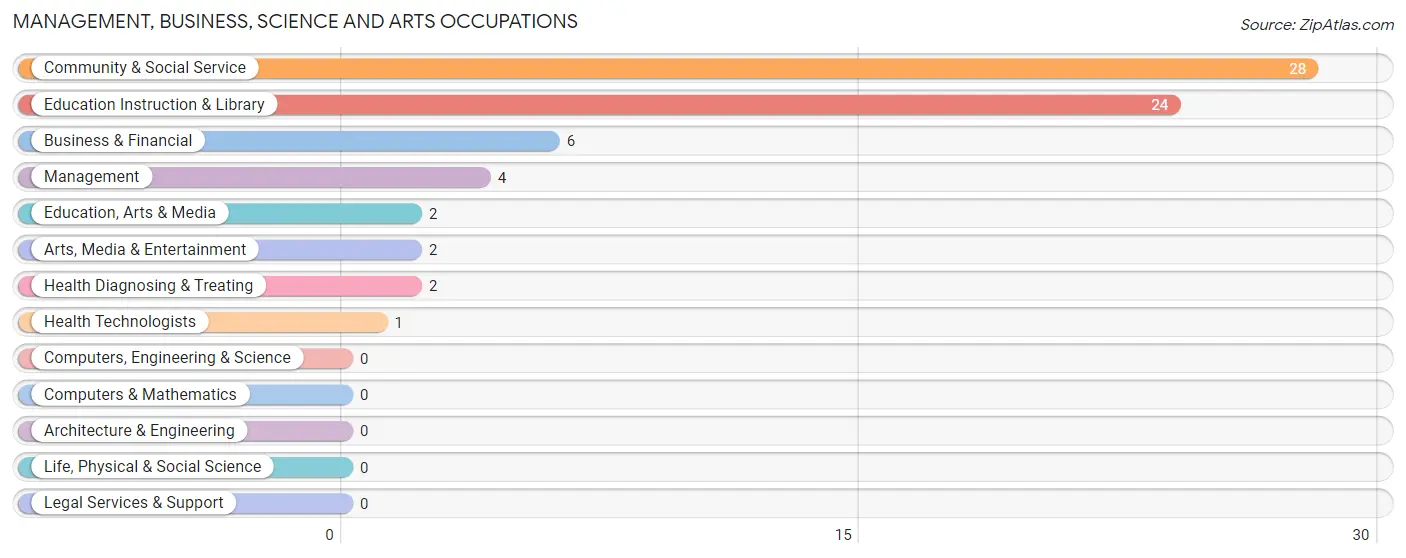
Management, Business, Science and Arts Occupations
The most common Management, Business, Science and Arts occupations in Fort Coffee are Community & Social Service (28 | 20.6%), Education Instruction & Library (24 | 17.6%), Business & Financial (6 | 4.4%), Management (4 | 2.9%), and Education, Arts & Media (2 | 1.5%).
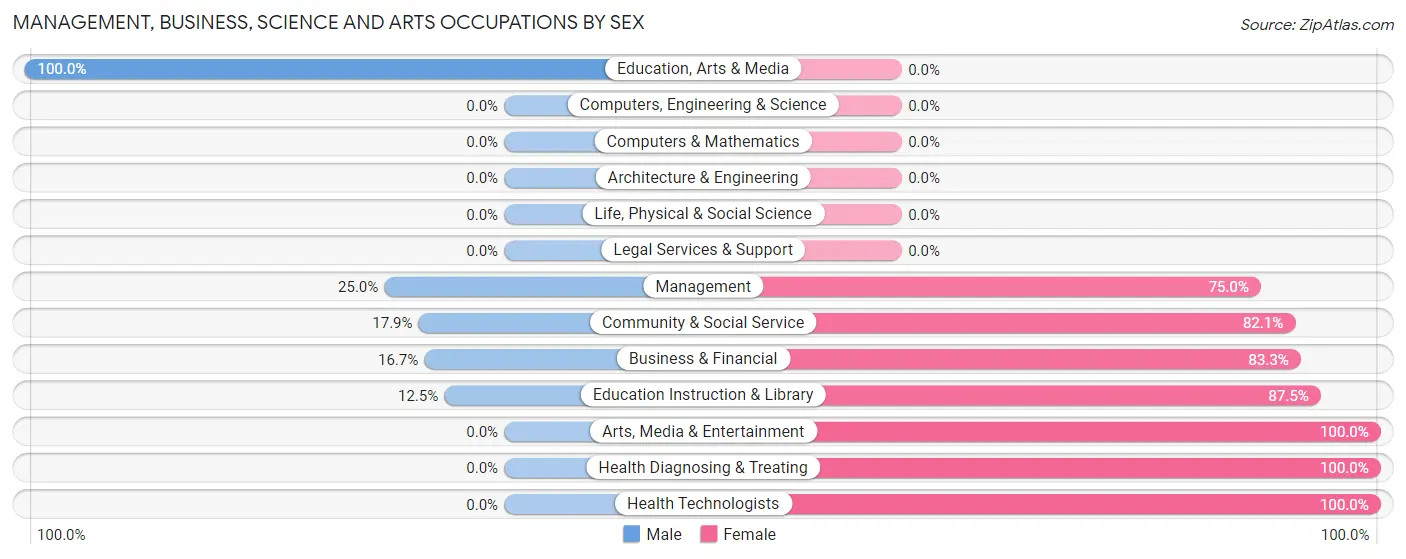
Management, Business, Science and Arts Occupations by Sex
Within the Management, Business, Science and Arts occupations in Fort Coffee, the most male-oriented occupations are Education, Arts & Media (100.0%), Management (25.0%), and Community & Social Service (17.9%), while the most female-oriented occupations are Arts, Media & Entertainment (100.0%), Health Diagnosing & Treating (100.0%), and Health Technologists (100.0%).
| Occupation | Male | Female |
| Management | 1 (25.0%) | 3 (75.0%) |
| Business & Financial | 1 (16.7%) | 5 (83.3%) |
| Computers, Engineering & Science | 0 (0.0%) | 0 (0.0%) |
| Computers & Mathematics | 0 (0.0%) | 0 (0.0%) |
| Architecture & Engineering | 0 (0.0%) | 0 (0.0%) |
| Life, Physical & Social Science | 0 (0.0%) | 0 (0.0%) |
| Community & Social Service | 5 (17.9%) | 23 (82.1%) |
| Education, Arts & Media | 2 (100.0%) | 0 (0.0%) |
| Legal Services & Support | 0 (0.0%) | 0 (0.0%) |
| Education Instruction & Library | 3 (12.5%) | 21 (87.5%) |
| Arts, Media & Entertainment | 0 (0.0%) | 2 (100.0%) |
| Health Diagnosing & Treating | 0 (0.0%) | 2 (100.0%) |
| Health Technologists | 0 (0.0%) | 1 (100.0%) |
| Total (Category) | 7 (17.5%) | 33 (82.5%) |
| Total (Overall) | 64 (47.1%) | 72 (52.9%) |
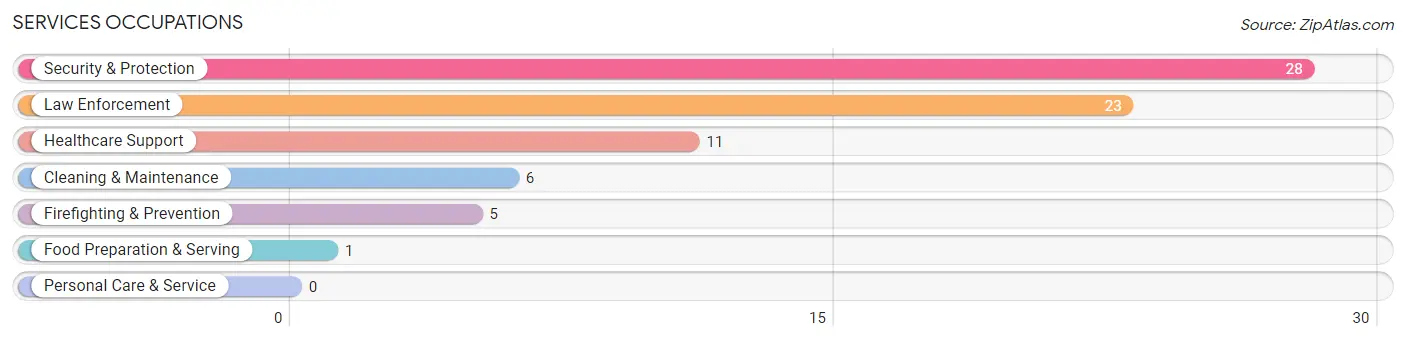
Services Occupations
The most common Services occupations in Fort Coffee are Security & Protection (28 | 20.6%), Law Enforcement (23 | 16.9%), Healthcare Support (11 | 8.1%), Cleaning & Maintenance (6 | 4.4%), and Firefighting & Prevention (5 | 3.7%).
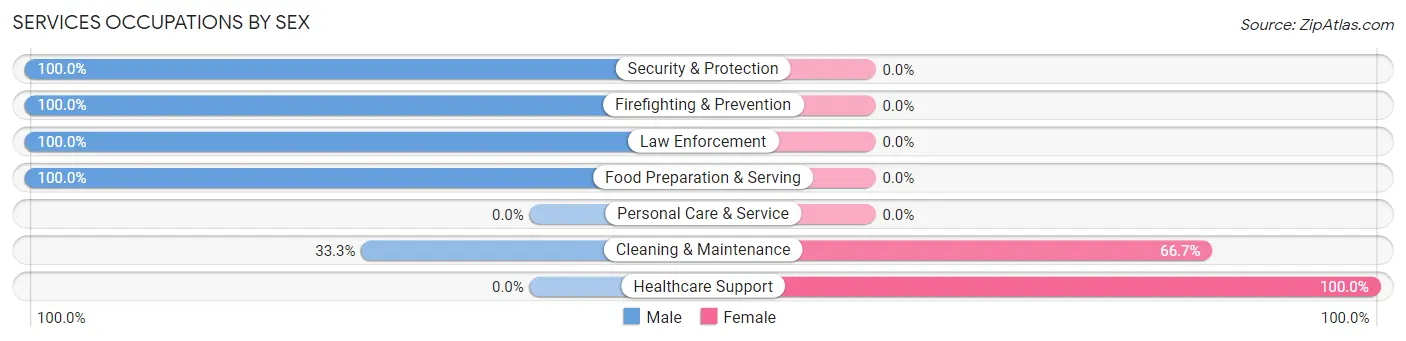
Services Occupations by Sex
Within the Services occupations in Fort Coffee, the most male-oriented occupations are Security & Protection (100.0%), Firefighting & Prevention (100.0%), and Law Enforcement (100.0%), while the most female-oriented occupations are Healthcare Support (100.0%), and Cleaning & Maintenance (66.7%).
| Occupation | Male | Female |
| Healthcare Support | 0 (0.0%) | 11 (100.0%) |
| Security & Protection | 28 (100.0%) | 0 (0.0%) |
| Firefighting & Prevention | 5 (100.0%) | 0 (0.0%) |
| Law Enforcement | 23 (100.0%) | 0 (0.0%) |
| Food Preparation & Serving | 1 (100.0%) | 0 (0.0%) |
| Cleaning & Maintenance | 2 (33.3%) | 4 (66.7%) |
| Personal Care & Service | 0 (0.0%) | 0 (0.0%) |
| Total (Category) | 31 (67.4%) | 15 (32.6%) |
| Total (Overall) | 64 (47.1%) | 72 (52.9%) |
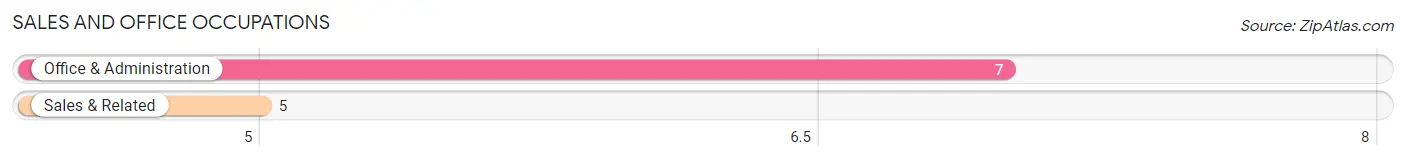
Sales and Office Occupations
The most common Sales and Office occupations in Fort Coffee are Office & Administration (7 | 5.1%), and Sales & Related (5 | 3.7%).
Sales and Office Occupations by Sex
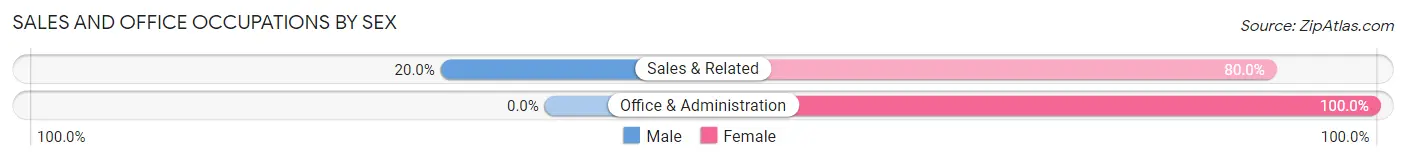
| Occupation | Male | Female |
| Sales & Related | 1 (20.0%) | 4 (80.0%) |
| Office & Administration | 0 (0.0%) | 7 (100.0%) |
| Total (Category) | 1 (8.3%) | 11 (91.7%) |
| Total (Overall) | 64 (47.1%) | 72 (52.9%) |
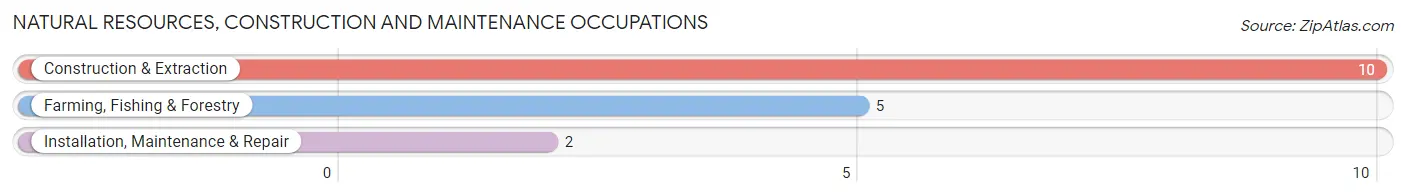
Natural Resources, Construction and Maintenance Occupations
The most common Natural Resources, Construction and Maintenance occupations in Fort Coffee are Construction & Extraction (10 | 7.3%), Farming, Fishing & Forestry (5 | 3.7%), and Installation, Maintenance & Repair (2 | 1.5%).
Natural Resources, Construction and Maintenance Occupations by Sex
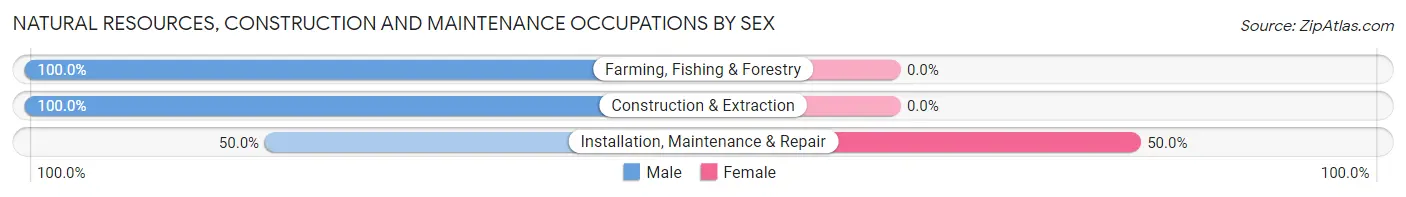
| Occupation | Male | Female |
| Farming, Fishing & Forestry | 5 (100.0%) | 0 (0.0%) |
| Construction & Extraction | 10 (100.0%) | 0 (0.0%) |
| Installation, Maintenance & Repair | 1 (50.0%) | 1 (50.0%) |
| Total (Category) | 16 (94.1%) | 1 (5.9%) |
| Total (Overall) | 64 (47.1%) | 72 (52.9%) |
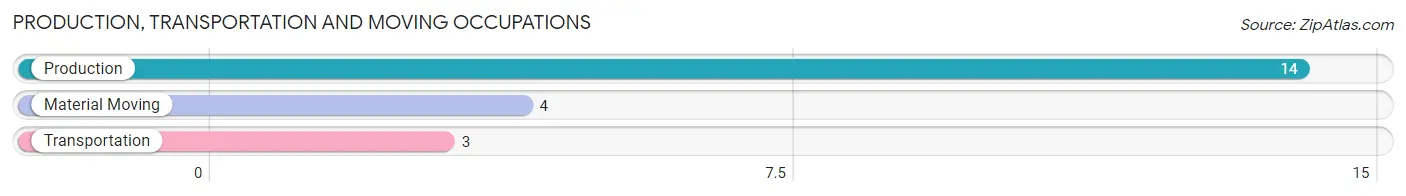
Production, Transportation and Moving Occupations
The most common Production, Transportation and Moving occupations in Fort Coffee are Production (14 | 10.3%), Material Moving (4 | 2.9%), and Transportation (3 | 2.2%).
Production, Transportation and Moving Occupations by Sex
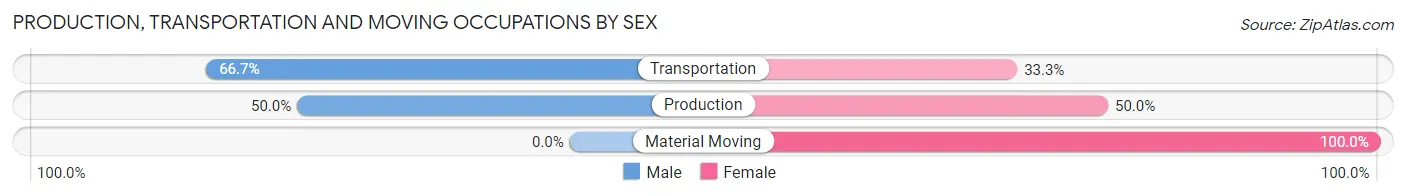
| Occupation | Male | Female |
| Production | 7 (50.0%) | 7 (50.0%) |
| Transportation | 2 (66.7%) | 1 (33.3%) |
| Material Moving | 0 (0.0%) | 4 (100.0%) |
| Total (Category) | 9 (42.9%) | 12 (57.1%) |
| Total (Overall) | 64 (47.1%) | 72 (52.9%) |
Employment Industries by Sex in Fort Coffee
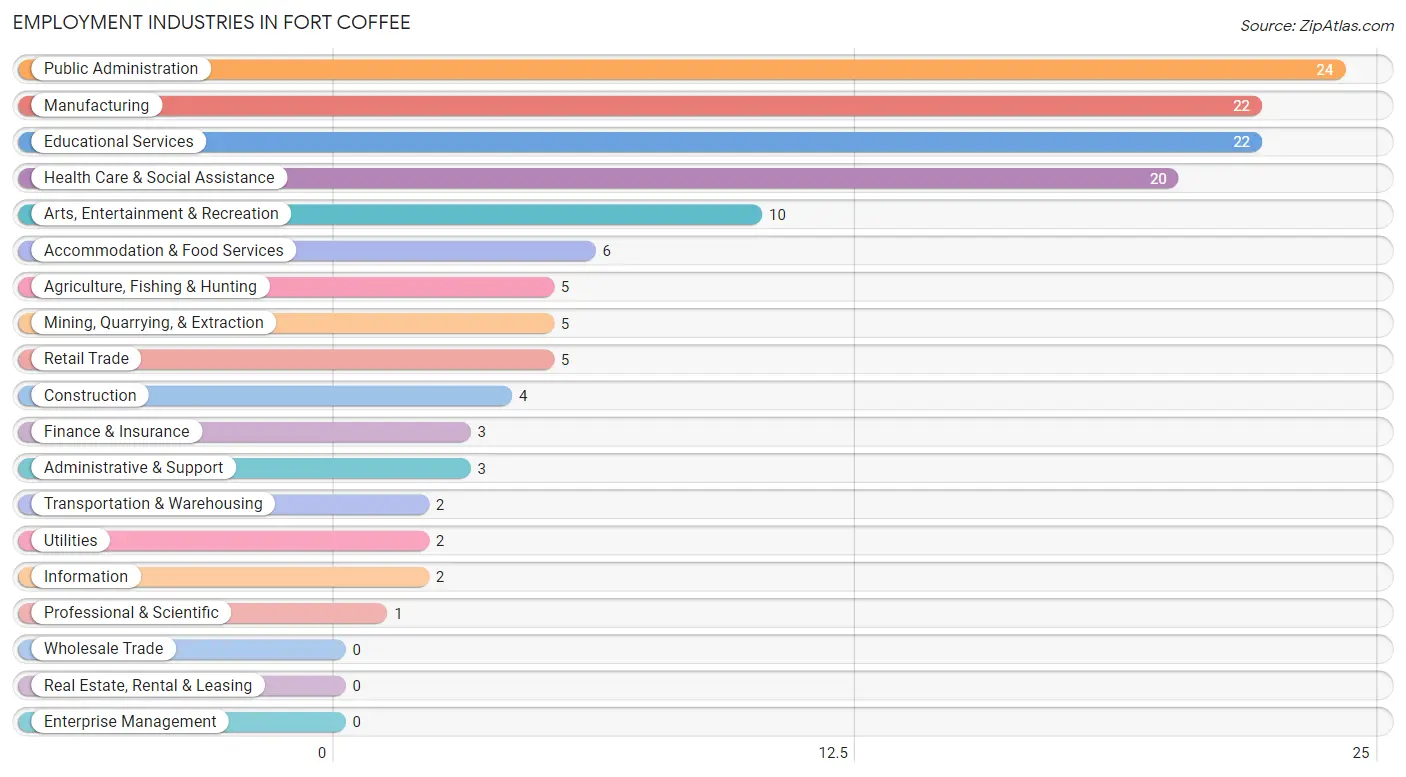
Employment Industries in Fort Coffee
The major employment industries in Fort Coffee include Public Administration (24 | 17.6%), Manufacturing (22 | 16.2%), Educational Services (22 | 16.2%), Health Care & Social Assistance (20 | 14.7%), and Arts, Entertainment & Recreation (10 | 7.3%).
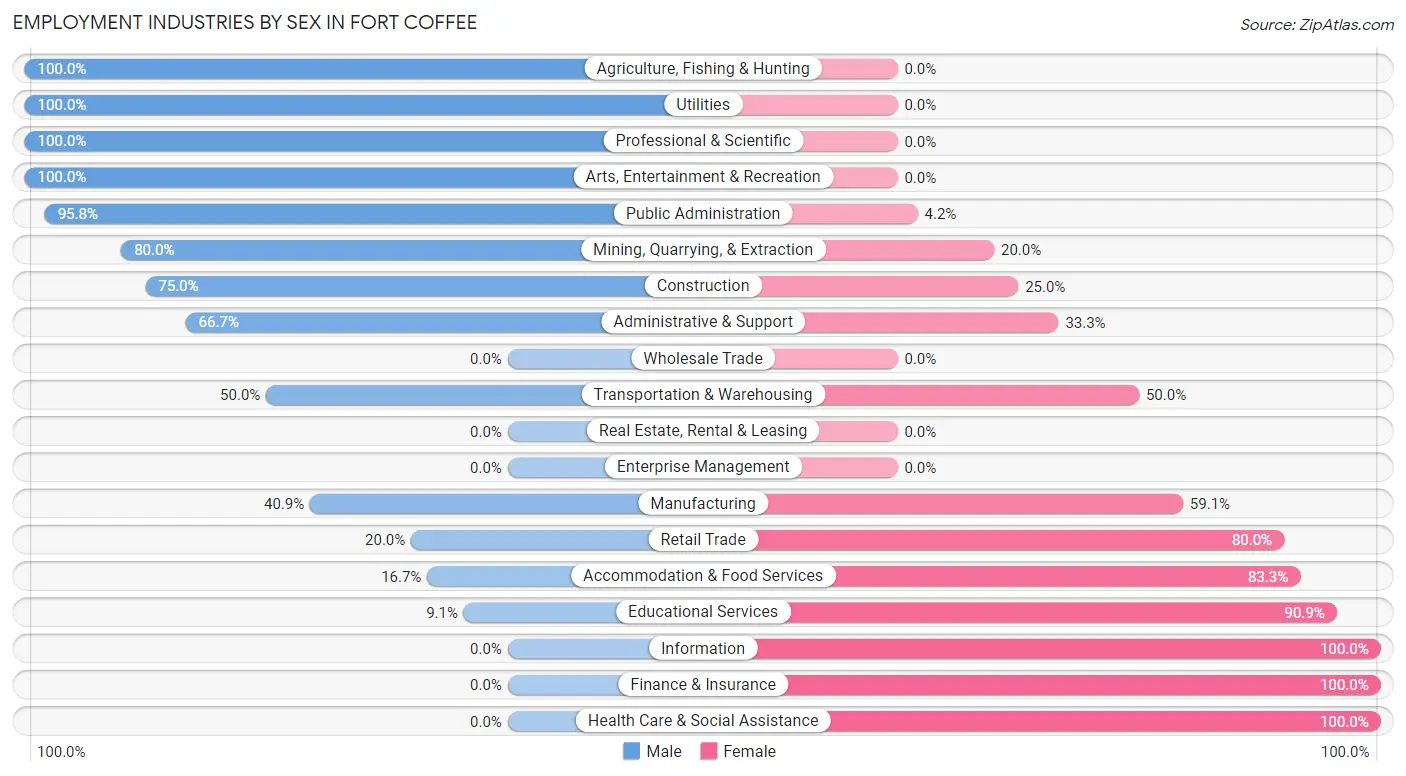
Employment Industries by Sex in Fort Coffee
The Fort Coffee industries that see more men than women are Agriculture, Fishing & Hunting (100.0%), Utilities (100.0%), and Professional & Scientific (100.0%), whereas the industries that tend to have a higher number of women are Information (100.0%), Finance & Insurance (100.0%), and Health Care & Social Assistance (100.0%).
| Industry | Male | Female |
| Agriculture, Fishing & Hunting | 5 (100.0%) | 0 (0.0%) |
| Mining, Quarrying, & Extraction | 4 (80.0%) | 1 (20.0%) |
| Construction | 3 (75.0%) | 1 (25.0%) |
| Manufacturing | 9 (40.9%) | 13 (59.1%) |
| Wholesale Trade | 0 (0.0%) | 0 (0.0%) |
| Retail Trade | 1 (20.0%) | 4 (80.0%) |
| Transportation & Warehousing | 1 (50.0%) | 1 (50.0%) |
| Utilities | 2 (100.0%) | 0 (0.0%) |
| Information | 0 (0.0%) | 2 (100.0%) |
| Finance & Insurance | 0 (0.0%) | 3 (100.0%) |
| Real Estate, Rental & Leasing | 0 (0.0%) | 0 (0.0%) |
| Professional & Scientific | 1 (100.0%) | 0 (0.0%) |
| Enterprise Management | 0 (0.0%) | 0 (0.0%) |
| Administrative & Support | 2 (66.7%) | 1 (33.3%) |
| Educational Services | 2 (9.1%) | 20 (90.9%) |
| Health Care & Social Assistance | 0 (0.0%) | 20 (100.0%) |
| Arts, Entertainment & Recreation | 10 (100.0%) | 0 (0.0%) |
| Accommodation & Food Services | 1 (16.7%) | 5 (83.3%) |
| Public Administration | 23 (95.8%) | 1 (4.2%) |
| Total | 64 (47.1%) | 72 (52.9%) |
Education in Fort Coffee
School Enrollment in Fort Coffee
The most common levels of schooling among the 55 students in Fort Coffee are elementary school (19 | 34.5%), high school (17 | 30.9%), and middle school (15 | 27.3%).
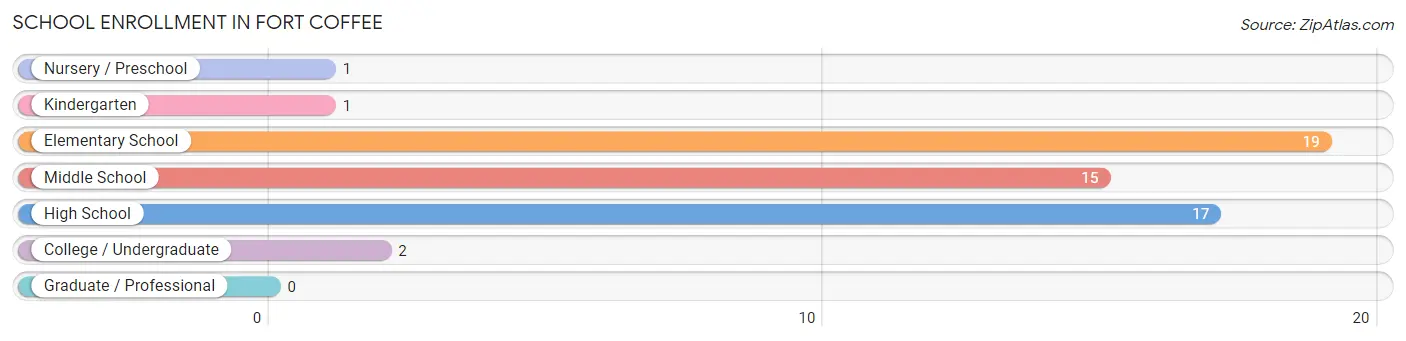
| School Level | # Students | % Students |
| Nursery / Preschool | 1 | 1.8% |
| Kindergarten | 1 | 1.8% |
| Elementary School | 19 | 34.5% |
| Middle School | 15 | 27.3% |
| High School | 17 | 30.9% |
| College / Undergraduate | 2 | 3.6% |
| Graduate / Professional | 0 | 0.0% |
| Total | 55 | 100.0% |
School Enrollment by Age by Funding Source in Fort Coffee
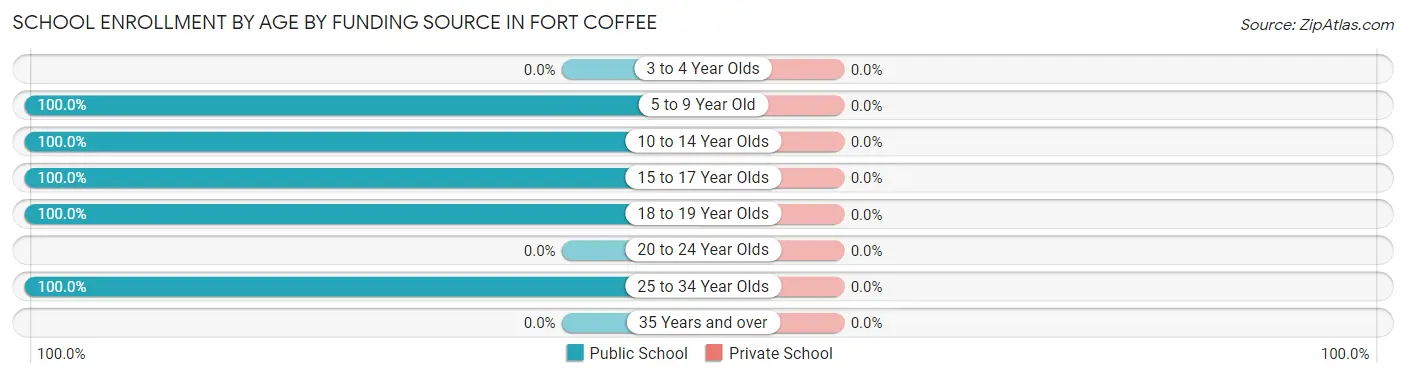
| Age Bracket | Public School | Private School |
| 3 to 4 Year Olds | 0 (0.0%) | 0 (0.0%) |
| 5 to 9 Year Old | 19 (100.0%) | 0 (0.0%) |
| 10 to 14 Year Olds | 18 (100.0%) | 0 (0.0%) |
| 15 to 17 Year Olds | 8 (100.0%) | 0 (0.0%) |
| 18 to 19 Year Olds | 8 (100.0%) | 0 (0.0%) |
| 20 to 24 Year Olds | 0 (0.0%) | 0 (0.0%) |
| 25 to 34 Year Olds | 2 (100.0%) | 0 (0.0%) |
| 35 Years and over | 0 (0.0%) | 0 (0.0%) |
| Total | 55 (100.0%) | 0 (0.0%) |
Educational Attainment by Field of Study in Fort Coffee
Science & technology (26 | 40.0%), business (18 | 27.7%), social sciences (10 | 15.4%), education (5 | 7.7%), and literature & languages (3 | 4.6%) are the most common fields of study among 65 individuals in Fort Coffee who have obtained a bachelor's degree or higher.
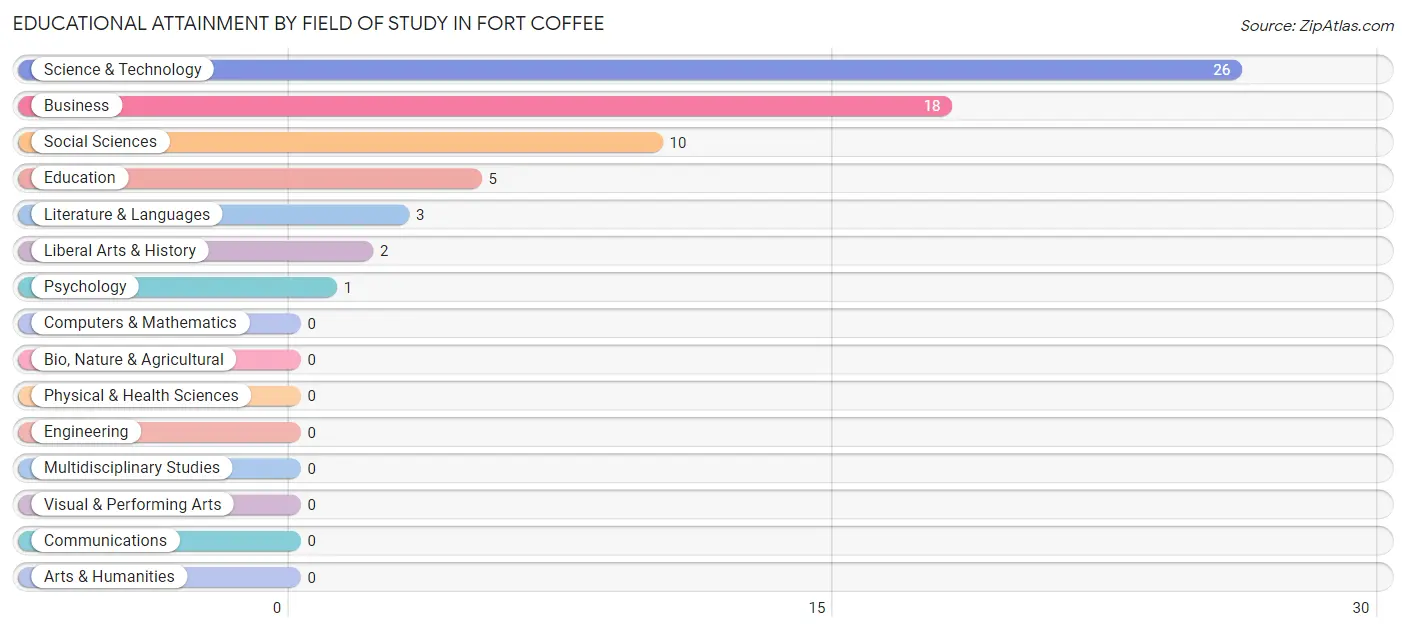
| Field of Study | # Graduates | % Graduates |
| Computers & Mathematics | 0 | 0.0% |
| Bio, Nature & Agricultural | 0 | 0.0% |
| Physical & Health Sciences | 0 | 0.0% |
| Psychology | 1 | 1.5% |
| Social Sciences | 10 | 15.4% |
| Engineering | 0 | 0.0% |
| Multidisciplinary Studies | 0 | 0.0% |
| Science & Technology | 26 | 40.0% |
| Business | 18 | 27.7% |
| Education | 5 | 7.7% |
| Literature & Languages | 3 | 4.6% |
| Liberal Arts & History | 2 | 3.1% |
| Visual & Performing Arts | 0 | 0.0% |
| Communications | 0 | 0.0% |
| Arts & Humanities | 0 | 0.0% |
| Total | 65 | 100.0% |
Transportation & Commute in Fort Coffee
Vehicle Availability by Sex in Fort Coffee
The most prevalent vehicle ownership categories in Fort Coffee are males with 3 vehicles (36, accounting for 57.1%) and females with 3 vehicles (25, making up 50.0%).
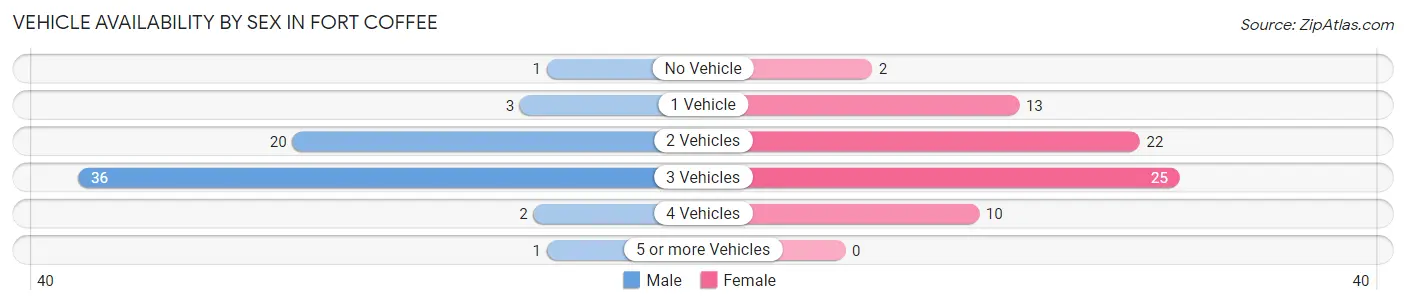
| Vehicles Available | Male | Female |
| No Vehicle | 1 (1.6%) | 2 (2.8%) |
| 1 Vehicle | 3 (4.8%) | 13 (18.1%) |
| 2 Vehicles | 20 (31.8%) | 22 (30.6%) |
| 3 Vehicles | 36 (57.1%) | 25 (34.7%) |
| 4 Vehicles | 2 (3.2%) | 10 (13.9%) |
| 5 or more Vehicles | 1 (1.6%) | 0 (0.0%) |
| Total | 63 (100.0%) | 72 (100.0%) |
Commute Time in Fort Coffee
The most frequently occuring commute durations in Fort Coffee are 30 to 34 minutes (61 commuters, 45.9%), 25 to 29 minutes (16 commuters, 12.0%), and 15 to 19 minutes (13 commuters, 9.8%).
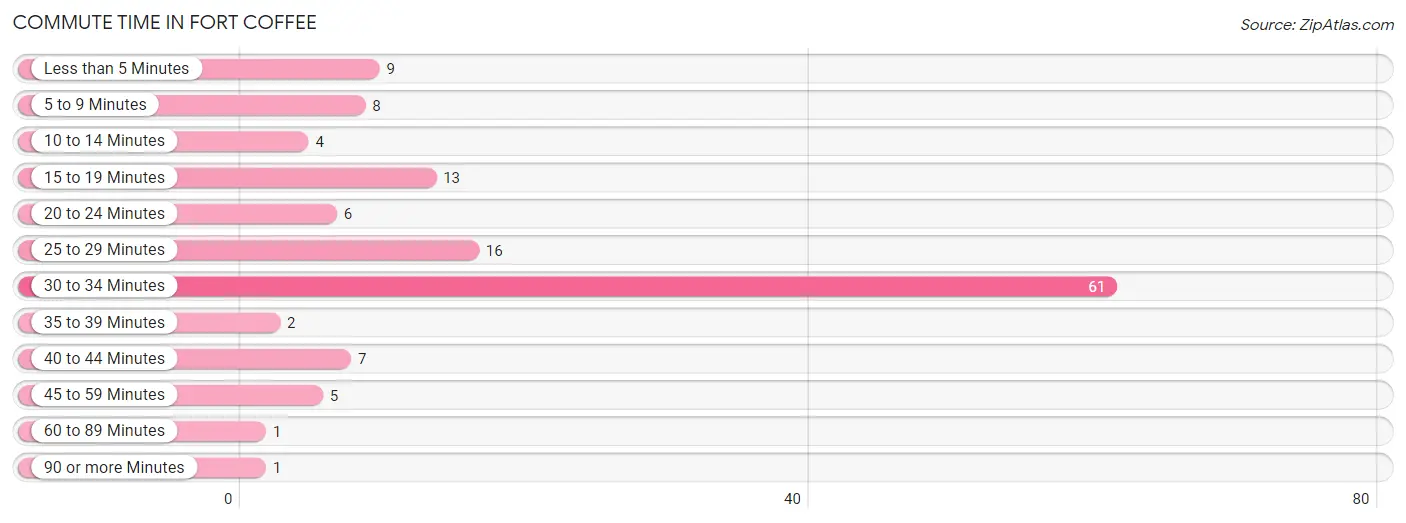
| Commute Time | # Commuters | % Commuters |
| Less than 5 Minutes | 9 | 6.8% |
| 5 to 9 Minutes | 8 | 6.0% |
| 10 to 14 Minutes | 4 | 3.0% |
| 15 to 19 Minutes | 13 | 9.8% |
| 20 to 24 Minutes | 6 | 4.5% |
| 25 to 29 Minutes | 16 | 12.0% |
| 30 to 34 Minutes | 61 | 45.9% |
| 35 to 39 Minutes | 2 | 1.5% |
| 40 to 44 Minutes | 7 | 5.3% |
| 45 to 59 Minutes | 5 | 3.8% |
| 60 to 89 Minutes | 1 | 0.7% |
| 90 or more Minutes | 1 | 0.7% |
Commute Time by Sex in Fort Coffee
The most common commute times in Fort Coffee are 30 to 34 minutes (30 commuters, 48.4%) for males and 30 to 34 minutes (31 commuters, 43.7%) for females.
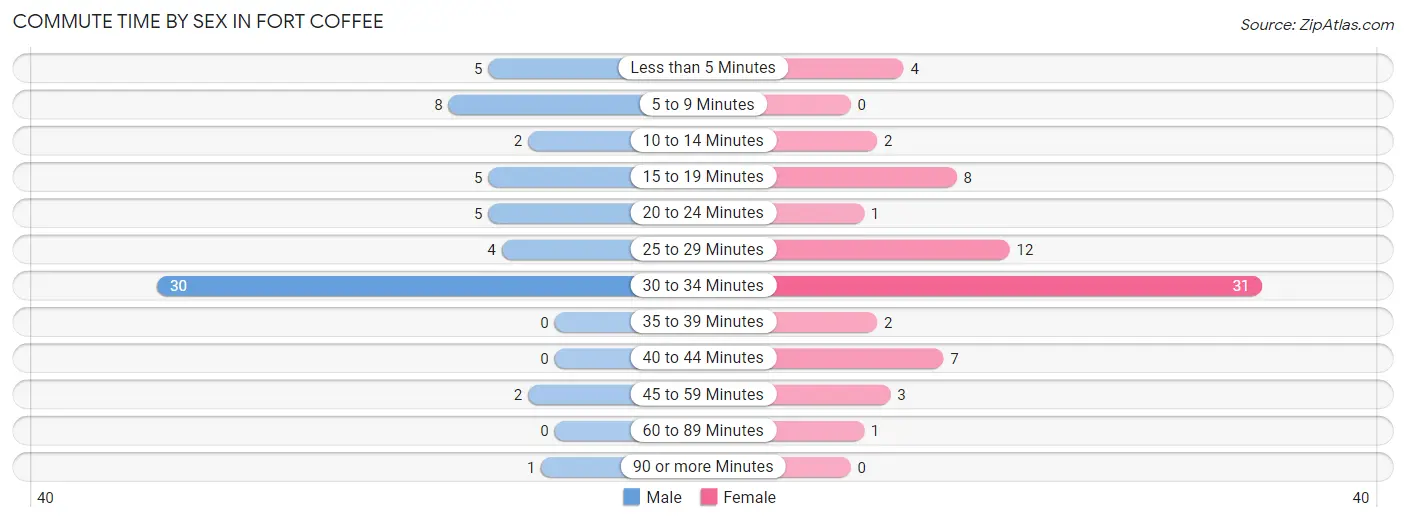
| Commute Time | Male | Female |
| Less than 5 Minutes | 5 (8.1%) | 4 (5.6%) |
| 5 to 9 Minutes | 8 (12.9%) | 0 (0.0%) |
| 10 to 14 Minutes | 2 (3.2%) | 2 (2.8%) |
| 15 to 19 Minutes | 5 (8.1%) | 8 (11.3%) |
| 20 to 24 Minutes | 5 (8.1%) | 1 (1.4%) |
| 25 to 29 Minutes | 4 (6.5%) | 12 (16.9%) |
| 30 to 34 Minutes | 30 (48.4%) | 31 (43.7%) |
| 35 to 39 Minutes | 0 (0.0%) | 2 (2.8%) |
| 40 to 44 Minutes | 0 (0.0%) | 7 (9.9%) |
| 45 to 59 Minutes | 2 (3.2%) | 3 (4.2%) |
| 60 to 89 Minutes | 0 (0.0%) | 1 (1.4%) |
| 90 or more Minutes | 1 (1.6%) | 0 (0.0%) |
Time of Departure to Work by Sex in Fort Coffee
The most frequent times of departure to work in Fort Coffee are 8:00 AM to 8:29 AM (24, 38.7%) for males and 6:30 AM to 6:59 AM (24, 33.8%) for females.
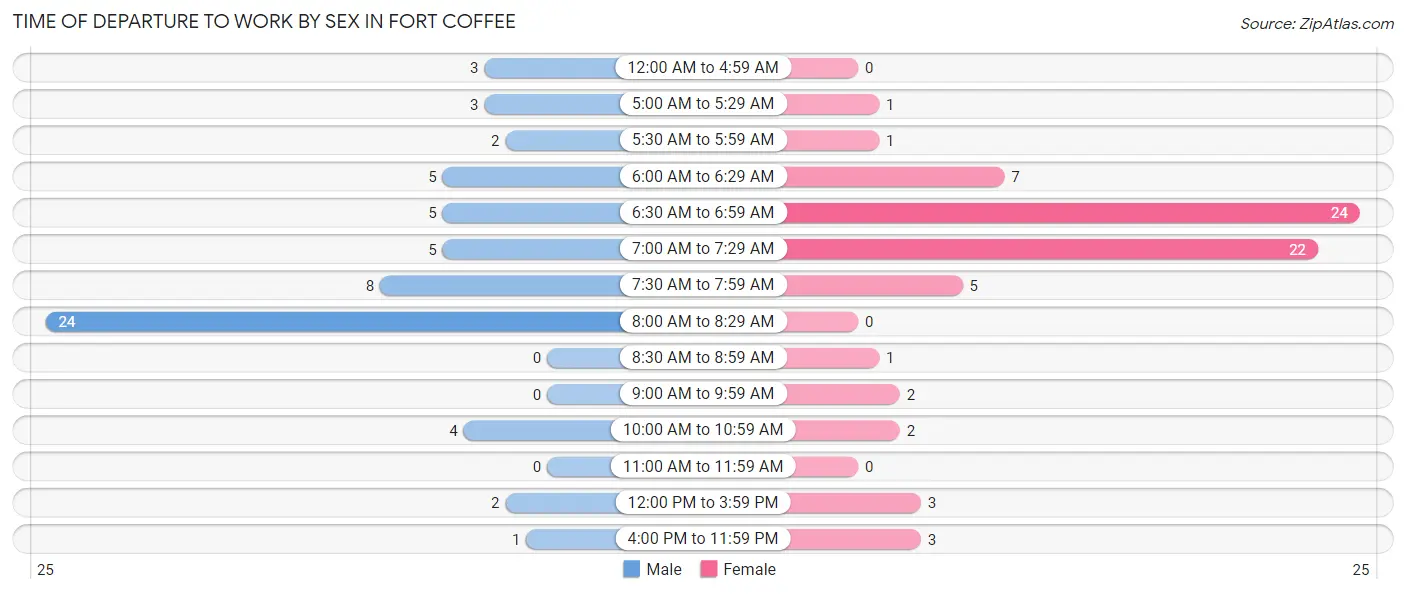
| Time of Departure | Male | Female |
| 12:00 AM to 4:59 AM | 3 (4.8%) | 0 (0.0%) |
| 5:00 AM to 5:29 AM | 3 (4.8%) | 1 (1.4%) |
| 5:30 AM to 5:59 AM | 2 (3.2%) | 1 (1.4%) |
| 6:00 AM to 6:29 AM | 5 (8.1%) | 7 (9.9%) |
| 6:30 AM to 6:59 AM | 5 (8.1%) | 24 (33.8%) |
| 7:00 AM to 7:29 AM | 5 (8.1%) | 22 (31.0%) |
| 7:30 AM to 7:59 AM | 8 (12.9%) | 5 (7.0%) |
| 8:00 AM to 8:29 AM | 24 (38.7%) | 0 (0.0%) |
| 8:30 AM to 8:59 AM | 0 (0.0%) | 1 (1.4%) |
| 9:00 AM to 9:59 AM | 0 (0.0%) | 2 (2.8%) |
| 10:00 AM to 10:59 AM | 4 (6.5%) | 2 (2.8%) |
| 11:00 AM to 11:59 AM | 0 (0.0%) | 0 (0.0%) |
| 12:00 PM to 3:59 PM | 2 (3.2%) | 3 (4.2%) |
| 4:00 PM to 11:59 PM | 1 (1.6%) | 3 (4.2%) |
| Total | 62 (100.0%) | 71 (100.0%) |
Housing Occupancy in Fort Coffee
Occupancy by Ownership in Fort Coffee
Of the total 163 dwellings in Fort Coffee, owner-occupied units account for 129 (79.1%), while renter-occupied units make up 34 (20.9%).
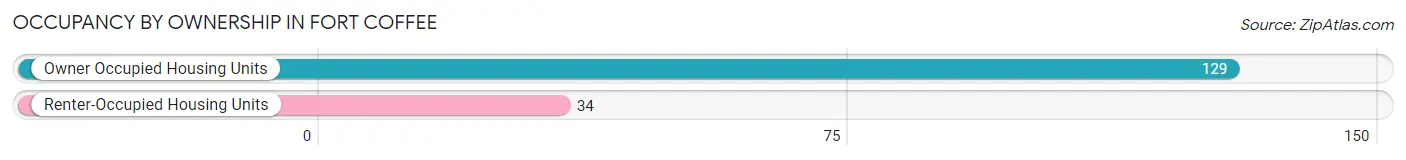
| Occupancy | # Housing Units | % Housing Units |
| Owner Occupied Housing Units | 129 | 79.1% |
| Renter-Occupied Housing Units | 34 | 20.9% |
| Total Occupied Housing Units | 163 | 100.0% |
Occupancy by Household Size in Fort Coffee
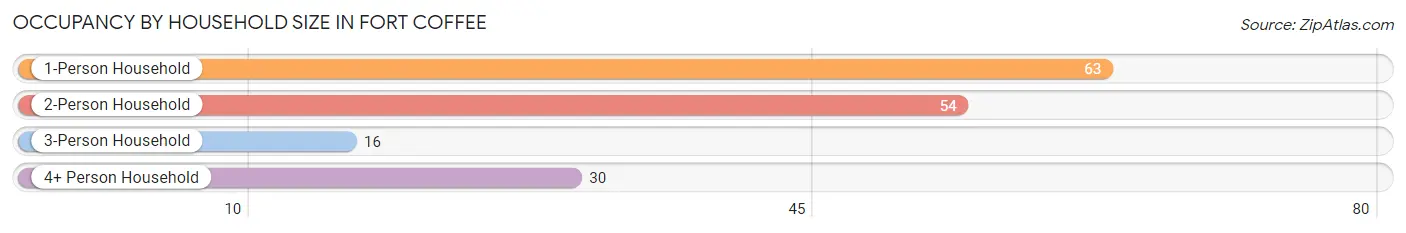
| Household Size | # Housing Units | % Housing Units |
| 1-Person Household | 63 | 38.7% |
| 2-Person Household | 54 | 33.1% |
| 3-Person Household | 16 | 9.8% |
| 4+ Person Household | 30 | 18.4% |
| Total Housing Units | 163 | 100.0% |
Occupancy by Ownership by Household Size in Fort Coffee
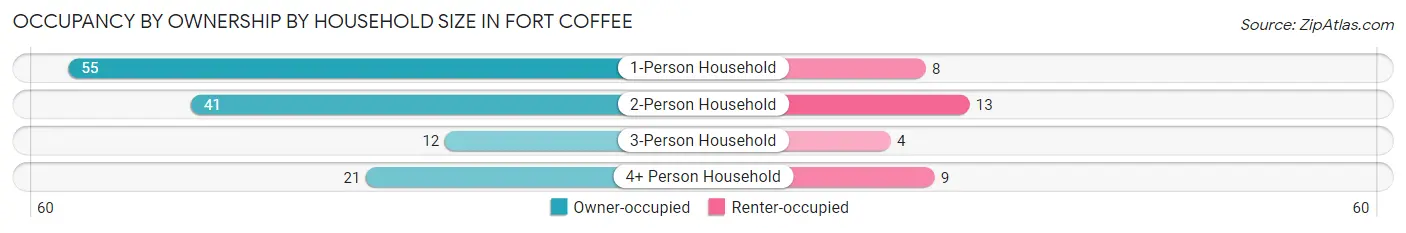
| Household Size | Owner-occupied | Renter-occupied |
| 1-Person Household | 55 (87.3%) | 8 (12.7%) |
| 2-Person Household | 41 (75.9%) | 13 (24.1%) |
| 3-Person Household | 12 (75.0%) | 4 (25.0%) |
| 4+ Person Household | 21 (70.0%) | 9 (30.0%) |
| Total Housing Units | 129 (79.1%) | 34 (20.9%) |
Occupancy by Educational Attainment in Fort Coffee
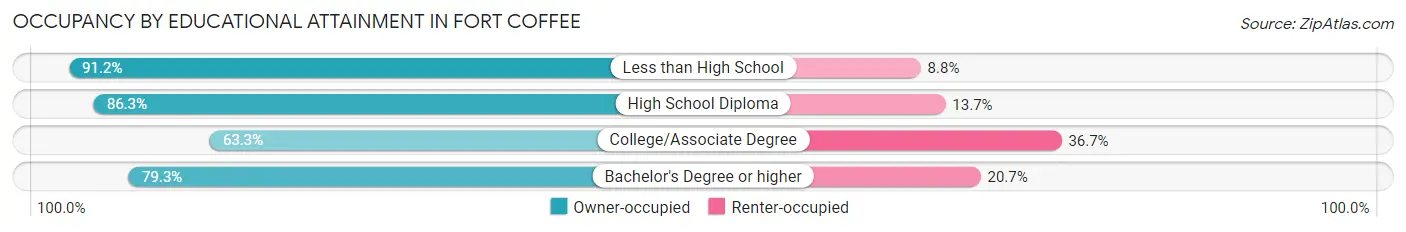
| Household Size | Owner-occupied | Renter-occupied |
| Less than High School | 31 (91.2%) | 3 (8.8%) |
| High School Diploma | 44 (86.3%) | 7 (13.7%) |
| College/Associate Degree | 31 (63.3%) | 18 (36.7%) |
| Bachelor's Degree or higher | 23 (79.3%) | 6 (20.7%) |
Occupancy by Age of Householder in Fort Coffee
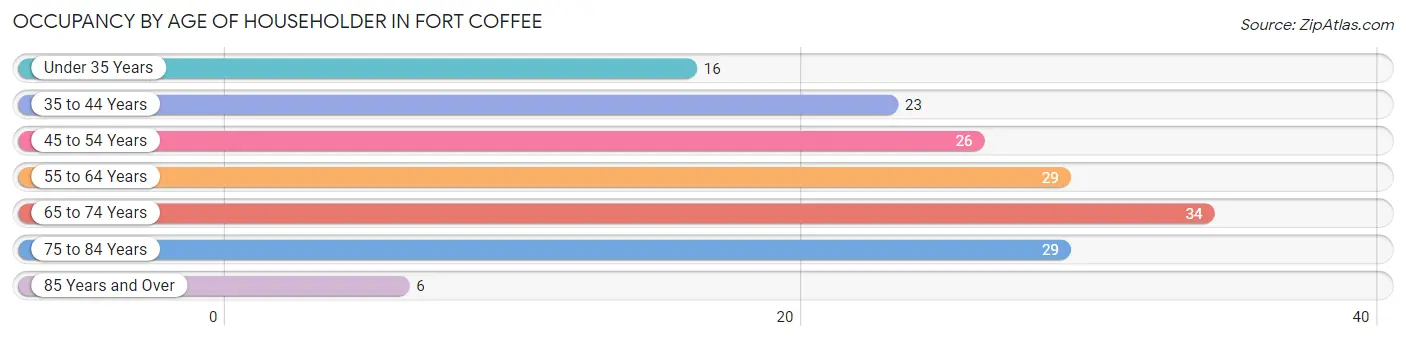
| Age Bracket | # Households | % Households |
| Under 35 Years | 16 | 9.8% |
| 35 to 44 Years | 23 | 14.1% |
| 45 to 54 Years | 26 | 16.0% |
| 55 to 64 Years | 29 | 17.8% |
| 65 to 74 Years | 34 | 20.9% |
| 75 to 84 Years | 29 | 17.8% |
| 85 Years and Over | 6 | 3.7% |
| Total | 163 | 100.0% |
Housing Finances in Fort Coffee
Median Income by Occupancy in Fort Coffee
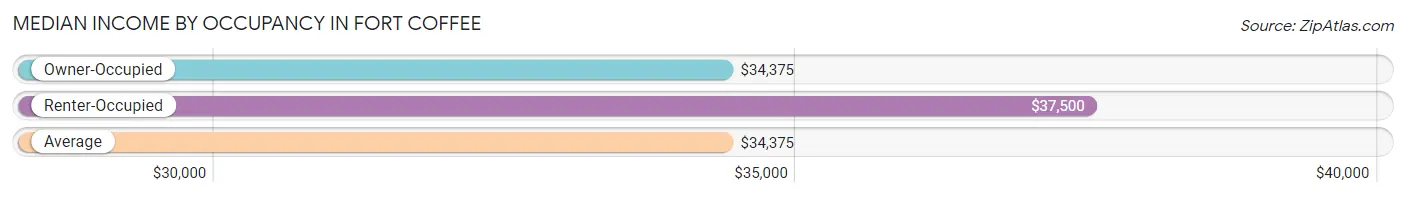
| Occupancy Type | # Households | Median Income |
| Owner-Occupied | 129 (79.1%) | $34,375 |
| Renter-Occupied | 34 (20.9%) | $37,500 |
| Average | 163 (100.0%) | $34,375 |
Occupancy by Householder Income Bracket in Fort Coffee
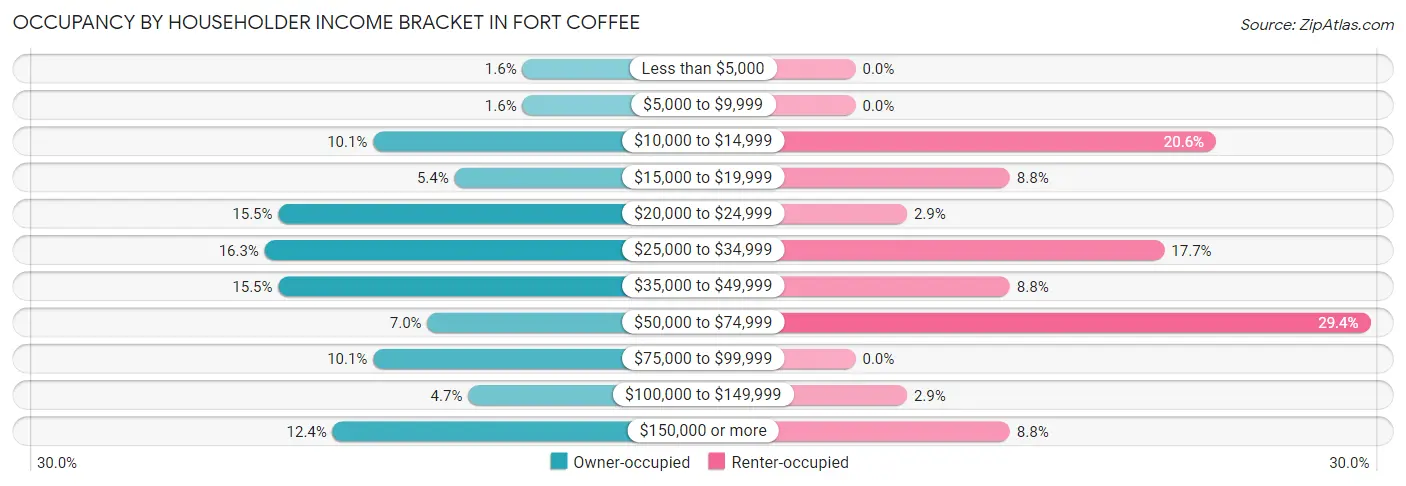
| Income Bracket | Owner-occupied | Renter-occupied |
| Less than $5,000 | 2 (1.5%) | 0 (0.0%) |
| $5,000 to $9,999 | 2 (1.5%) | 0 (0.0%) |
| $10,000 to $14,999 | 13 (10.1%) | 7 (20.6%) |
| $15,000 to $19,999 | 7 (5.4%) | 3 (8.8%) |
| $20,000 to $24,999 | 20 (15.5%) | 1 (2.9%) |
| $25,000 to $34,999 | 21 (16.3%) | 6 (17.6%) |
| $35,000 to $49,999 | 20 (15.5%) | 3 (8.8%) |
| $50,000 to $74,999 | 9 (7.0%) | 10 (29.4%) |
| $75,000 to $99,999 | 13 (10.1%) | 0 (0.0%) |
| $100,000 to $149,999 | 6 (4.6%) | 1 (2.9%) |
| $150,000 or more | 16 (12.4%) | 3 (8.8%) |
| Total | 129 (100.0%) | 34 (100.0%) |
Monthly Housing Cost Tiers in Fort Coffee
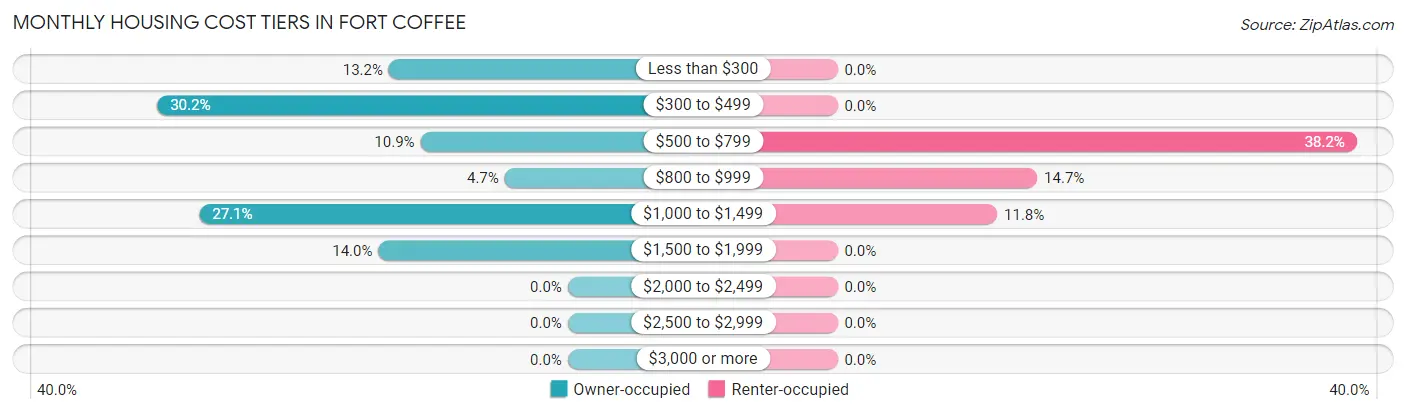
| Monthly Cost | Owner-occupied | Renter-occupied |
| Less than $300 | 17 (13.2%) | 0 (0.0%) |
| $300 to $499 | 39 (30.2%) | 0 (0.0%) |
| $500 to $799 | 14 (10.8%) | 13 (38.2%) |
| $800 to $999 | 6 (4.6%) | 5 (14.7%) |
| $1,000 to $1,499 | 35 (27.1%) | 4 (11.8%) |
| $1,500 to $1,999 | 18 (14.0%) | 0 (0.0%) |
| $2,000 to $2,499 | 0 (0.0%) | 0 (0.0%) |
| $2,500 to $2,999 | 0 (0.0%) | 0 (0.0%) |
| $3,000 or more | 0 (0.0%) | 0 (0.0%) |
| Total | 129 (100.0%) | 34 (100.0%) |
Physical Housing Characteristics in Fort Coffee
Housing Structures in Fort Coffee
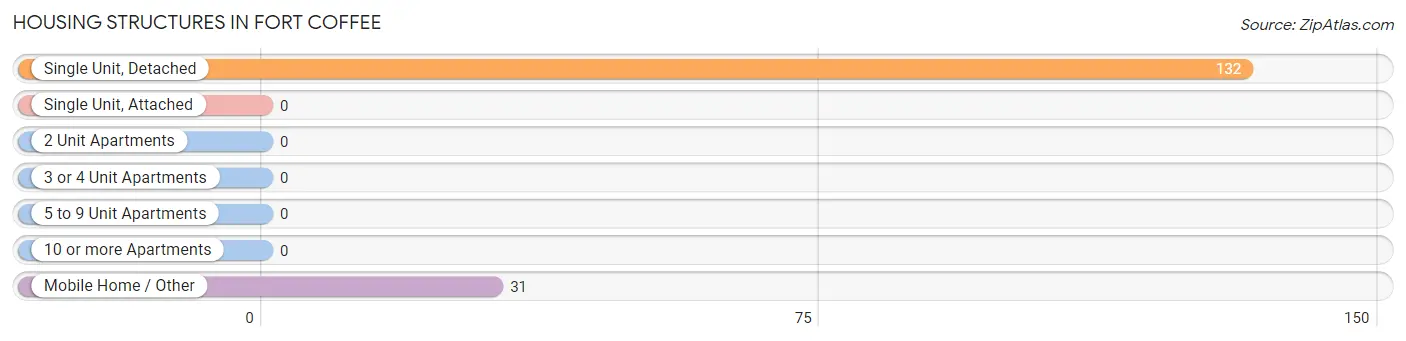
| Structure Type | # Housing Units | % Housing Units |
| Single Unit, Detached | 132 | 81.0% |
| Single Unit, Attached | 0 | 0.0% |
| 2 Unit Apartments | 0 | 0.0% |
| 3 or 4 Unit Apartments | 0 | 0.0% |
| 5 to 9 Unit Apartments | 0 | 0.0% |
| 10 or more Apartments | 0 | 0.0% |
| Mobile Home / Other | 31 | 19.0% |
| Total | 163 | 100.0% |
Housing Structures by Occupancy in Fort Coffee
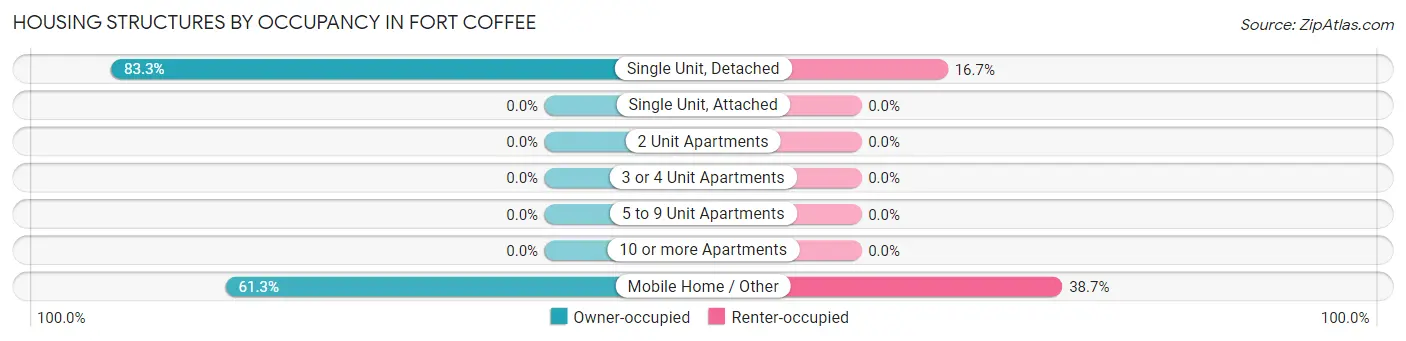
| Structure Type | Owner-occupied | Renter-occupied |
| Single Unit, Detached | 110 (83.3%) | 22 (16.7%) |
| Single Unit, Attached | 0 (0.0%) | 0 (0.0%) |
| 2 Unit Apartments | 0 (0.0%) | 0 (0.0%) |
| 3 or 4 Unit Apartments | 0 (0.0%) | 0 (0.0%) |
| 5 to 9 Unit Apartments | 0 (0.0%) | 0 (0.0%) |
| 10 or more Apartments | 0 (0.0%) | 0 (0.0%) |
| Mobile Home / Other | 19 (61.3%) | 12 (38.7%) |
| Total | 129 (79.1%) | 34 (20.9%) |
Housing Structures by Number of Rooms in Fort Coffee
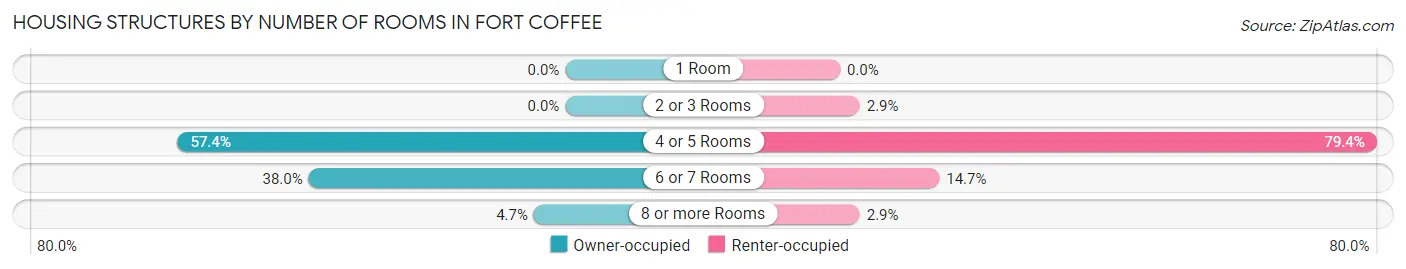
| Number of Rooms | Owner-occupied | Renter-occupied |
| 1 Room | 0 (0.0%) | 0 (0.0%) |
| 2 or 3 Rooms | 0 (0.0%) | 1 (2.9%) |
| 4 or 5 Rooms | 74 (57.4%) | 27 (79.4%) |
| 6 or 7 Rooms | 49 (38.0%) | 5 (14.7%) |
| 8 or more Rooms | 6 (4.6%) | 1 (2.9%) |
| Total | 129 (100.0%) | 34 (100.0%) |
Housing Structure by Heating Type in Fort Coffee
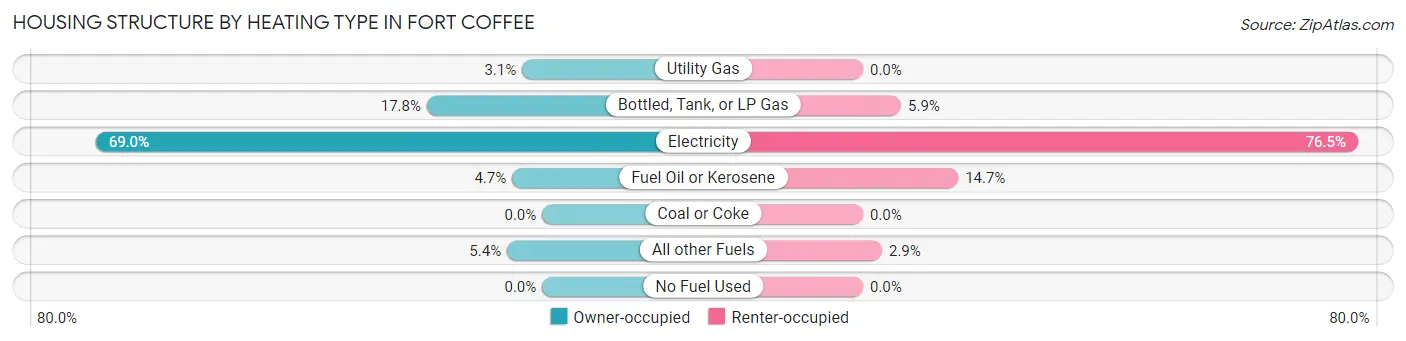
| Heating Type | Owner-occupied | Renter-occupied |
| Utility Gas | 4 (3.1%) | 0 (0.0%) |
| Bottled, Tank, or LP Gas | 23 (17.8%) | 2 (5.9%) |
| Electricity | 89 (69.0%) | 26 (76.5%) |
| Fuel Oil or Kerosene | 6 (4.6%) | 5 (14.7%) |
| Coal or Coke | 0 (0.0%) | 0 (0.0%) |
| All other Fuels | 7 (5.4%) | 1 (2.9%) |
| No Fuel Used | 0 (0.0%) | 0 (0.0%) |
| Total | 129 (100.0%) | 34 (100.0%) |
Household Vehicle Usage in Fort Coffee
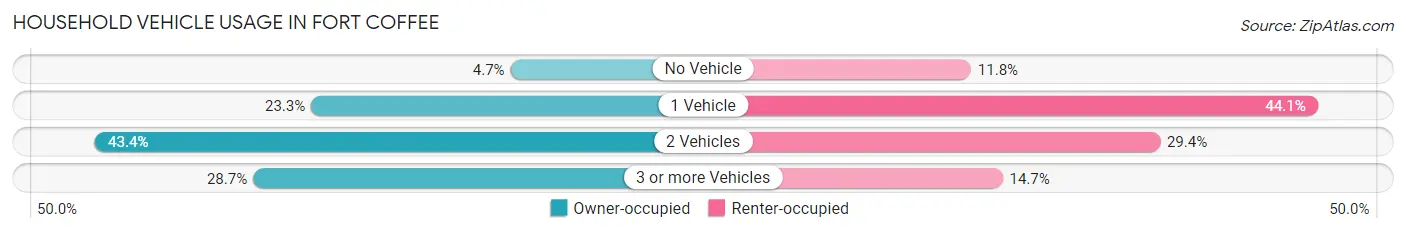
| Vehicles per Household | Owner-occupied | Renter-occupied |
| No Vehicle | 6 (4.6%) | 4 (11.8%) |
| 1 Vehicle | 30 (23.3%) | 15 (44.1%) |
| 2 Vehicles | 56 (43.4%) | 10 (29.4%) |
| 3 or more Vehicles | 37 (28.7%) | 5 (14.7%) |
| Total | 129 (100.0%) | 34 (100.0%) |
Real Estate & Mortgages in Fort Coffee
Real Estate and Mortgage Overview in Fort Coffee
| Characteristic | Without Mortgage | With Mortgage |
| Housing Units | 64 | 65 |
| Median Property Value | $77,800 | $78,400 |
| Median Household Income | $31,250 | $16 |
| Monthly Housing Costs | $336 | $0 |
| Real Estate Taxes | $464 | $1 |
Property Value by Mortgage Status in Fort Coffee
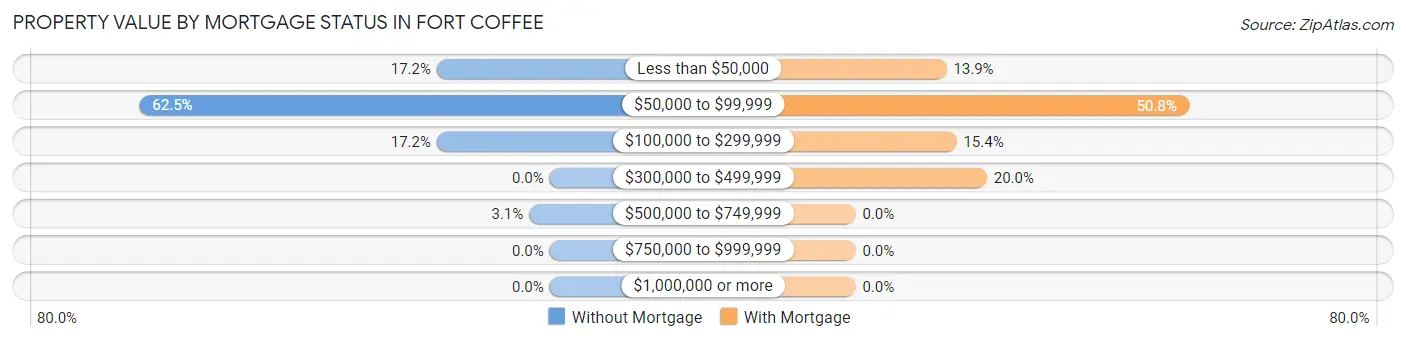
| Property Value | Without Mortgage | With Mortgage |
| Less than $50,000 | 11 (17.2%) | 9 (13.9%) |
| $50,000 to $99,999 | 40 (62.5%) | 33 (50.8%) |
| $100,000 to $299,999 | 11 (17.2%) | 10 (15.4%) |
| $300,000 to $499,999 | 0 (0.0%) | 13 (20.0%) |
| $500,000 to $749,999 | 2 (3.1%) | 0 (0.0%) |
| $750,000 to $999,999 | 0 (0.0%) | 0 (0.0%) |
| $1,000,000 or more | 0 (0.0%) | 0 (0.0%) |
| Total | 64 (100.0%) | 65 (100.0%) |
Household Income by Mortgage Status in Fort Coffee
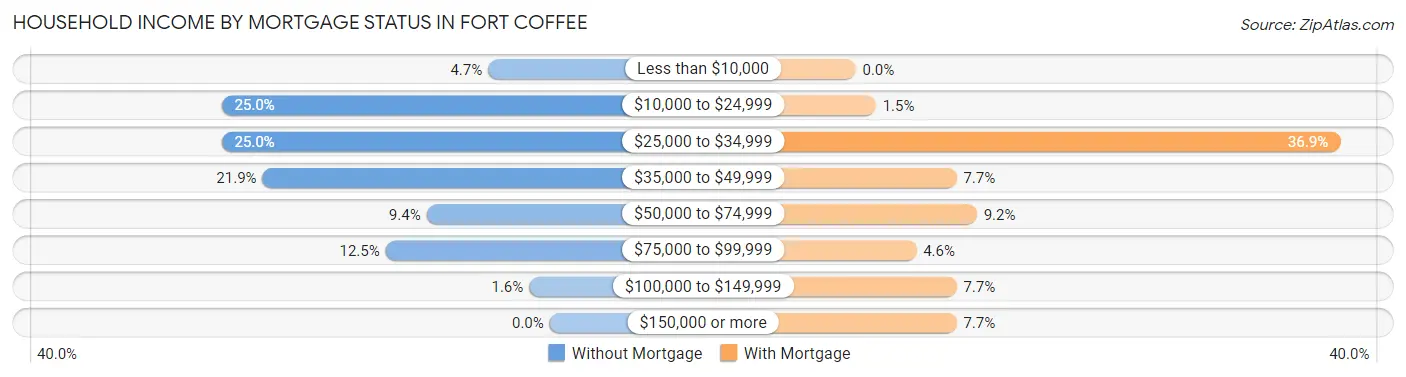
| Household Income | Without Mortgage | With Mortgage |
| Less than $10,000 | 3 (4.7%) | 0 (0.0%) |
| $10,000 to $24,999 | 16 (25.0%) | 1 (1.5%) |
| $25,000 to $34,999 | 16 (25.0%) | 24 (36.9%) |
| $35,000 to $49,999 | 14 (21.9%) | 5 (7.7%) |
| $50,000 to $74,999 | 6 (9.4%) | 6 (9.2%) |
| $75,000 to $99,999 | 8 (12.5%) | 3 (4.6%) |
| $100,000 to $149,999 | 1 (1.6%) | 5 (7.7%) |
| $150,000 or more | 0 (0.0%) | 5 (7.7%) |
| Total | 64 (100.0%) | 65 (100.0%) |
Property Value to Household Income Ratio in Fort Coffee
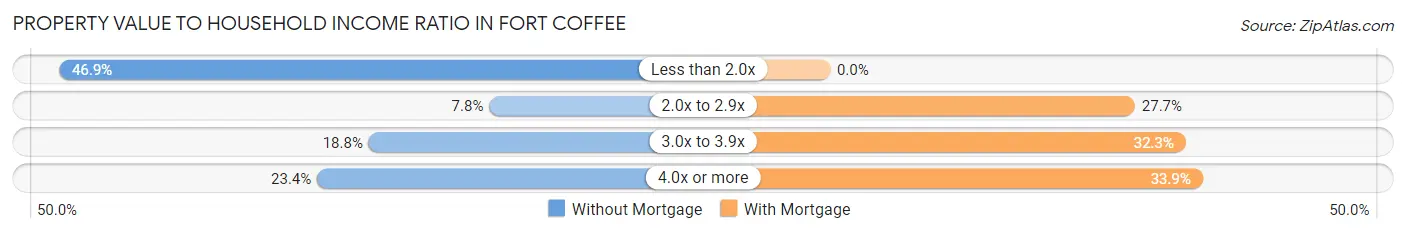
| Value-to-Income Ratio | Without Mortgage | With Mortgage |
| Less than 2.0x | 30 (46.9%) | 0 (0.0%) |
| 2.0x to 2.9x | 5 (7.8%) | 18 (27.7%) |
| 3.0x to 3.9x | 12 (18.8%) | 21 (32.3%) |
| 4.0x or more | 15 (23.4%) | 22 (33.9%) |
| Total | 64 (100.0%) | 65 (100.0%) |
Real Estate Taxes by Mortgage Status in Fort Coffee
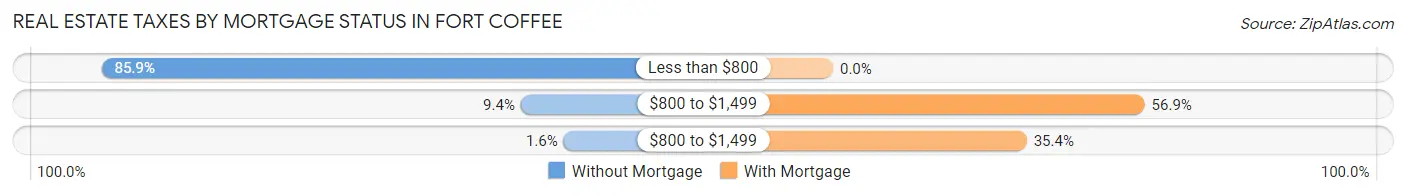
| Property Taxes | Without Mortgage | With Mortgage |
| Less than $800 | 55 (85.9%) | 0 (0.0%) |
| $800 to $1,499 | 6 (9.4%) | 37 (56.9%) |
| $800 to $1,499 | 1 (1.6%) | 23 (35.4%) |
| Total | 64 (100.0%) | 65 (100.0%) |
Health & Disability in Fort Coffee
Health Insurance Coverage by Age in Fort Coffee
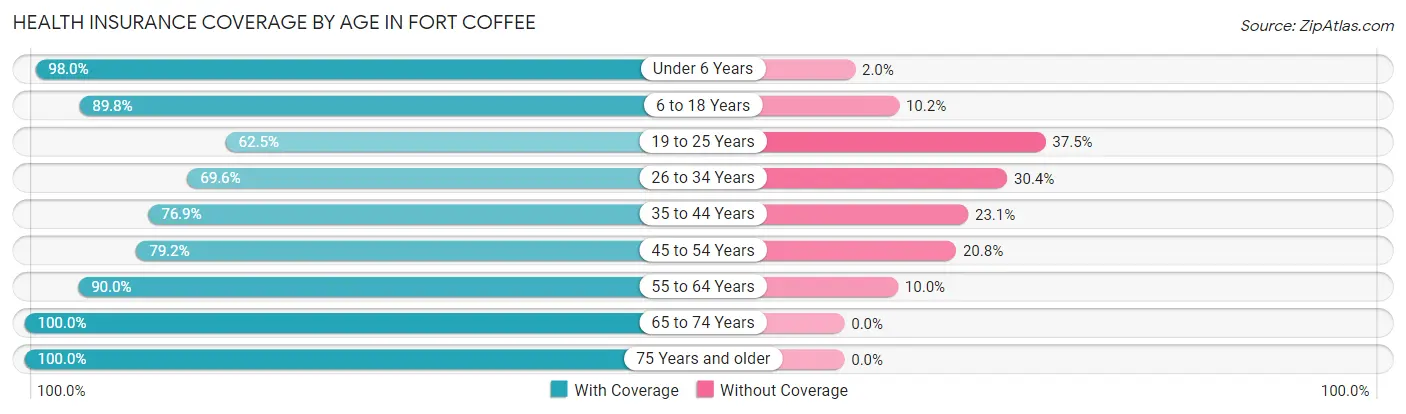
| Age Bracket | With Coverage | Without Coverage |
| Under 6 Years | 49 (98.0%) | 1 (2.0%) |
| 6 to 18 Years | 44 (89.8%) | 5 (10.2%) |
| 19 to 25 Years | 5 (62.5%) | 3 (37.5%) |
| 26 to 34 Years | 39 (69.6%) | 17 (30.4%) |
| 35 to 44 Years | 20 (76.9%) | 6 (23.1%) |
| 45 to 54 Years | 38 (79.2%) | 10 (20.8%) |
| 55 to 64 Years | 45 (90.0%) | 5 (10.0%) |
| 65 to 74 Years | 53 (100.0%) | 0 (0.0%) |
| 75 Years and older | 41 (100.0%) | 0 (0.0%) |
| Total | 334 (87.7%) | 47 (12.3%) |
Health Insurance Coverage by Citizenship Status in Fort Coffee
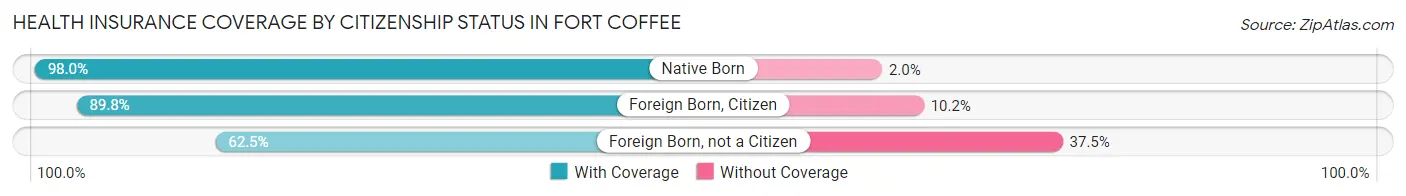
| Citizenship Status | With Coverage | Without Coverage |
| Native Born | 49 (98.0%) | 1 (2.0%) |
| Foreign Born, Citizen | 44 (89.8%) | 5 (10.2%) |
| Foreign Born, not a Citizen | 5 (62.5%) | 3 (37.5%) |
Health Insurance Coverage by Household Income in Fort Coffee
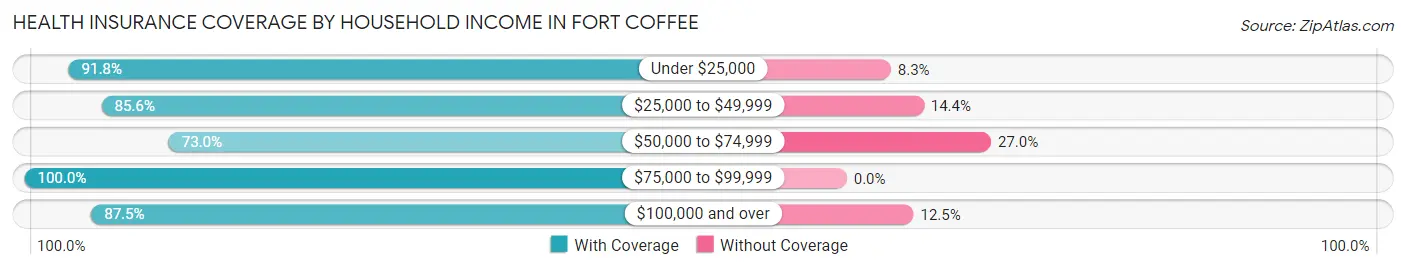
| Household Income | With Coverage | Without Coverage |
| Under $25,000 | 89 (91.7%) | 8 (8.3%) |
| $25,000 to $49,999 | 89 (85.6%) | 15 (14.4%) |
| $50,000 to $74,999 | 27 (73.0%) | 10 (27.0%) |
| $75,000 to $99,999 | 31 (100.0%) | 0 (0.0%) |
| $100,000 and over | 98 (87.5%) | 14 (12.5%) |
Public vs Private Health Insurance Coverage by Age in Fort Coffee
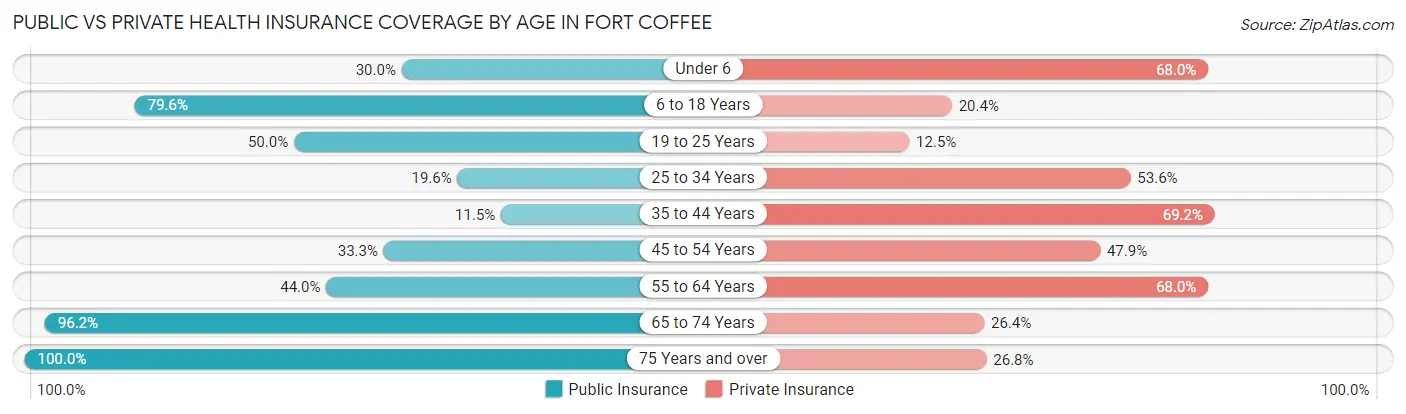
| Age Bracket | Public Insurance | Private Insurance |
| Under 6 | 15 (30.0%) | 34 (68.0%) |
| 6 to 18 Years | 39 (79.6%) | 10 (20.4%) |
| 19 to 25 Years | 4 (50.0%) | 1 (12.5%) |
| 25 to 34 Years | 11 (19.6%) | 30 (53.6%) |
| 35 to 44 Years | 3 (11.5%) | 18 (69.2%) |
| 45 to 54 Years | 16 (33.3%) | 23 (47.9%) |
| 55 to 64 Years | 22 (44.0%) | 34 (68.0%) |
| 65 to 74 Years | 51 (96.2%) | 14 (26.4%) |
| 75 Years and over | 41 (100.0%) | 11 (26.8%) |
| Total | 202 (53.0%) | 175 (45.9%) |
Disability Status by Sex by Age in Fort Coffee
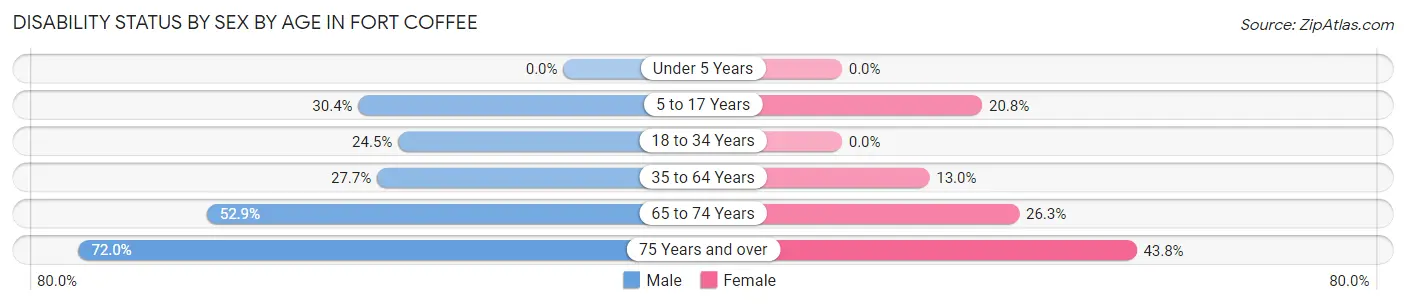
| Age Bracket | Male | Female |
| Under 5 Years | 0 (0.0%) | 0 (0.0%) |
| 5 to 17 Years | 7 (30.4%) | 5 (20.8%) |
| 18 to 34 Years | 13 (24.5%) | 0 (0.0%) |
| 35 to 64 Years | 13 (27.7%) | 10 (13.0%) |
| 65 to 74 Years | 18 (52.9%) | 5 (26.3%) |
| 75 Years and over | 18 (72.0%) | 7 (43.8%) |
Disability Class by Sex by Age in Fort Coffee
Disability Class: Hearing Difficulty
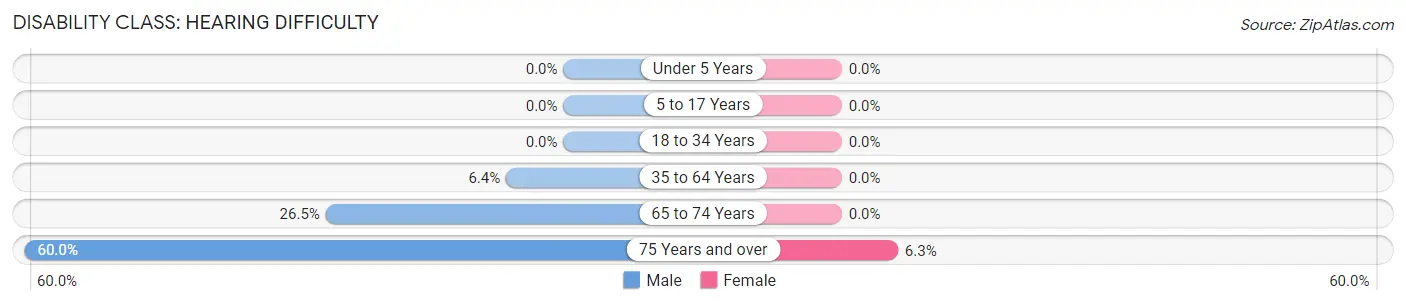
| Age Bracket | Male | Female |
| Under 5 Years | 0 (0.0%) | 0 (0.0%) |
| 5 to 17 Years | 0 (0.0%) | 0 (0.0%) |
| 18 to 34 Years | 0 (0.0%) | 0 (0.0%) |
| 35 to 64 Years | 3 (6.4%) | 0 (0.0%) |
| 65 to 74 Years | 9 (26.5%) | 0 (0.0%) |
| 75 Years and over | 15 (60.0%) | 1 (6.2%) |
Disability Class: Vision Difficulty
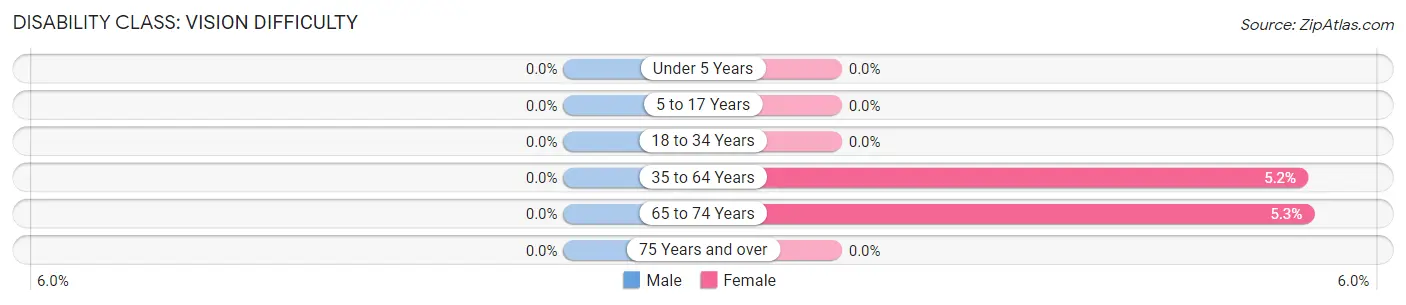
| Age Bracket | Male | Female |
| Under 5 Years | 0 (0.0%) | 0 (0.0%) |
| 5 to 17 Years | 0 (0.0%) | 0 (0.0%) |
| 18 to 34 Years | 0 (0.0%) | 0 (0.0%) |
| 35 to 64 Years | 0 (0.0%) | 4 (5.2%) |
| 65 to 74 Years | 0 (0.0%) | 1 (5.3%) |
| 75 Years and over | 0 (0.0%) | 0 (0.0%) |
Disability Class: Cognitive Difficulty
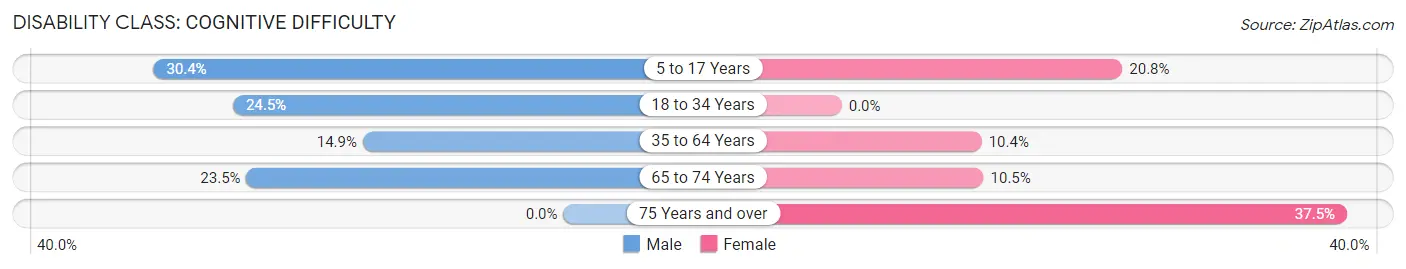
| Age Bracket | Male | Female |
| 5 to 17 Years | 7 (30.4%) | 5 (20.8%) |
| 18 to 34 Years | 13 (24.5%) | 0 (0.0%) |
| 35 to 64 Years | 7 (14.9%) | 8 (10.4%) |
| 65 to 74 Years | 8 (23.5%) | 2 (10.5%) |
| 75 Years and over | 0 (0.0%) | 6 (37.5%) |
Disability Class: Ambulatory Difficulty
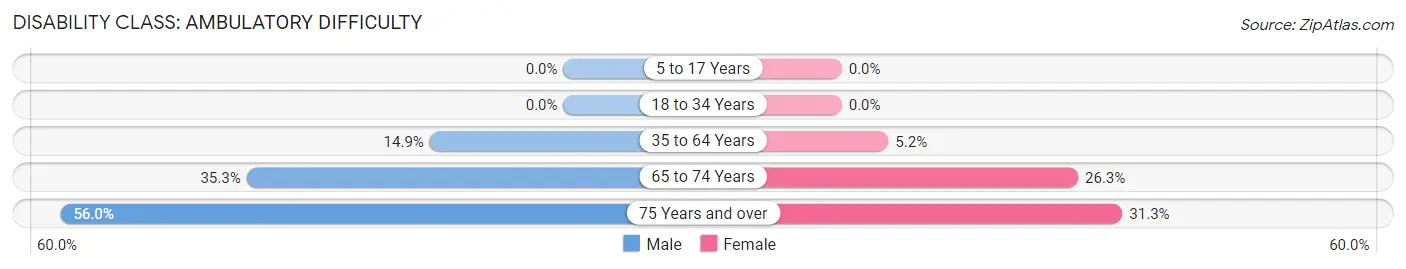
| Age Bracket | Male | Female |
| 5 to 17 Years | 0 (0.0%) | 0 (0.0%) |
| 18 to 34 Years | 0 (0.0%) | 0 (0.0%) |
| 35 to 64 Years | 7 (14.9%) | 4 (5.2%) |
| 65 to 74 Years | 12 (35.3%) | 5 (26.3%) |
| 75 Years and over | 14 (56.0%) | 5 (31.2%) |
Disability Class: Self-Care Difficulty
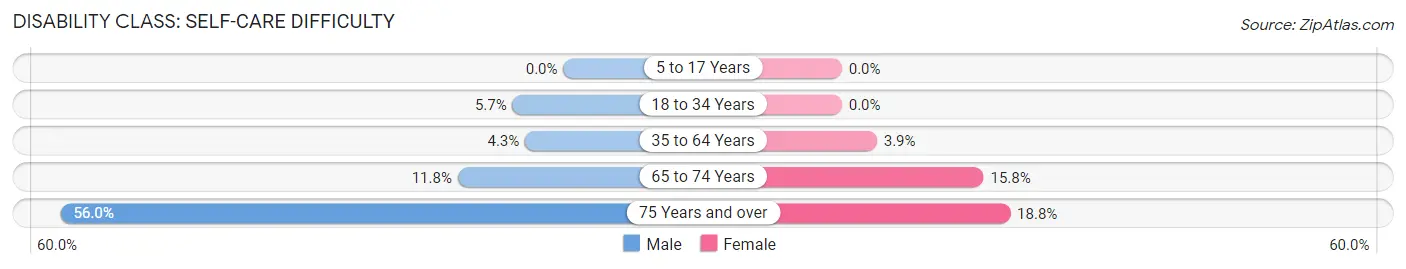
| Age Bracket | Male | Female |
| 5 to 17 Years | 0 (0.0%) | 0 (0.0%) |
| 18 to 34 Years | 3 (5.7%) | 0 (0.0%) |
| 35 to 64 Years | 2 (4.3%) | 3 (3.9%) |
| 65 to 74 Years | 4 (11.8%) | 3 (15.8%) |
| 75 Years and over | 14 (56.0%) | 3 (18.8%) |
Technology Access in Fort Coffee
Computing Device Access in Fort Coffee
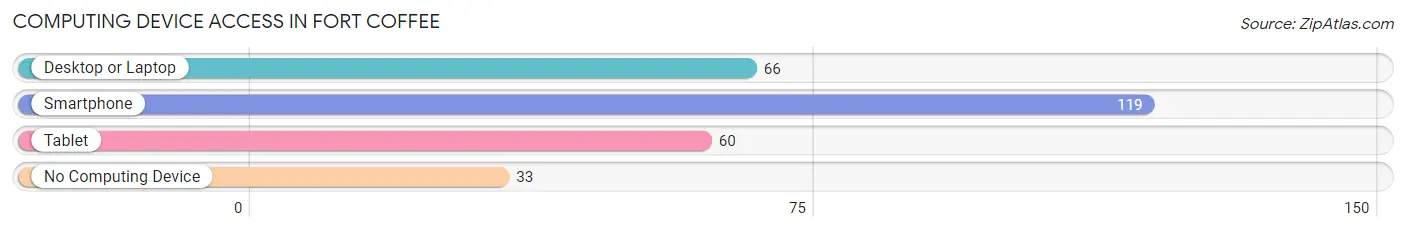
| Device Type | # Households | % Households |
| Desktop or Laptop | 66 | 40.5% |
| Smartphone | 119 | 73.0% |
| Tablet | 60 | 36.8% |
| No Computing Device | 33 | 20.3% |
| Total | 163 | 100.0% |
Internet Access in Fort Coffee
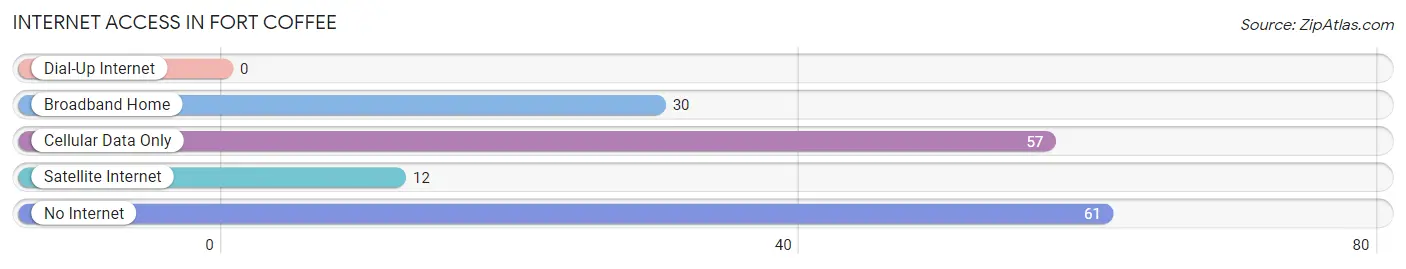
| Internet Type | # Households | % Households |
| Dial-Up Internet | 0 | 0.0% |
| Broadband Home | 30 | 18.4% |
| Cellular Data Only | 57 | 35.0% |
| Satellite Internet | 12 | 7.4% |
| No Internet | 61 | 37.4% |
| Total | 163 | 100.0% |
Fort Coffee Summary
Coffee, Oklahoma is a small unincorporated community located in LeFlore County, Oklahoma. It is situated on the banks of the Poteau River, approximately 10 miles south of Poteau, Oklahoma. The town was named after Fort Coffee, a military post established in 1834 by the United States Army. The fort was built to protect the Choctaw and Chickasaw Nations from hostile Native American tribes.
History
Fort Coffee was established in 1834 by the United States Army to protect the Choctaw and Chickasaw Nations from hostile Native American tribes. The fort was named after General John Coffee, a veteran of the War of 1812. The fort was abandoned in 1838, but the town of Coffee was established in 1845. The town was originally known as Coffeeville, but the name was changed to Coffee in 1891.
The town of Coffee was a thriving community in the late 19th and early 20th centuries. It was home to several businesses, including a general store, a blacksmith shop, a cotton gin, and a grist mill. The town also had a post office, a school, and a church.
Geography
Coffee is located in LeFlore County, Oklahoma, approximately 10 miles south of Poteau, Oklahoma. The town is situated on the banks of the Poteau River. The town is surrounded by rolling hills and wooded areas. The climate in Coffee is mild, with temperatures ranging from the low 30s in the winter to the mid-90s in the summer.
Economy
The economy of Coffee is largely based on agriculture. The town is home to several farms, which produce a variety of crops, including cotton, corn, soybeans, and wheat. The town also has several small businesses, including a general store, a gas station, and a restaurant.
Demographics
As of the 2010 census, the population of Coffee was 545. The racial makeup of the town was 95.3% White, 0.7% African American, 0.7% Native American, 0.2% Asian, and 2.1% from other races. The median household income in Coffee was $30,000, and the median family income was $35,000.
Conclusion
Coffee, Oklahoma is a small unincorporated community located in LeFlore County, Oklahoma. It was established in 1845 and was originally known as Coffeeville. The town was named after Fort Coffee, a military post established in 1834 by the United States Army. The economy of Coffee is largely based on agriculture, and the town is home to several small businesses. As of the 2010 census, the population of Coffee was 545.
Common Questions
What is the Total Population of Fort Coffee?
Total Population of Fort Coffee is 381.
What is the Total Male Population of Fort Coffee?
Total Male Population of Fort Coffee is 186.
What is the Total Female Population of Fort Coffee?
Total Female Population of Fort Coffee is 195.
What is the Ratio of Males per 100 Females in Fort Coffee?
There are 95.38 Males per 100 Females in Fort Coffee.
What is the Ratio of Females per 100 Males in Fort Coffee?
There are 104.84 Females per 100 Males in Fort Coffee.
What is the Median Population Age in Fort Coffee?
Median Population Age in Fort Coffee is 45.1 Years.
What is the Average Family Size in Fort Coffee
Average Family Size in Fort Coffee is 3.2 People.
What is the Average Household Size in Fort Coffee
Average Household Size in Fort Coffee is 2.3 People.
What is Per Capita Income in Fort Coffee?
Per Capita income in Fort Coffee is $25,598.
What is the Median Family Income in Fort Coffee?
Median Family Income in Fort Coffee is $54,375.
What is the Median Household income in Fort Coffee?
Median Household Income in Fort Coffee is $34,375.
What is Inequality or Gini Index in Fort Coffee?
Inequality or Gini Index in Fort Coffee is 0.44.
How Large is the Labor Force in Fort Coffee?
There are 137 People in the Labor Forcein in Fort Coffee.
What is the Percentage of People in the Labor Force in Fort Coffee?
46.8% of People are in the Labor Force in Fort Coffee.
What is the Unemployment Rate in Fort Coffee?
Unemployment Rate in Fort Coffee is 0.7%.