Taloga, OK
Taloga Map
Taloga Overview
303
TOTAL POPULATION
132
MALE POPULATION
171
FEMALE POPULATION
77.19
MALES / 100 FEMALES
129.55
FEMALES / 100 MALES
33.8
MEDIAN AGE
3.8
AVG FAMILY SIZE
2.7
AVG HOUSEHOLD SIZE
$24,794
PER CAPITA INCOME
$51,250
AVG FAMILY INCOME
$48,125
AVG HOUSEHOLD INCOME
0.45
INEQUALITY / GINI INDEX
127
LABOR FORCE [ PEOPLE ]
61.7%
PERCENT IN LABOR FORCE
0.8%
UNEMPLOYMENT RATE
Taloga Zip Codes
Taloga Area Codes
Race in Taloga
The most populous races in Taloga are White / Caucasian (280 | 92.4%), Two or more Races (16 | 5.3%), and Hispanic or Latino (5 | 1.7%).

| Race | # Population | % Population |
| Asian | 0 | 0.0% |
| Black / African American | 2 | 0.7% |
| Hawaiian / Pacific | 0 | 0.0% |
| Hispanic or Latino | 5 | 1.7% |
| Native / Alaskan | 5 | 1.7% |
| White / Caucasian | 280 | 92.4% |
| Two or more Races | 16 | 5.3% |
| Some other Race | 0 | 0.0% |
| Total | 303 | 100.0% |
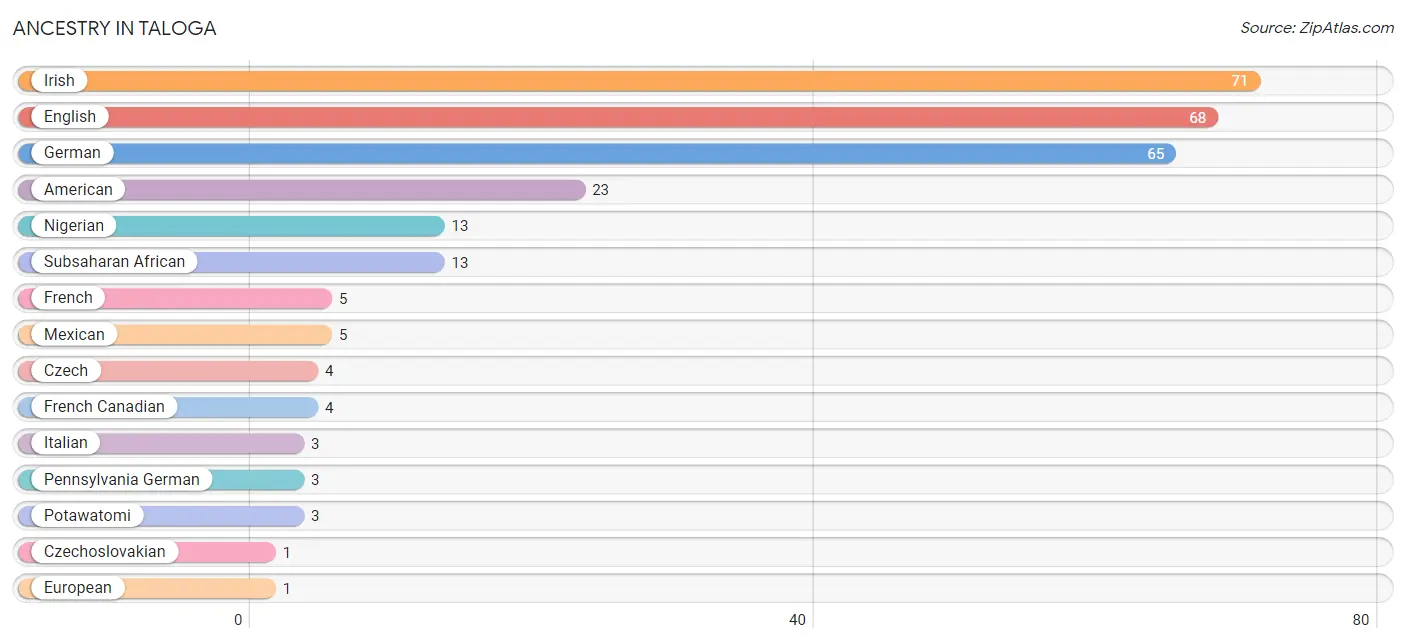
Ancestry in Taloga
The most populous ancestries reported in Taloga are Irish (71 | 23.4%), English (68 | 22.4%), German (65 | 21.4%), American (23 | 7.6%), and Nigerian (13 | 4.3%), together accounting for 79.2% of all Taloga residents.
| Ancestry | # Population | % Population |
| American | 23 | 7.6% |
| Czech | 4 | 1.3% |
| Czechoslovakian | 1 | 0.3% |
| English | 68 | 22.4% |
| European | 1 | 0.3% |
| French | 5 | 1.7% |
| French Canadian | 4 | 1.3% |
| German | 65 | 21.4% |
| Irish | 71 | 23.4% |
| Italian | 3 | 1.0% |
| Mexican | 5 | 1.7% |
| Nigerian | 13 | 4.3% |
| Pennsylvania German | 3 | 1.0% |
| Potawatomi | 3 | 1.0% |
| Subsaharan African | 13 | 4.3% | View All 15 Rows |
Immigrants in Taloga

| Immigration Origin | # Population | % Population | View All 0 Rows |
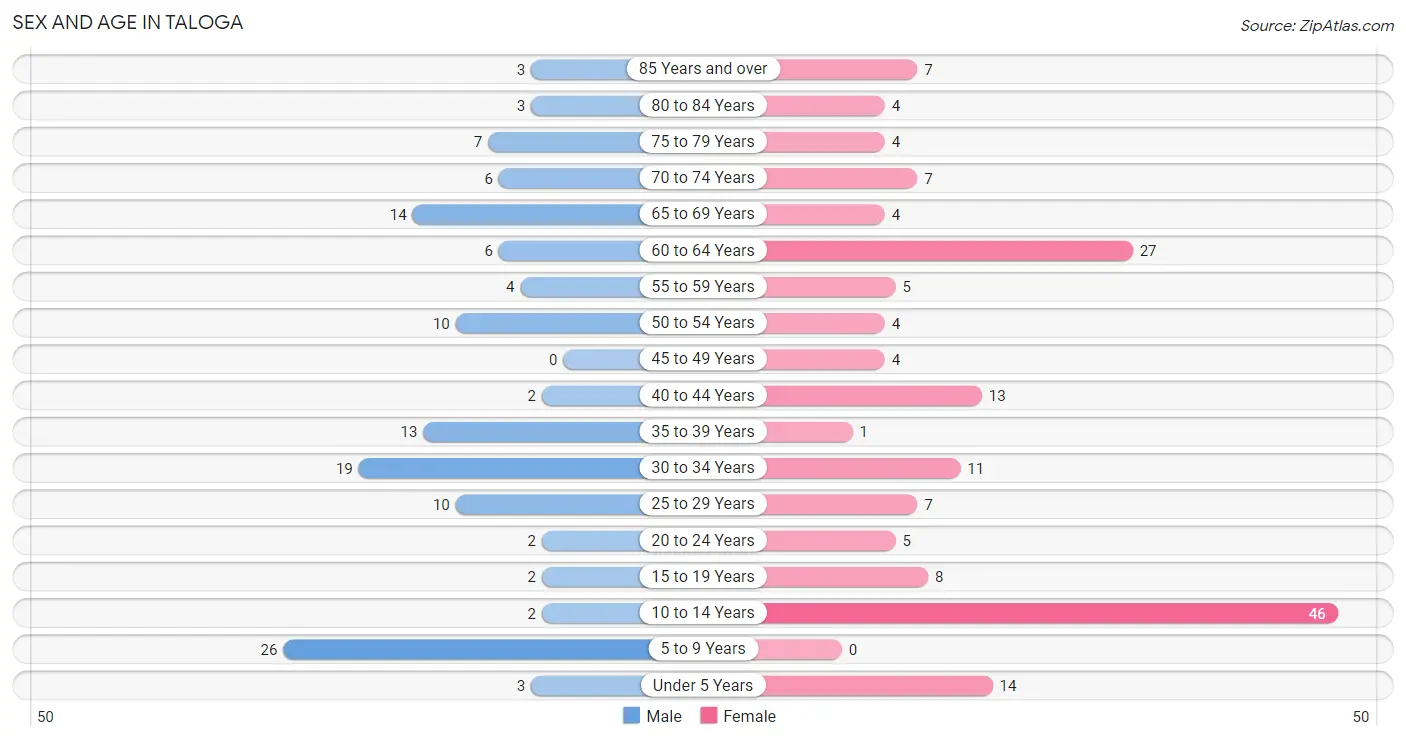
Sex and Age in Taloga
Sex and Age in Taloga
The most populous age groups in Taloga are 5 to 9 Years (26 | 19.7%) for men and 10 to 14 Years (46 | 26.9%) for women.
| Age Bracket | Male | Female |
| Under 5 Years | 3 (2.3%) | 14 (8.2%) |
| 5 to 9 Years | 26 (19.7%) | 0 (0.0%) |
| 10 to 14 Years | 2 (1.5%) | 46 (26.9%) |
| 15 to 19 Years | 2 (1.5%) | 8 (4.7%) |
| 20 to 24 Years | 2 (1.5%) | 5 (2.9%) |
| 25 to 29 Years | 10 (7.6%) | 7 (4.1%) |
| 30 to 34 Years | 19 (14.4%) | 11 (6.4%) |
| 35 to 39 Years | 13 (9.9%) | 1 (0.6%) |
| 40 to 44 Years | 2 (1.5%) | 13 (7.6%) |
| 45 to 49 Years | 0 (0.0%) | 4 (2.3%) |
| 50 to 54 Years | 10 (7.6%) | 4 (2.3%) |
| 55 to 59 Years | 4 (3.0%) | 5 (2.9%) |
| 60 to 64 Years | 6 (4.5%) | 27 (15.8%) |
| 65 to 69 Years | 14 (10.6%) | 4 (2.3%) |
| 70 to 74 Years | 6 (4.5%) | 7 (4.1%) |
| 75 to 79 Years | 7 (5.3%) | 4 (2.3%) |
| 80 to 84 Years | 3 (2.3%) | 4 (2.3%) |
| 85 Years and over | 3 (2.3%) | 7 (4.1%) |
| Total | 132 (100.0%) | 171 (100.0%) |
Families and Households in Taloga
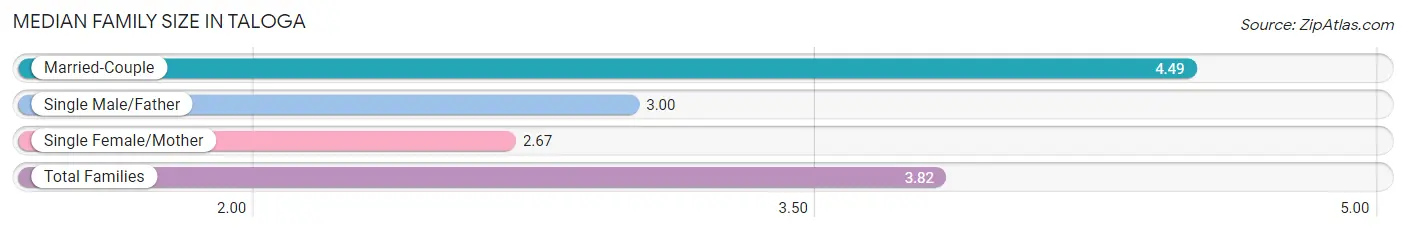
Median Family Size in Taloga
The median family size in Taloga is 3.82 persons per family, with married-couple families (35 | 62.5%) accounting for the largest median family size of 4.49 persons per family. On the other hand, single female/mother families (18 | 32.1%) represent the smallest median family size with 2.67 persons per family.
| Family Type | # Families | Family Size |
| Married-Couple | 35 (62.5%) | 4.49 |
| Single Male/Father | 3 (5.4%) | 3.00 |
| Single Female/Mother | 18 (32.1%) | 2.67 |
| Total Families | 56 (100.0%) | 3.82 |
Median Household Size in Taloga
The median household size in Taloga is 2.68 persons per household, with married-couple households (35 | 32.7%) accounting for the largest median household size of 4.49 persons per household. non-family households (51 | 47.7%) represent the smallest median household size with 1.20 persons per household.
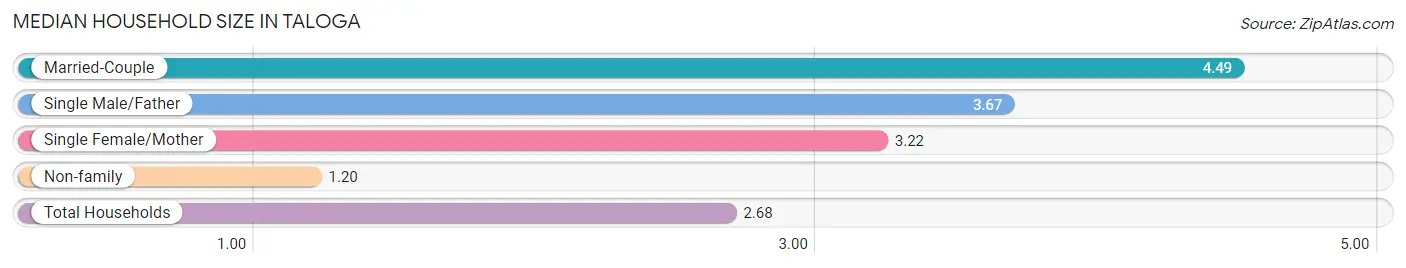
| Household Type | # Households | Household Size |
| Married-Couple | 35 (32.7%) | 4.49 |
| Single Male/Father | 3 (2.8%) | 3.67 |
| Single Female/Mother | 18 (16.8%) | 3.22 |
| Non-family | 51 (47.7%) | 1.20 |
| Total Households | 107 (100.0%) | 2.68 |
Household Size by Marriage Status in Taloga
Out of a total of 107 households in Taloga, 56 (52.3%) are family households, while 51 (47.7%) are nonfamily households. The most numerous type of family households are 2-person households, comprising 32, and the most common type of nonfamily households are 1-person households, comprising 43.
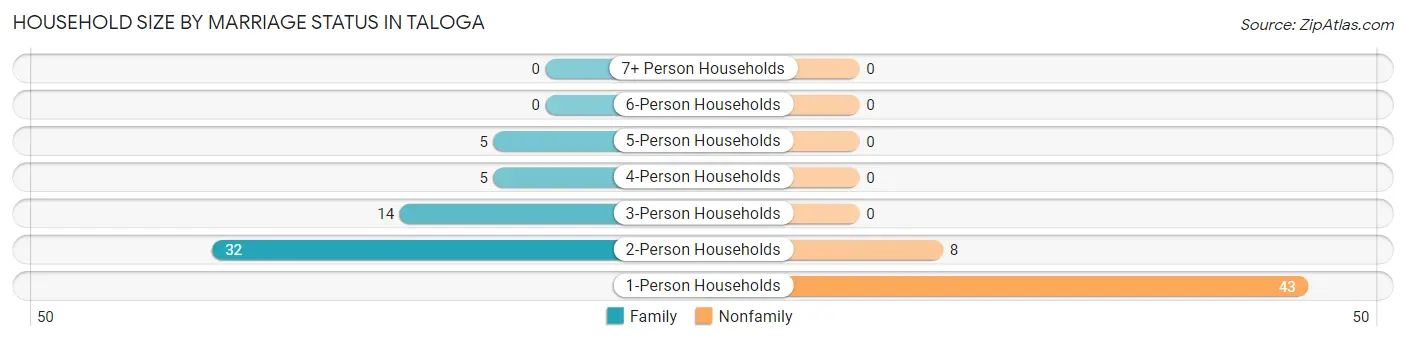
| Household Size | Family Households | Nonfamily Households |
| 1-Person Households | - | 43 (40.2%) |
| 2-Person Households | 32 (29.9%) | 8 (7.5%) |
| 3-Person Households | 14 (13.1%) | 0 (0.0%) |
| 4-Person Households | 5 (4.7%) | 0 (0.0%) |
| 5-Person Households | 5 (4.7%) | 0 (0.0%) |
| 6-Person Households | 0 (0.0%) | 0 (0.0%) |
| 7+ Person Households | 0 (0.0%) | 0 (0.0%) |
| Total | 56 (52.3%) | 51 (47.7%) |
Female Fertility in Taloga
Fertility by Age in Taloga
Average fertility rate in Taloga is 163.0 births per 1,000 women. Women in the age bracket of 35 to 50 years have the highest fertility rate with 222.0 births per 1,000 women. Women in the age bracket of 20 to 34 years acount for 50.0% of all women with births.
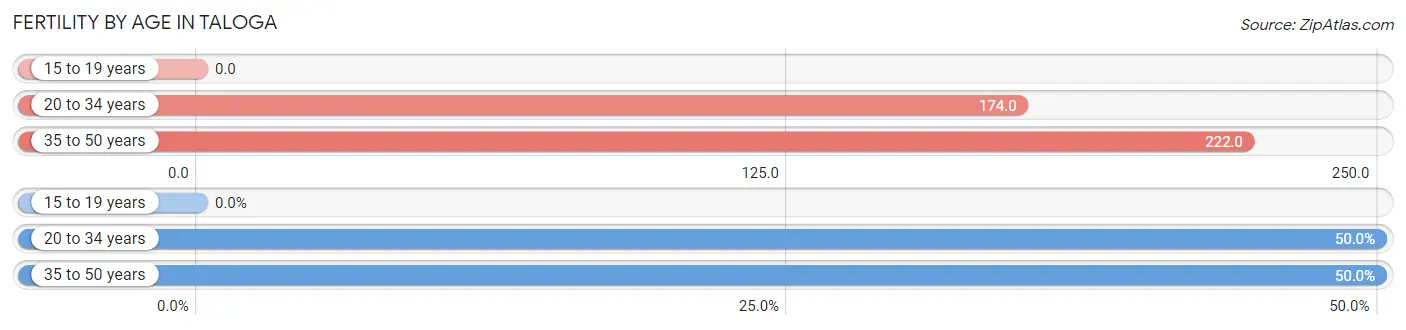
| Age Bracket | Women with Births | Births / 1,000 Women |
| 15 to 19 years | 0 (0.0%) | 0.0 |
| 20 to 34 years | 4 (50.0%) | 174.0 |
| 35 to 50 years | 4 (50.0%) | 222.0 |
| Total | 8 (100.0%) | 163.0 |
Fertility by Age by Marriage Status in Taloga
87.5% of women with births (8) in Taloga are married. The highest percentage of unmarried women with births falls into 20 to 34 years age bracket with 25.0% of them unmarried at the time of birth, while the lowest percentage of unmarried women with births belong to 35 to 50 years age bracket with 0.0% of them unmarried.
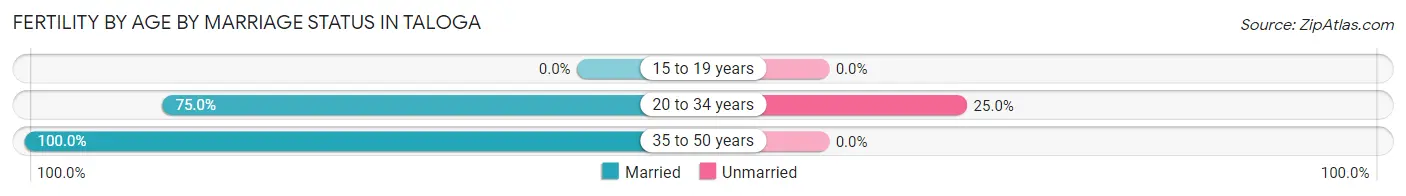
| Age Bracket | Married | Unmarried |
| 15 to 19 years | 0 (0.0%) | 0 (0.0%) |
| 20 to 34 years | 3 (75.0%) | 1 (25.0%) |
| 35 to 50 years | 4 (100.0%) | 0 (0.0%) |
| Total | 7 (87.5%) | 1 (12.5%) |
Fertility by Education in Taloga
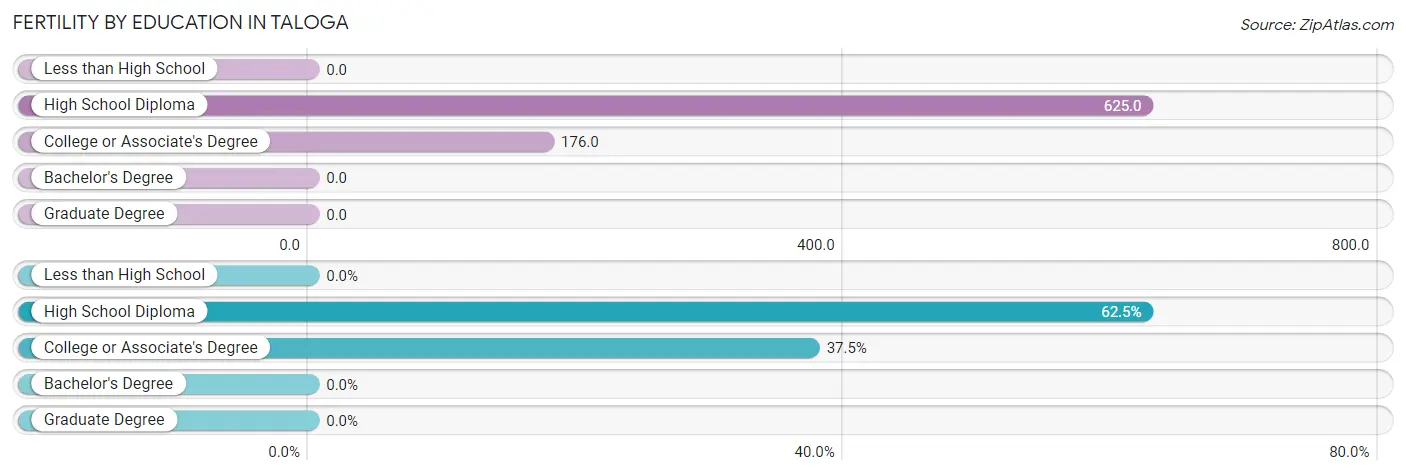
| Educational Attainment | Women with Births | Births / 1,000 Women |
| Less than High School | 0 (0.0%) | 0.0 |
| High School Diploma | 5 (62.5%) | 625.0 |
| College or Associate's Degree | 3 (37.5%) | 176.0 |
| Bachelor's Degree | 0 (0.0%) | 0.0 |
| Graduate Degree | 0 (0.0%) | 0.0 |
| Total | 8 (100.0%) | 163.0 |
Fertility by Education by Marriage Status in Taloga
12.5% of women with births in Taloga are unmarried. Women with the educational attainment of college or associate's degree are most likely to be married with 100.0% of them married at childbirth, while women with the educational attainment of high school diploma are least likely to be married with 20.0% of them unmarried at childbirth.
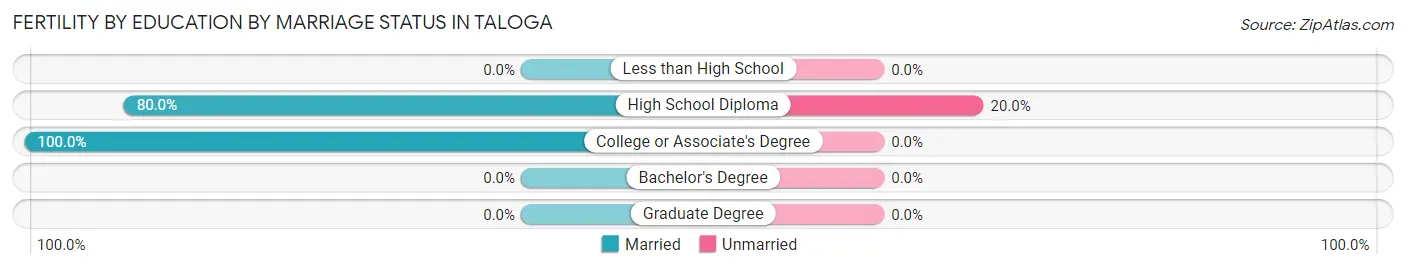
| Educational Attainment | Married | Unmarried |
| Less than High School | 0 (0.0%) | 0 (0.0%) |
| High School Diploma | 4 (80.0%) | 1 (20.0%) |
| College or Associate's Degree | 3 (100.0%) | 0 (0.0%) |
| Bachelor's Degree | 0 (0.0%) | 0 (0.0%) |
| Graduate Degree | 0 (0.0%) | 0 (0.0%) |
| Total | 7 (87.5%) | 1 (12.5%) |
Income in Taloga
Income Overview in Taloga
Per Capita Income in Taloga is $24,794, while median incomes of families and households are $51,250 and $48,125 respectively.
| Characteristic | Number | Measure |
| Per Capita Income | 303 | $24,794 |
| Median Family Income | 56 | $51,250 |
| Mean Family Income | 56 | $72,084 |
| Median Household Income | 107 | $48,125 |
| Mean Household Income | 107 | $65,241 |
| Income Deficit | 56 | $0 |
| Wage / Income Gap (%) | 303 | 0.00% |
| Wage / Income Gap ($) | 303 | 100.00¢ per $1 |
| Gini / Inequality Index | 303 | 0.45 |
Earnings by Sex in Taloga
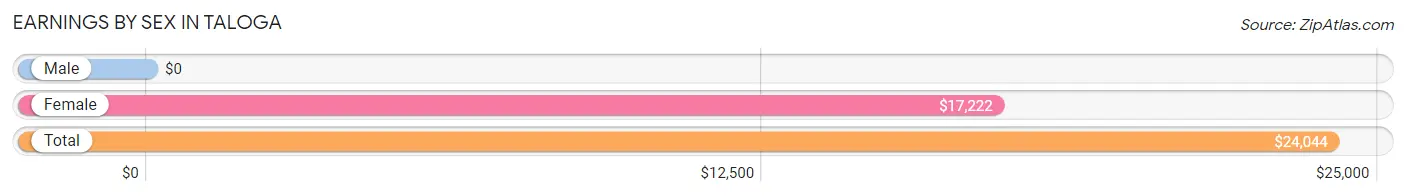
| Sex | Number | Average Earnings |
| Male | 75 (53.2%) | $0 |
| Female | 66 (46.8%) | $17,222 |
| Total | 141 (100.0%) | $24,044 |
Earnings by Sex by Income Bracket in Taloga
The most common earnings brackets in Taloga are $75,000 to $99,999 for men (19 | 25.3%) and $15,000 to $17,499 for women (18 | 27.3%).
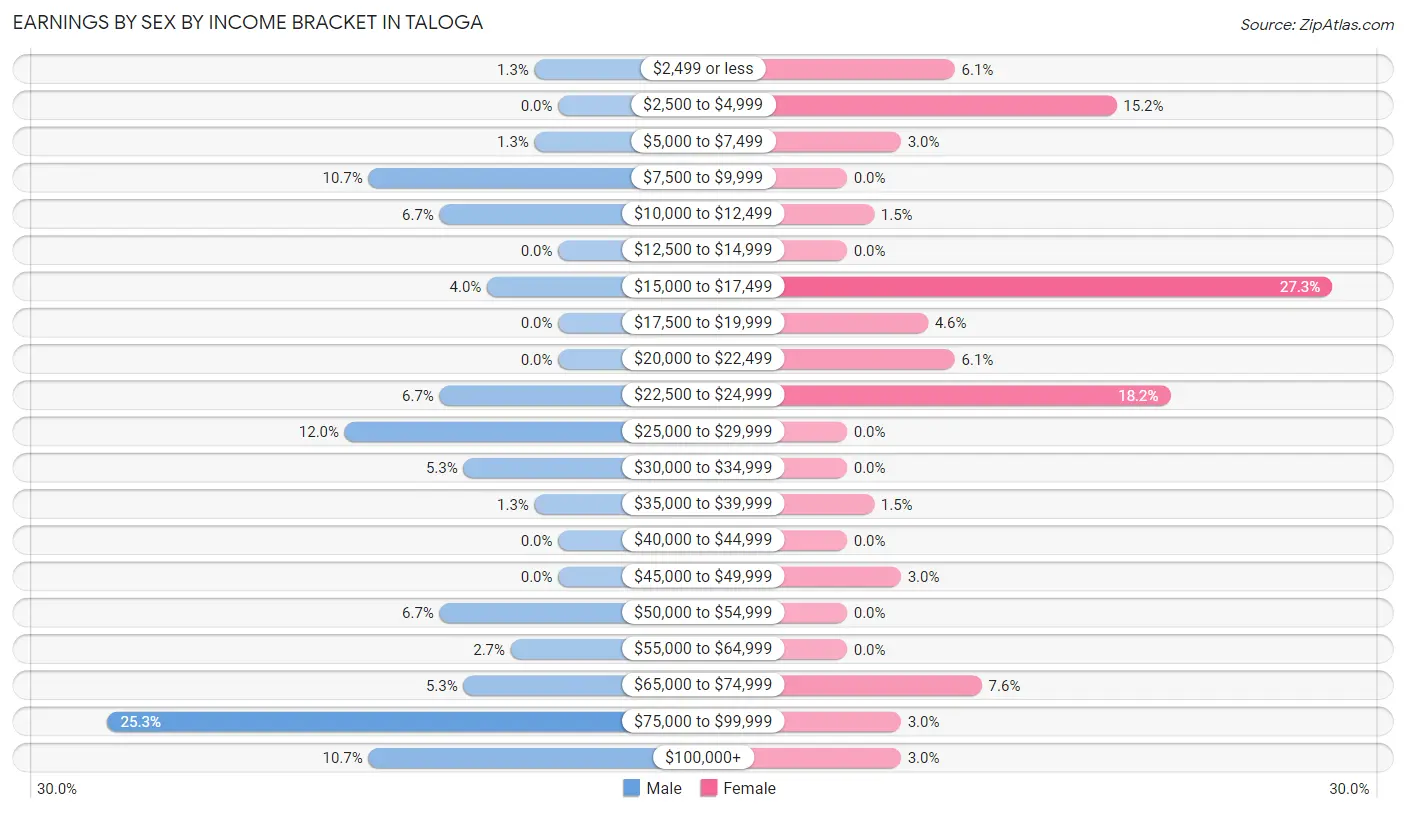
| Income | Male | Female |
| $2,499 or less | 1 (1.3%) | 4 (6.1%) |
| $2,500 to $4,999 | 0 (0.0%) | 10 (15.1%) |
| $5,000 to $7,499 | 1 (1.3%) | 2 (3.0%) |
| $7,500 to $9,999 | 8 (10.7%) | 0 (0.0%) |
| $10,000 to $12,499 | 5 (6.7%) | 1 (1.5%) |
| $12,500 to $14,999 | 0 (0.0%) | 0 (0.0%) |
| $15,000 to $17,499 | 3 (4.0%) | 18 (27.3%) |
| $17,500 to $19,999 | 0 (0.0%) | 3 (4.5%) |
| $20,000 to $22,499 | 0 (0.0%) | 4 (6.1%) |
| $22,500 to $24,999 | 5 (6.7%) | 12 (18.2%) |
| $25,000 to $29,999 | 9 (12.0%) | 0 (0.0%) |
| $30,000 to $34,999 | 4 (5.3%) | 0 (0.0%) |
| $35,000 to $39,999 | 1 (1.3%) | 1 (1.5%) |
| $40,000 to $44,999 | 0 (0.0%) | 0 (0.0%) |
| $45,000 to $49,999 | 0 (0.0%) | 2 (3.0%) |
| $50,000 to $54,999 | 5 (6.7%) | 0 (0.0%) |
| $55,000 to $64,999 | 2 (2.7%) | 0 (0.0%) |
| $65,000 to $74,999 | 4 (5.3%) | 5 (7.6%) |
| $75,000 to $99,999 | 19 (25.3%) | 2 (3.0%) |
| $100,000+ | 8 (10.7%) | 2 (3.0%) |
| Total | 75 (100.0%) | 66 (100.0%) |
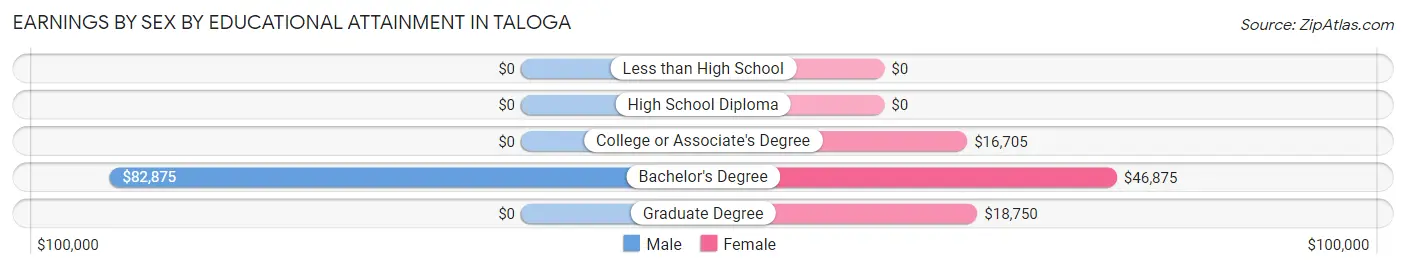
Earnings by Sex by Educational Attainment in Taloga
Average earnings in Taloga are $53,500 for men and $17,083 for women, a difference of 68.1%. Men with an educational attainment of bachelor's degree enjoy the highest average annual earnings of $82,875, while those with bachelor's degree education earn the least with $82,875. Women with an educational attainment of bachelor's degree earn the most with the average annual earnings of $46,875, while those with college or associate's degree education have the smallest earnings of $16,705.
| Educational Attainment | Male Income | Female Income |
| Less than High School | - | - |
| High School Diploma | - | - |
| College or Associate's Degree | - | - |
| Bachelor's Degree | $82,875 | $46,875 |
| Graduate Degree | - | - |
| Total | $53,500 | $17,083 |
Family Income in Taloga
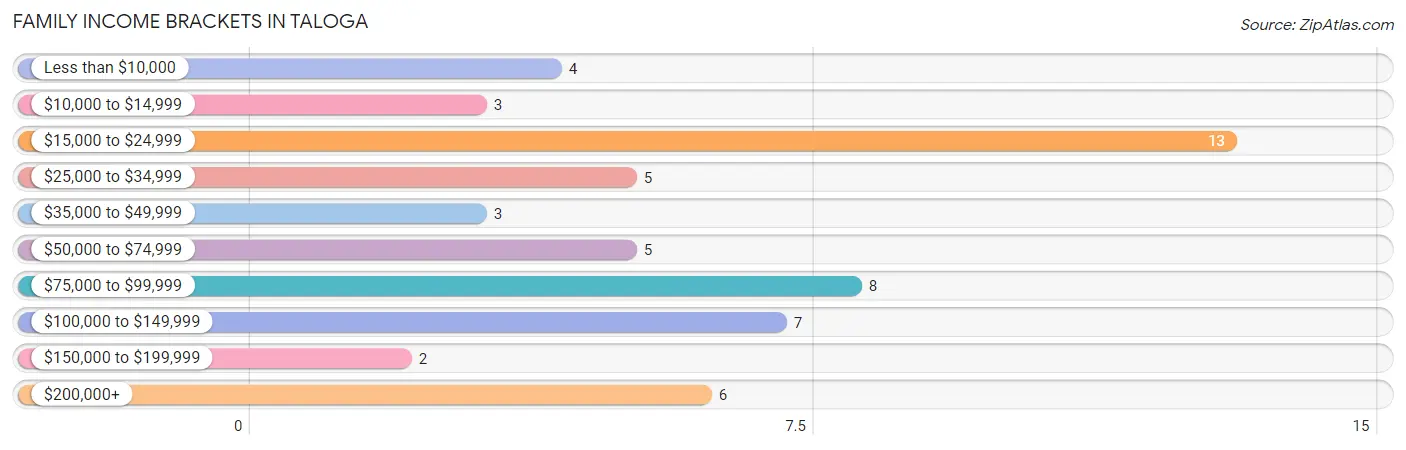
Family Income Brackets in Taloga
According to the Taloga family income data, there are 13 families falling into the $15,000 to $24,999 income range, which is the most common income bracket and makes up 23.2% of all families. Conversely, the $150,000 to $199,999 income bracket is the least frequent group with only 2 families (3.6%) belonging to this category.
| Income Bracket | # Families | % Families |
| Less than $10,000 | 4 | 7.1% |
| $10,000 to $14,999 | 3 | 5.4% |
| $15,000 to $24,999 | 13 | 23.2% |
| $25,000 to $34,999 | 5 | 8.9% |
| $35,000 to $49,999 | 3 | 5.4% |
| $50,000 to $74,999 | 5 | 8.9% |
| $75,000 to $99,999 | 8 | 14.3% |
| $100,000 to $149,999 | 7 | 12.5% |
| $150,000 to $199,999 | 2 | 3.6% |
| $200,000+ | 6 | 10.7% |
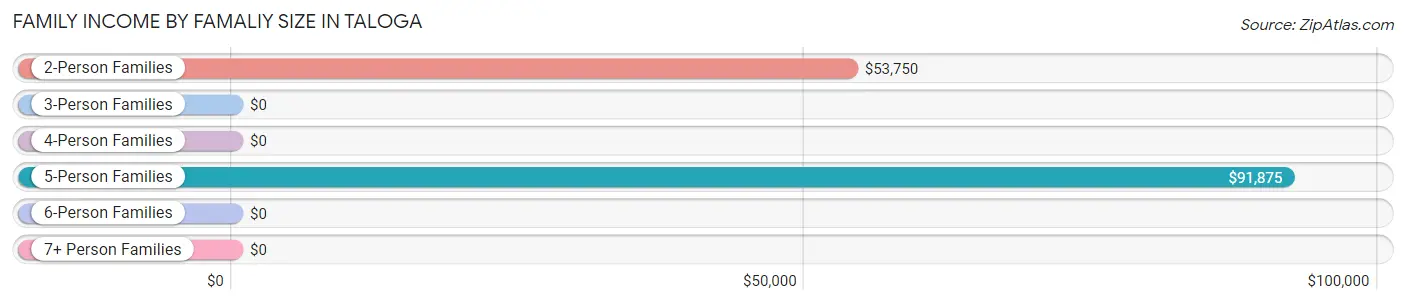
Family Income by Famaliy Size in Taloga
5-person families (5 | 8.9%) account for the highest median family income in Taloga with $91,875 per family, while 2-person families (43 | 76.8%) have the highest median income of $26,875 per family member.
| Income Bracket | # Families | Median Income |
| 2-Person Families | 43 (76.8%) | $53,750 |
| 3-Person Families | 6 (10.7%) | $0 |
| 4-Person Families | 2 (3.6%) | $0 |
| 5-Person Families | 5 (8.9%) | $91,875 |
| 6-Person Families | 0 (0.0%) | $0 |
| 7+ Person Families | 0 (0.0%) | $0 |
| Total | 56 (100.0%) | $51,250 |
Family Income by Number of Earners in Taloga
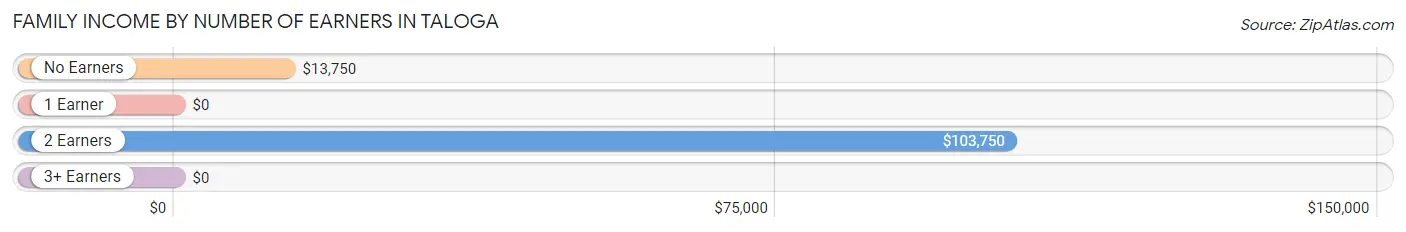
| Number of Earners | # Families | Median Income |
| No Earners | 11 (19.6%) | $13,750 |
| 1 Earner | 23 (41.1%) | $0 |
| 2 Earners | 21 (37.5%) | $103,750 |
| 3+ Earners | 1 (1.8%) | $0 |
| Total | 56 (100.0%) | $51,250 |
Household Income in Taloga
Household Income Brackets in Taloga
With 22 households falling in the category, the $100,000 to $149,999 income range is the most frequent in Taloga, accounting for 20.6% of all households. In contrast, only 3 households (2.8%) fall into the $150,000 to $199,999 income bracket, making it the least populous group.
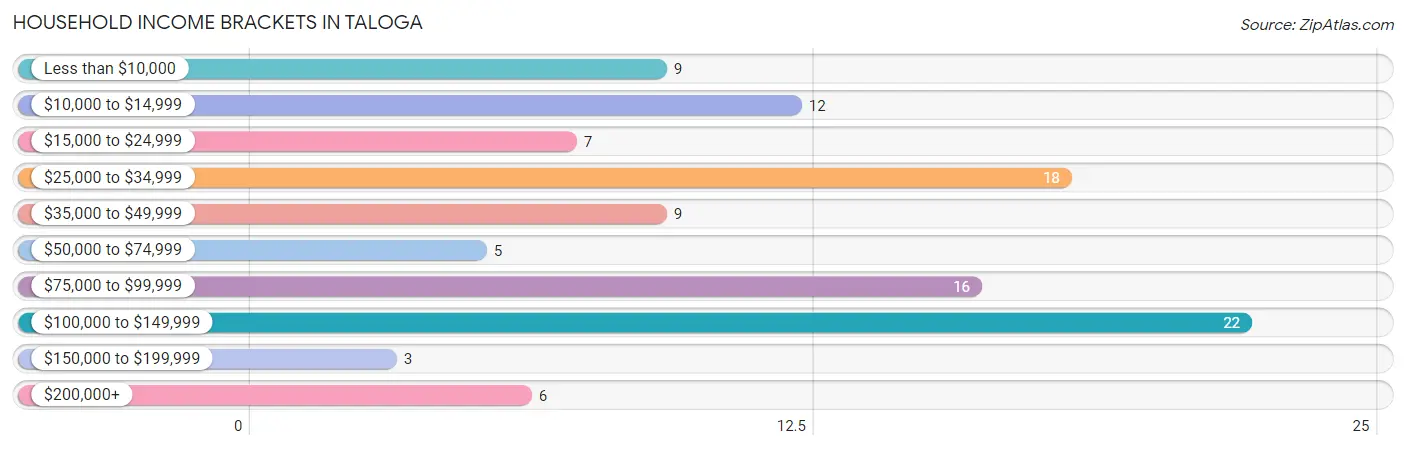
| Income Bracket | # Households | % Households |
| Less than $10,000 | 9 | 8.4% |
| $10,000 to $14,999 | 12 | 11.2% |
| $15,000 to $24,999 | 7 | 6.5% |
| $25,000 to $34,999 | 18 | 16.8% |
| $35,000 to $49,999 | 9 | 8.4% |
| $50,000 to $74,999 | 5 | 4.7% |
| $75,000 to $99,999 | 16 | 15.0% |
| $100,000 to $149,999 | 22 | 20.6% |
| $150,000 to $199,999 | 3 | 2.8% |
| $200,000+ | 6 | 5.6% |
Household Income by Householder Age in Taloga
The median household income in Taloga is $48,125, with the highest median household income of $100,547 found in the 25 to 44 years age bracket for the primary householder. A total of 31 households (29.0%) fall into this category. Meanwhile, the 15 to 24 years age bracket for the primary householder has the lowest median household income of $26,250, with 5 households (4.7%) in this group.
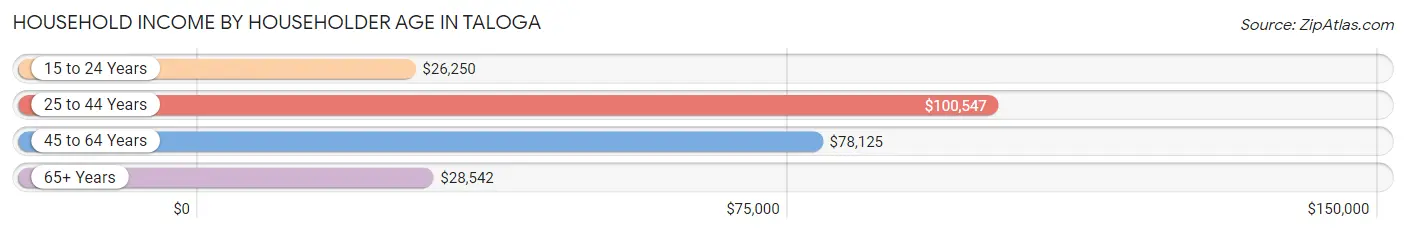
| Income Bracket | # Households | Median Income |
| 15 to 24 Years | 5 (4.7%) | $26,250 |
| 25 to 44 Years | 31 (29.0%) | $100,547 |
| 45 to 64 Years | 34 (31.8%) | $78,125 |
| 65+ Years | 37 (34.6%) | $28,542 |
| Total | 107 (100.0%) | $48,125 |
Poverty in Taloga
Income Below Poverty by Sex and Age in Taloga
With 31.2% poverty level for males and 21.0% for females among the residents of Taloga, 5 year old males and 25 to 34 year old females are the most vulnerable to poverty, with 14 males (77.8%) and 12 females (66.7%) in their respective age groups living below the poverty level.
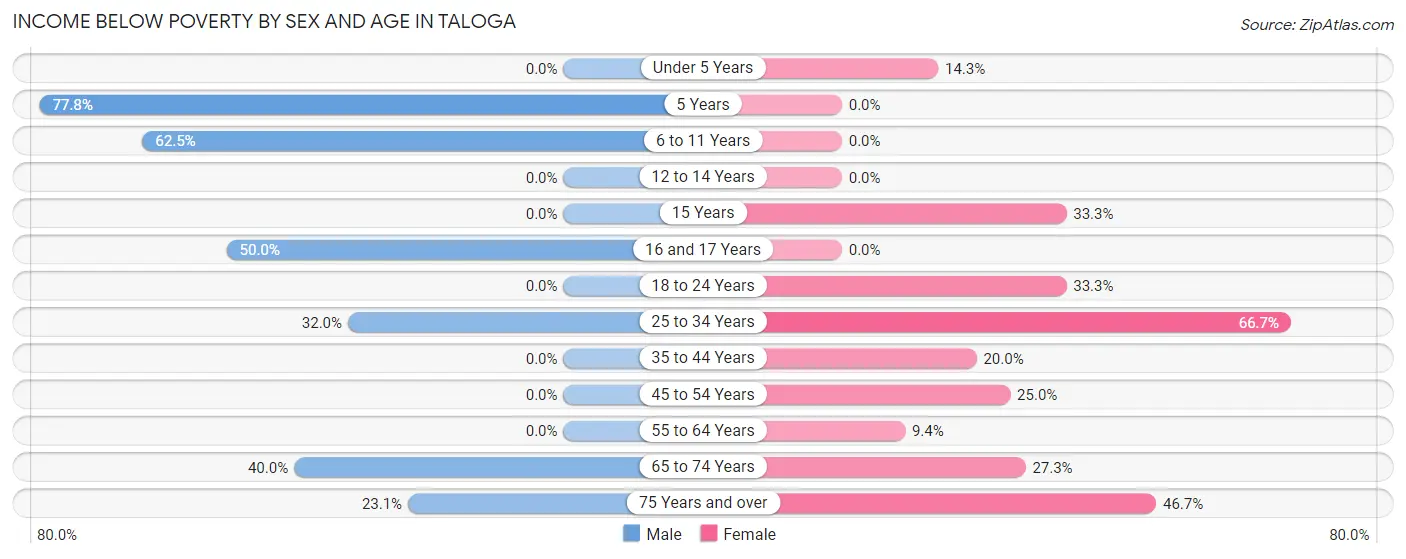
| Age Bracket | Male | Female |
| Under 5 Years | 0 (0.0%) | 2 (14.3%) |
| 5 Years | 14 (77.8%) | 0 (0.0%) |
| 6 to 11 Years | 5 (62.5%) | 0 (0.0%) |
| 12 to 14 Years | 0 (0.0%) | 0 (0.0%) |
| 15 Years | 0 (0.0%) | 2 (33.3%) |
| 16 and 17 Years | 1 (50.0%) | 0 (0.0%) |
| 18 to 24 Years | 0 (0.0%) | 2 (33.3%) |
| 25 to 34 Years | 8 (32.0%) | 12 (66.7%) |
| 35 to 44 Years | 0 (0.0%) | 1 (20.0%) |
| 45 to 54 Years | 0 (0.0%) | 2 (25.0%) |
| 55 to 64 Years | 0 (0.0%) | 3 (9.4%) |
| 65 to 74 Years | 8 (40.0%) | 3 (27.3%) |
| 75 Years and over | 3 (23.1%) | 7 (46.7%) |
| Total | 39 (31.2%) | 34 (21.0%) |
Income Above Poverty by Sex and Age in Taloga
According to the poverty statistics in Taloga, males aged under 5 years and females aged 6 to 11 years are the age groups that are most secure financially, with 100.0% of males and 100.0% of females in these age groups living above the poverty line.
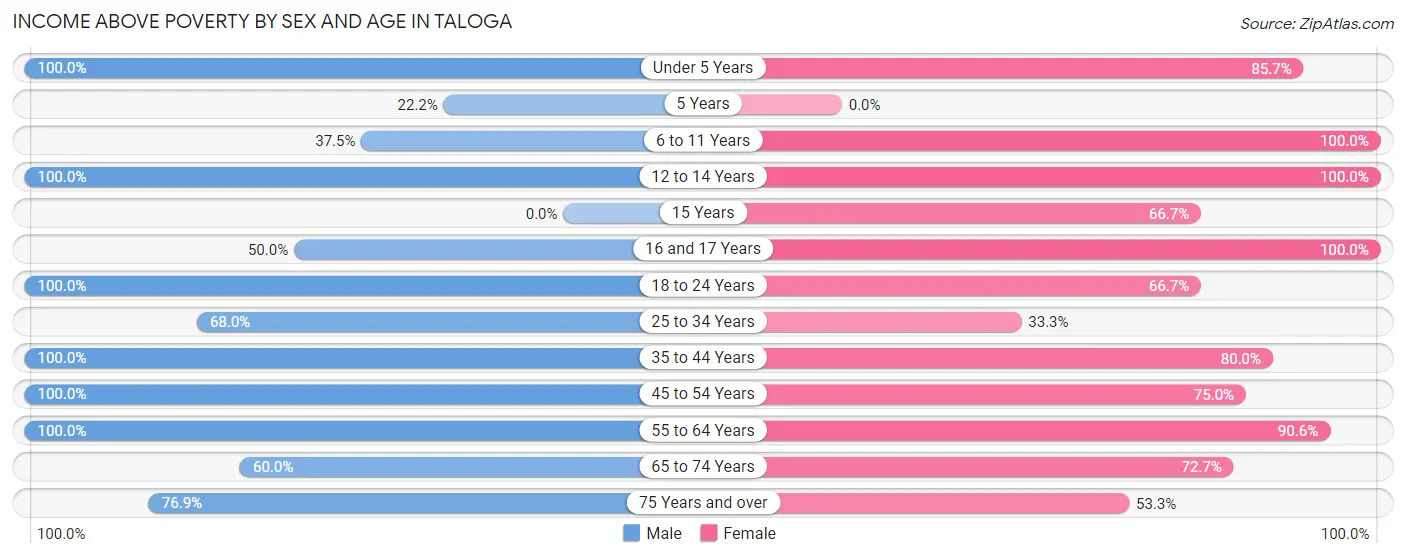
| Age Bracket | Male | Female |
| Under 5 Years | 3 (100.0%) | 12 (85.7%) |
| 5 Years | 4 (22.2%) | 0 (0.0%) |
| 6 to 11 Years | 3 (37.5%) | 5 (100.0%) |
| 12 to 14 Years | 2 (100.0%) | 41 (100.0%) |
| 15 Years | 0 (0.0%) | 4 (66.7%) |
| 16 and 17 Years | 1 (50.0%) | 1 (100.0%) |
| 18 to 24 Years | 2 (100.0%) | 4 (66.7%) |
| 25 to 34 Years | 17 (68.0%) | 6 (33.3%) |
| 35 to 44 Years | 12 (100.0%) | 4 (80.0%) |
| 45 to 54 Years | 10 (100.0%) | 6 (75.0%) |
| 55 to 64 Years | 10 (100.0%) | 29 (90.6%) |
| 65 to 74 Years | 12 (60.0%) | 8 (72.7%) |
| 75 Years and over | 10 (76.9%) | 8 (53.3%) |
| Total | 86 (68.8%) | 128 (79.0%) |
Income Below Poverty Among Married-Couple Families in Taloga
The poverty statistics for married-couple families in Taloga show that 8.6% or 3 of the total 35 families live below the poverty line. Families with no children have the highest poverty rate of 11.5%, comprising of 3 families. On the other hand, families with 1 or 2 children have the lowest poverty rate of 0.0%, which includes 0 families.
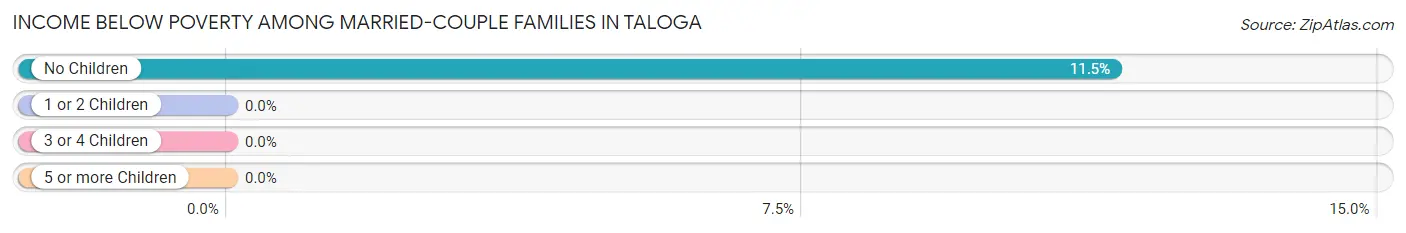
| Children | Above Poverty | Below Poverty |
| No Children | 23 (88.5%) | 3 (11.5%) |
| 1 or 2 Children | 5 (100.0%) | 0 (0.0%) |
| 3 or 4 Children | 4 (100.0%) | 0 (0.0%) |
| 5 or more Children | 0 (0.0%) | 0 (0.0%) |
| Total | 32 (91.4%) | 3 (8.6%) |
Income Below Poverty Among Single-Parent Households in Taloga
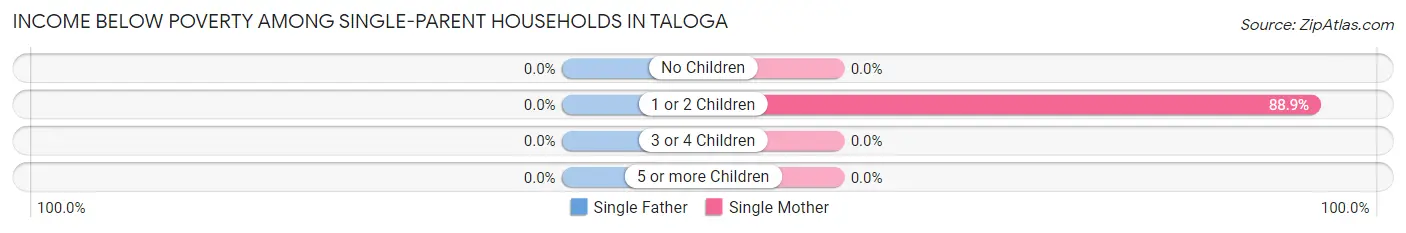
| Children | Single Father | Single Mother |
| No Children | 0 (0.0%) | 0 (0.0%) |
| 1 or 2 Children | 0 (0.0%) | 16 (88.9%) |
| 3 or 4 Children | 0 (0.0%) | 0 (0.0%) |
| 5 or more Children | 0 (0.0%) | 0 (0.0%) |
| Total | 0 (0.0%) | 16 (88.9%) |
Income Below Poverty Among Married-Couple vs Single-Parent Households in Taloga
The poverty data for Taloga shows that 3 of the married-couple family households (8.6%) and 16 of the single-parent households (76.2%) are living below the poverty level. Within the married-couple family households, those with no children have the highest poverty rate, with 3 households (11.5%) falling below the poverty line. Among the single-parent households, those with 1 or 2 children have the highest poverty rate, with 16 household (76.2%) living below poverty.
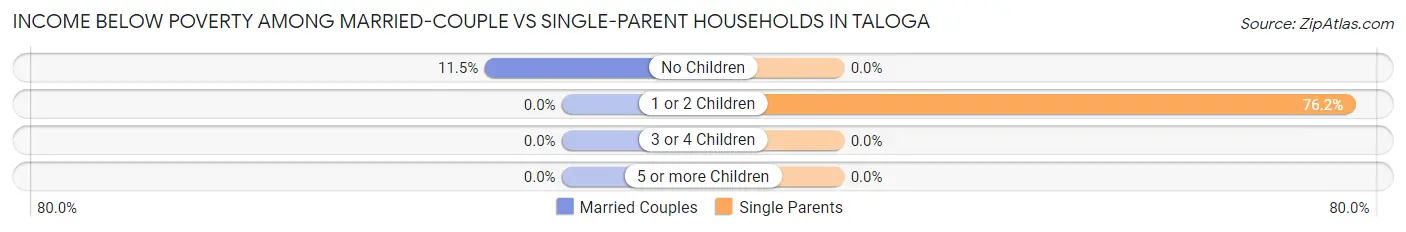
| Children | Married-Couple Families | Single-Parent Households |
| No Children | 3 (11.5%) | 0 (0.0%) |
| 1 or 2 Children | 0 (0.0%) | 16 (76.2%) |
| 3 or 4 Children | 0 (0.0%) | 0 (0.0%) |
| 5 or more Children | 0 (0.0%) | 0 (0.0%) |
| Total | 3 (8.6%) | 16 (76.2%) |
Employment Characteristics in Taloga
Employment by Class of Employer in Taloga
Among the 126 employed individuals in Taloga, private company employees (72 | 57.1%), state government employees (18 | 14.3%), and self-employed (not incorporated) (13 | 10.3%) make up the most common classes of employment.
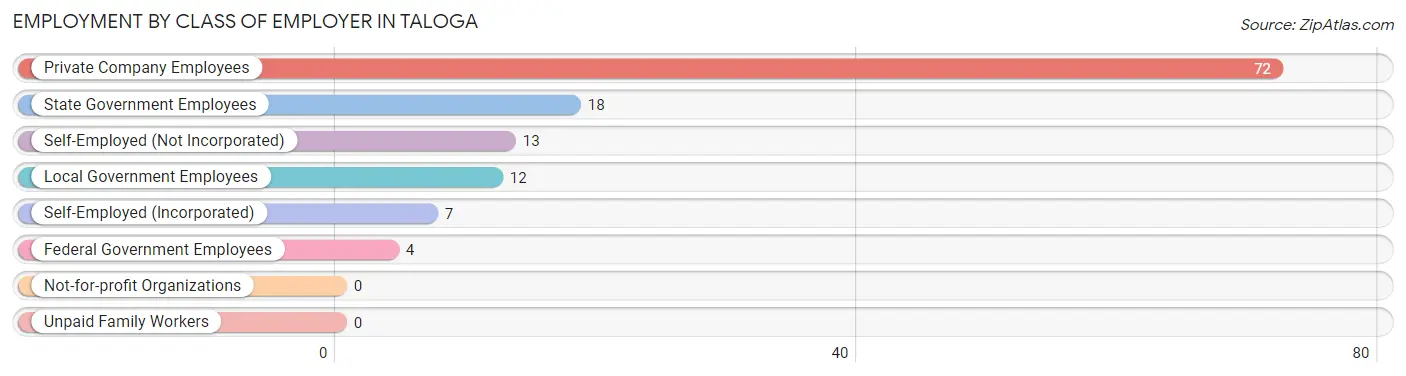
| Employer Class | # Employees | % Employees |
| Private Company Employees | 72 | 57.1% |
| Self-Employed (Incorporated) | 7 | 5.6% |
| Self-Employed (Not Incorporated) | 13 | 10.3% |
| Not-for-profit Organizations | 0 | 0.0% |
| Local Government Employees | 12 | 9.5% |
| State Government Employees | 18 | 14.3% |
| Federal Government Employees | 4 | 3.2% |
| Unpaid Family Workers | 0 | 0.0% |
| Total | 126 | 100.0% |
Employment Status by Age in Taloga
According to the labor force statistics for Taloga, out of the total population over 16 years of age (206), 61.7% or 127 individuals are in the labor force, with 0.8% or 1 of them unemployed. The age group with the highest labor force participation rate is 30 to 34 years, with 100.0% or 30 individuals in the labor force. Within the labor force, the 25 to 29 years age range has the highest percentage of unemployed individuals, with 9.1% or 1 of them being unemployed.
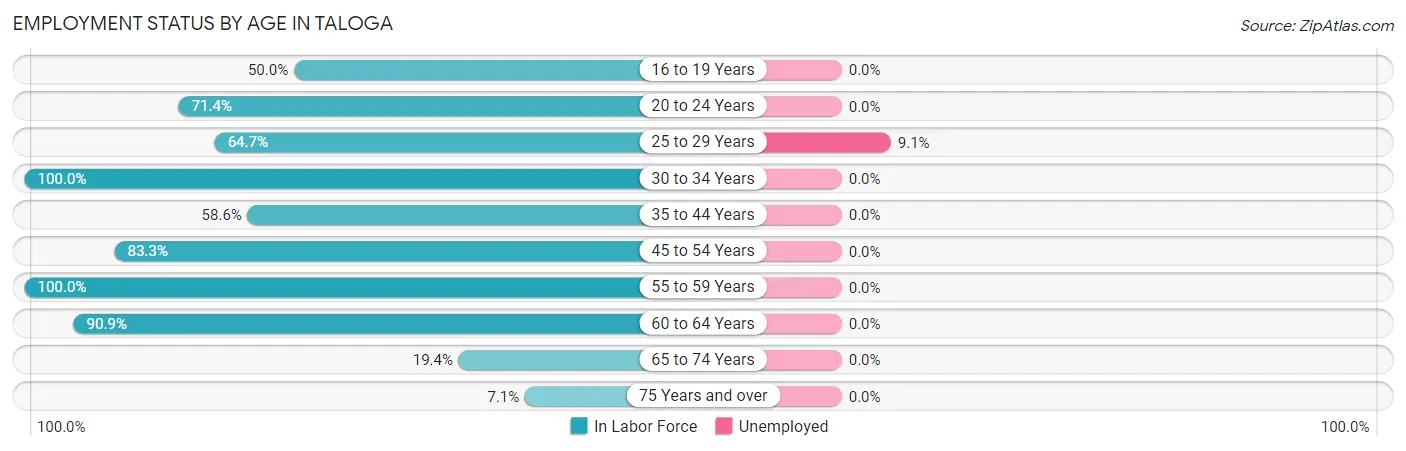
| Age Bracket | In Labor Force | Unemployed |
| 16 to 19 Years | 2 (50.0%) | 0 (0.0%) |
| 20 to 24 Years | 5 (71.4%) | 0 (0.0%) |
| 25 to 29 Years | 11 (64.7%) | 1 (9.1%) |
| 30 to 34 Years | 30 (100.0%) | 0 (0.0%) |
| 35 to 44 Years | 17 (58.6%) | 0 (0.0%) |
| 45 to 54 Years | 15 (83.3%) | 0 (0.0%) |
| 55 to 59 Years | 9 (100.0%) | 0 (0.0%) |
| 60 to 64 Years | 30 (90.9%) | 0 (0.0%) |
| 65 to 74 Years | 6 (19.4%) | 0 (0.0%) |
| 75 Years and over | 2 (7.1%) | 0 (0.0%) |
| Total | 127 (61.7%) | 1 (0.8%) |
Employment Status by Educational Attainment in Taloga
According to labor force statistics for Taloga, 82.4% of individuals (112) out of the total population between 25 and 64 years of age (136) are in the labor force, with 0.9% or 1 of them being unemployed. The group with the highest labor force participation rate are those with the educational attainment of bachelor's degree or higher, with 100.0% or 33 individuals in the labor force. Within the labor force, individuals with bachelor's degree or higher education have the highest percentage of unemployment, with 3.0% or 1 of them being unemployed.
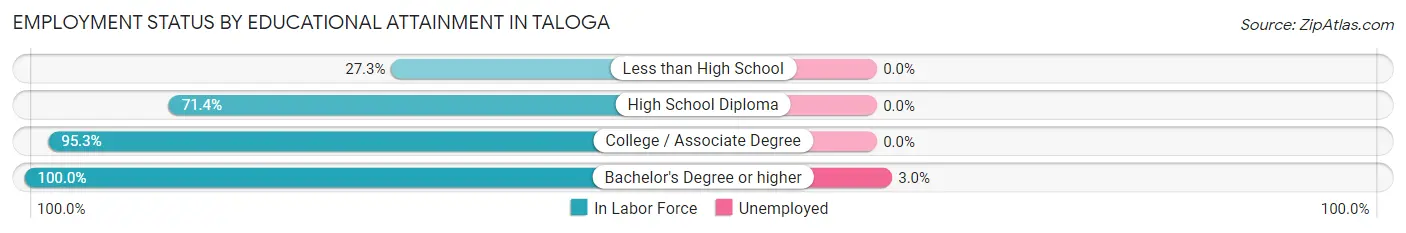
| Educational Attainment | In Labor Force | Unemployed |
| Less than High School | 3 (27.3%) | 0 (0.0%) |
| High School Diploma | 35 (71.4%) | 0 (0.0%) |
| College / Associate Degree | 41 (95.3%) | 0 (0.0%) |
| Bachelor's Degree or higher | 33 (100.0%) | 1 (3.0%) |
| Total | 112 (82.4%) | 1 (0.9%) |
Employment Occupations by Sex in Taloga
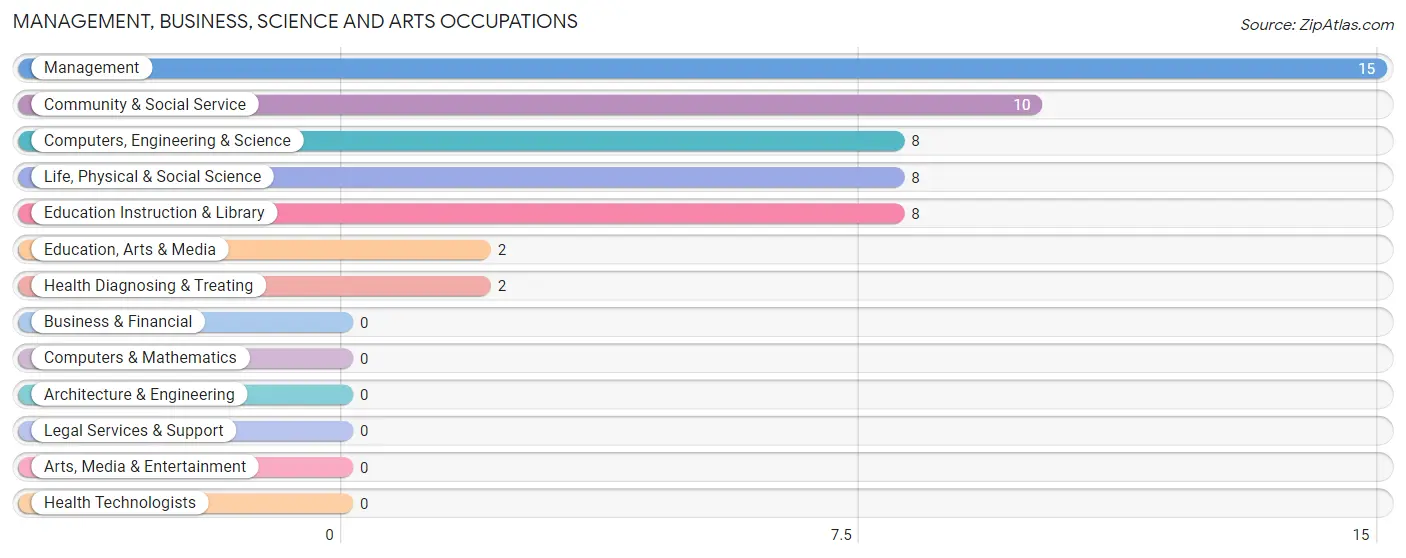
Management, Business, Science and Arts Occupations
The most common Management, Business, Science and Arts occupations in Taloga are Management (15 | 11.9%), Community & Social Service (10 | 7.9%), Computers, Engineering & Science (8 | 6.4%), Life, Physical & Social Science (8 | 6.4%), and Education Instruction & Library (8 | 6.4%).
Management, Business, Science and Arts Occupations by Sex
Within the Management, Business, Science and Arts occupations in Taloga, the most male-oriented occupations are Computers, Engineering & Science (100.0%), Life, Physical & Social Science (100.0%), and Education, Arts & Media (100.0%), while the most female-oriented occupations are Health Diagnosing & Treating (100.0%), Education Instruction & Library (75.0%), and Community & Social Service (60.0%).
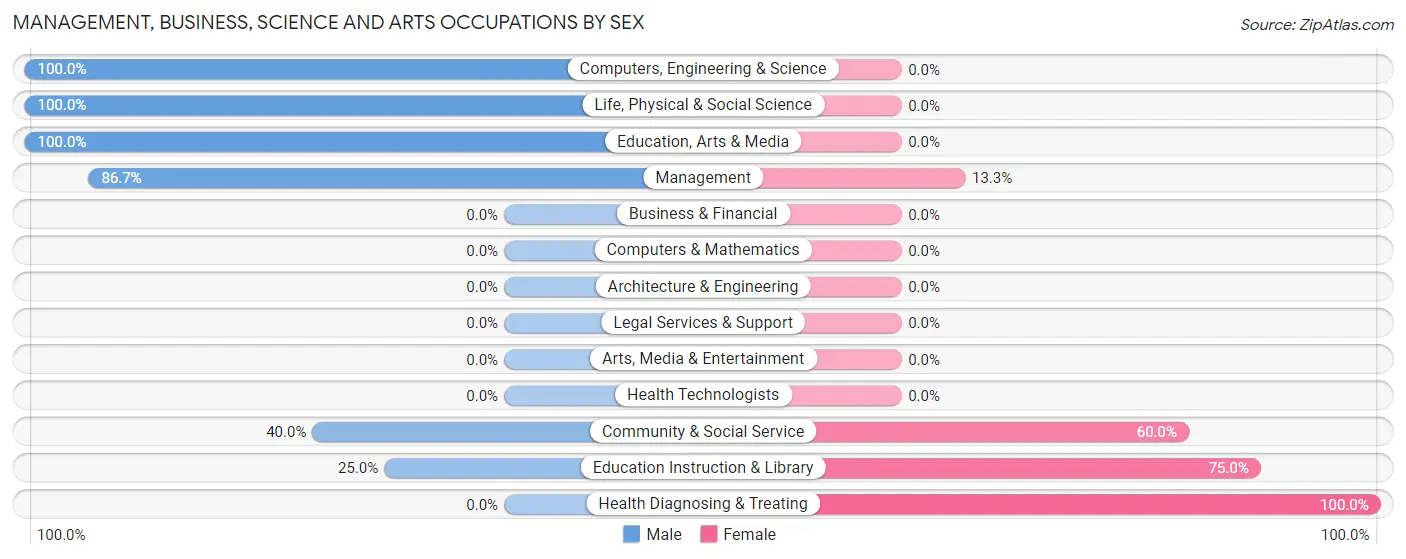
| Occupation | Male | Female |
| Management | 13 (86.7%) | 2 (13.3%) |
| Business & Financial | 0 (0.0%) | 0 (0.0%) |
| Computers, Engineering & Science | 8 (100.0%) | 0 (0.0%) |
| Computers & Mathematics | 0 (0.0%) | 0 (0.0%) |
| Architecture & Engineering | 0 (0.0%) | 0 (0.0%) |
| Life, Physical & Social Science | 8 (100.0%) | 0 (0.0%) |
| Community & Social Service | 4 (40.0%) | 6 (60.0%) |
| Education, Arts & Media | 2 (100.0%) | 0 (0.0%) |
| Legal Services & Support | 0 (0.0%) | 0 (0.0%) |
| Education Instruction & Library | 2 (25.0%) | 6 (75.0%) |
| Arts, Media & Entertainment | 0 (0.0%) | 0 (0.0%) |
| Health Diagnosing & Treating | 0 (0.0%) | 2 (100.0%) |
| Health Technologists | 0 (0.0%) | 0 (0.0%) |
| Total (Category) | 25 (71.4%) | 10 (28.6%) |
| Total (Overall) | 64 (50.8%) | 62 (49.2%) |
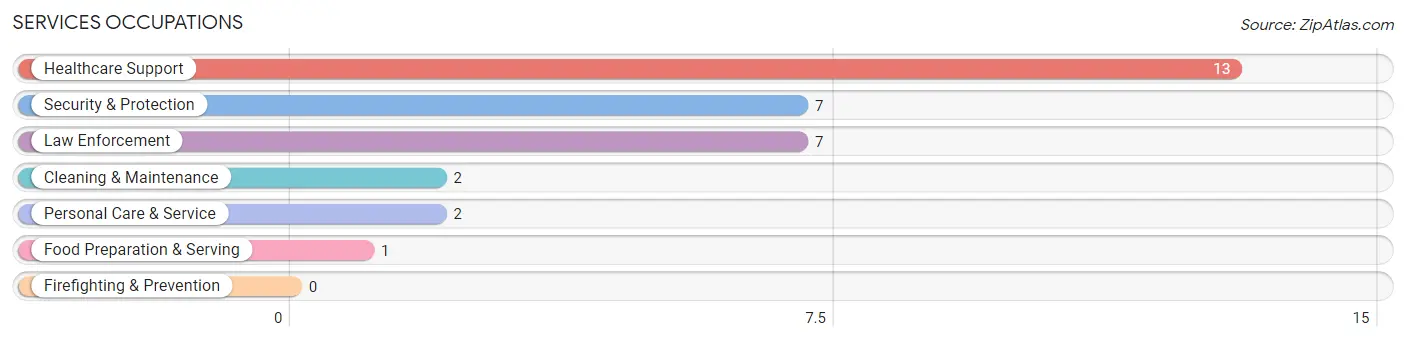
Services Occupations
The most common Services occupations in Taloga are Healthcare Support (13 | 10.3%), Security & Protection (7 | 5.6%), Law Enforcement (7 | 5.6%), Cleaning & Maintenance (2 | 1.6%), and Personal Care & Service (2 | 1.6%).
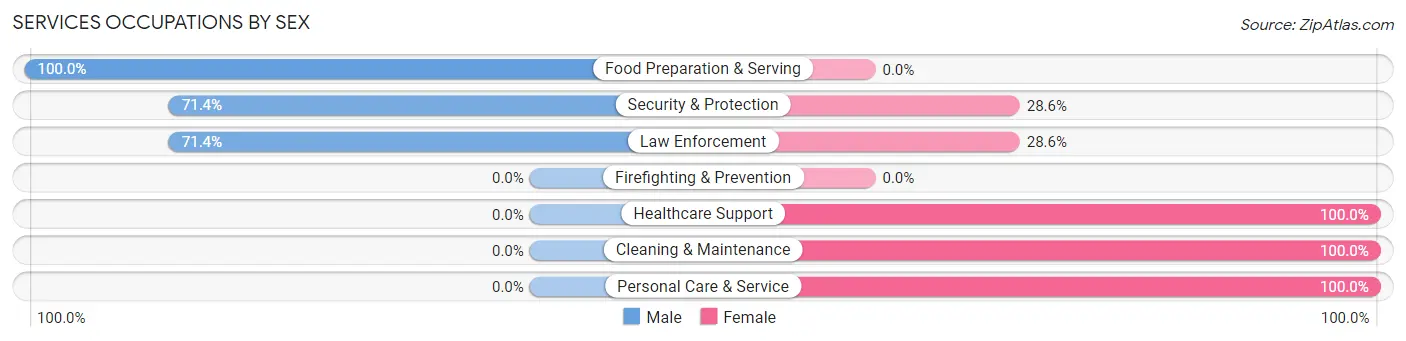
Services Occupations by Sex
Within the Services occupations in Taloga, the most male-oriented occupations are Food Preparation & Serving (100.0%), Security & Protection (71.4%), and Law Enforcement (71.4%), while the most female-oriented occupations are Healthcare Support (100.0%), Cleaning & Maintenance (100.0%), and Personal Care & Service (100.0%).
| Occupation | Male | Female |
| Healthcare Support | 0 (0.0%) | 13 (100.0%) |
| Security & Protection | 5 (71.4%) | 2 (28.6%) |
| Firefighting & Prevention | 0 (0.0%) | 0 (0.0%) |
| Law Enforcement | 5 (71.4%) | 2 (28.6%) |
| Food Preparation & Serving | 1 (100.0%) | 0 (0.0%) |
| Cleaning & Maintenance | 0 (0.0%) | 2 (100.0%) |
| Personal Care & Service | 0 (0.0%) | 2 (100.0%) |
| Total (Category) | 6 (24.0%) | 19 (76.0%) |
| Total (Overall) | 64 (50.8%) | 62 (49.2%) |
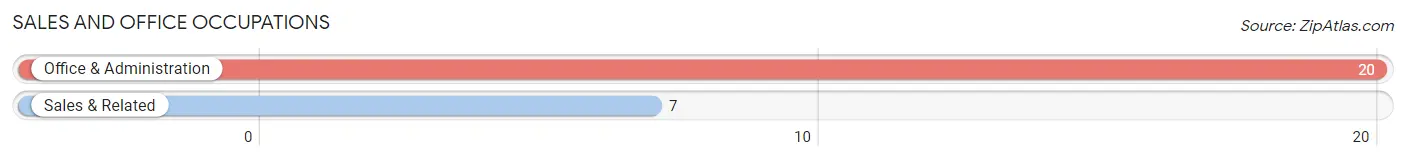
Sales and Office Occupations
The most common Sales and Office occupations in Taloga are Office & Administration (20 | 15.9%), and Sales & Related (7 | 5.6%).
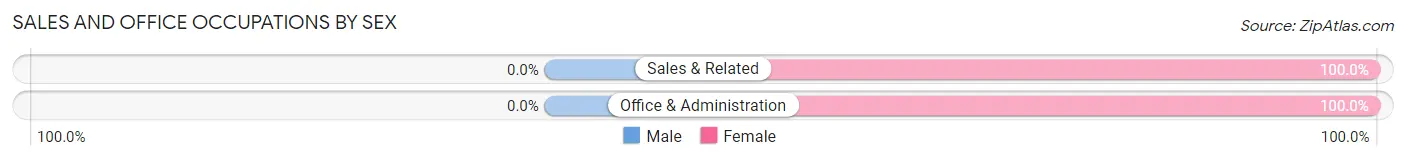
Sales and Office Occupations by Sex
| Occupation | Male | Female |
| Sales & Related | 0 (0.0%) | 7 (100.0%) |
| Office & Administration | 0 (0.0%) | 20 (100.0%) |
| Total (Category) | 0 (0.0%) | 27 (100.0%) |
| Total (Overall) | 64 (50.8%) | 62 (49.2%) |
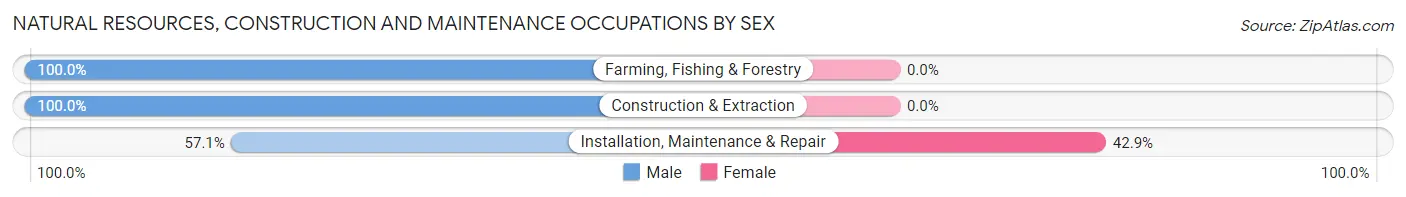
Natural Resources, Construction and Maintenance Occupations
The most common Natural Resources, Construction and Maintenance occupations in Taloga are Construction & Extraction (7 | 5.6%), Installation, Maintenance & Repair (7 | 5.6%), and Farming, Fishing & Forestry (1 | 0.8%).

Natural Resources, Construction and Maintenance Occupations by Sex
| Occupation | Male | Female |
| Farming, Fishing & Forestry | 1 (100.0%) | 0 (0.0%) |
| Construction & Extraction | 7 (100.0%) | 0 (0.0%) |
| Installation, Maintenance & Repair | 4 (57.1%) | 3 (42.9%) |
| Total (Category) | 12 (80.0%) | 3 (20.0%) |
| Total (Overall) | 64 (50.8%) | 62 (49.2%) |
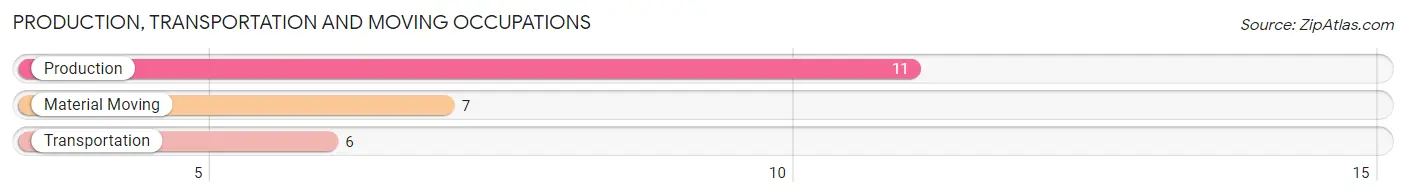
Production, Transportation and Moving Occupations
The most common Production, Transportation and Moving occupations in Taloga are Production (11 | 8.7%), Material Moving (7 | 5.6%), and Transportation (6 | 4.8%).
Production, Transportation and Moving Occupations by Sex
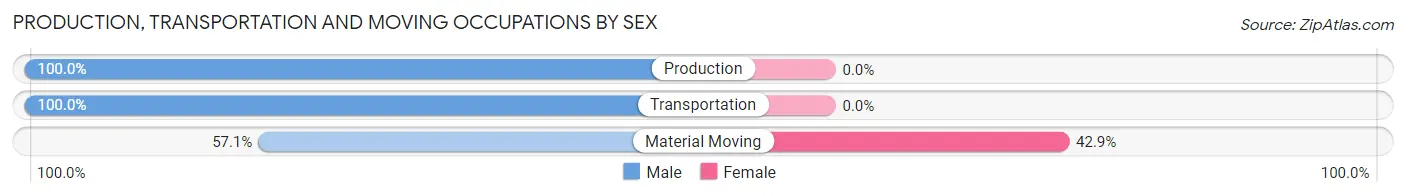
| Occupation | Male | Female |
| Production | 11 (100.0%) | 0 (0.0%) |
| Transportation | 6 (100.0%) | 0 (0.0%) |
| Material Moving | 4 (57.1%) | 3 (42.9%) |
| Total (Category) | 21 (87.5%) | 3 (12.5%) |
| Total (Overall) | 64 (50.8%) | 62 (49.2%) |
Employment Industries by Sex in Taloga
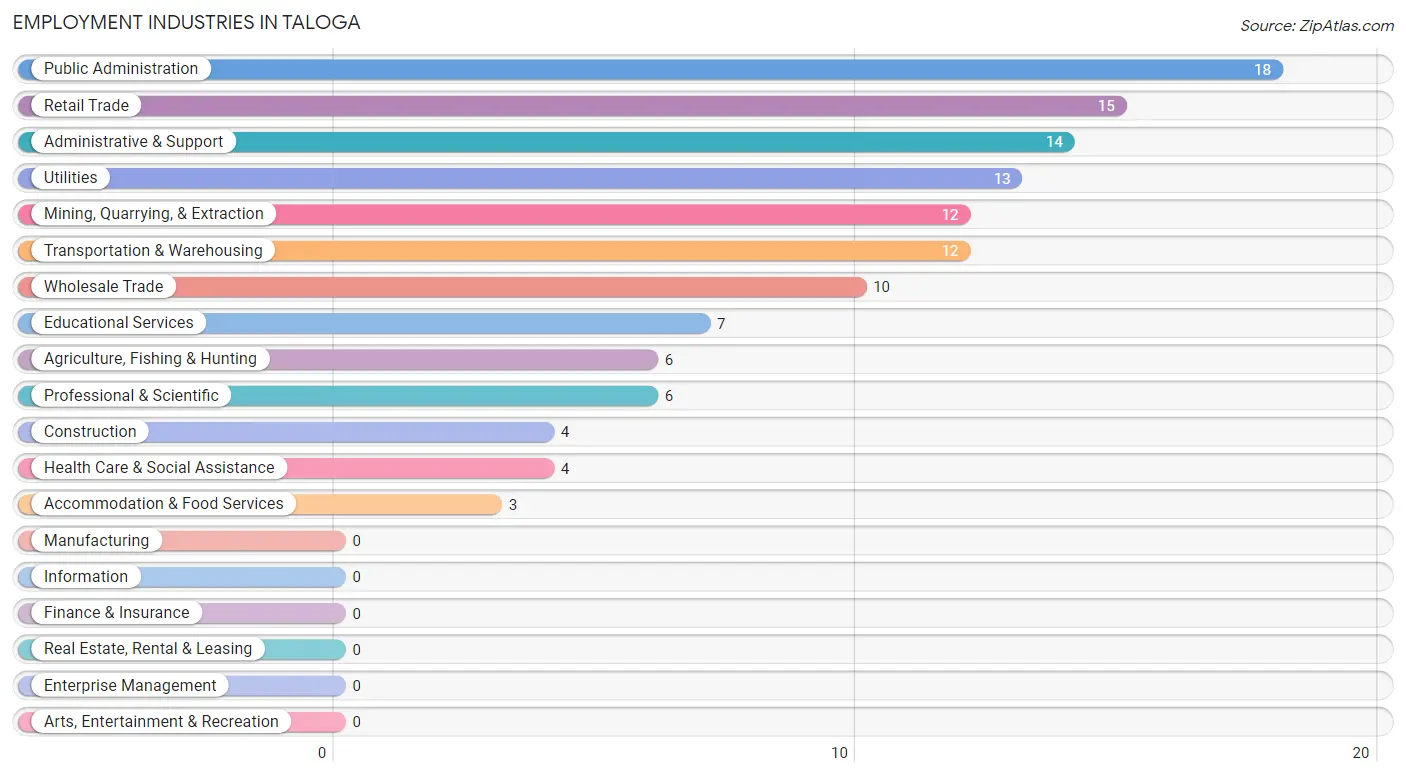
Employment Industries in Taloga
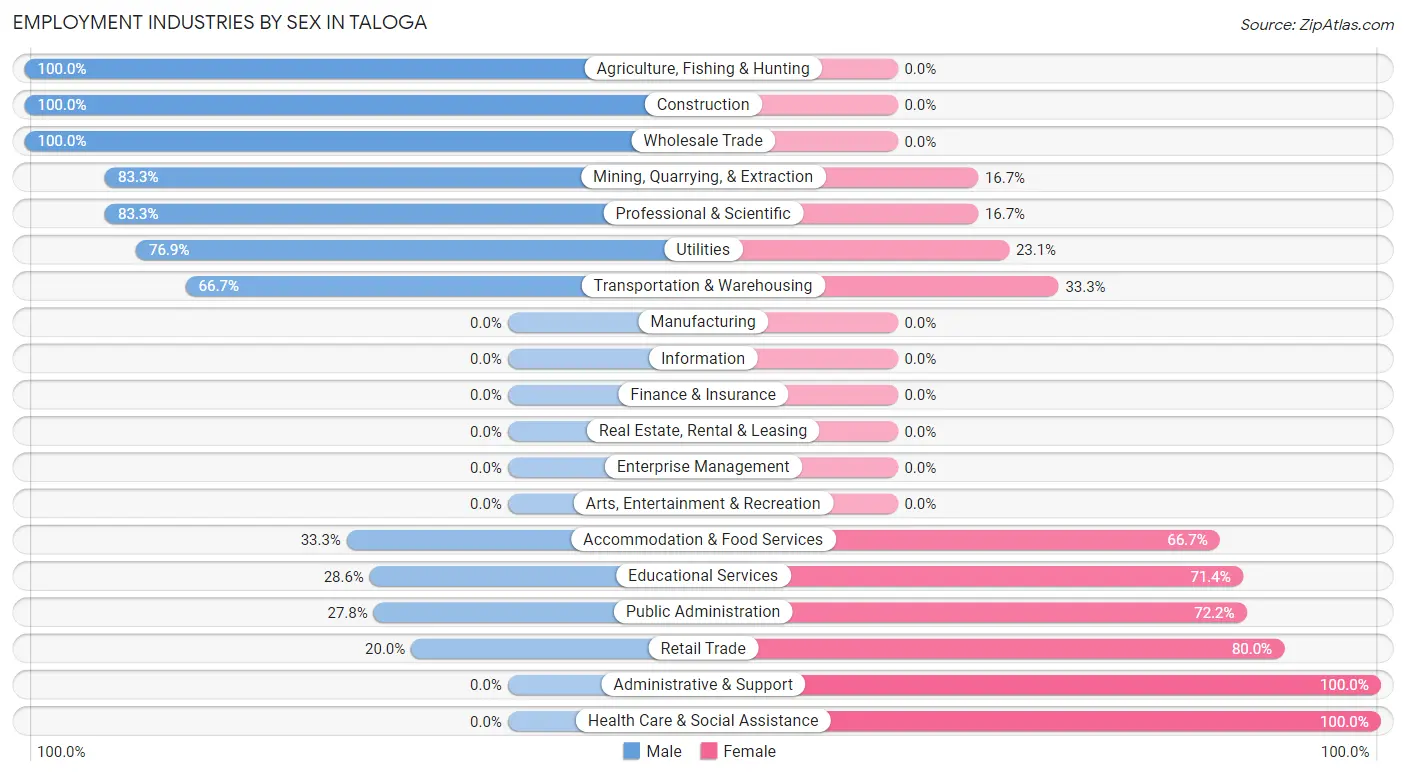
The major employment industries in Taloga include Public Administration (18 | 14.3%), Retail Trade (15 | 11.9%), Administrative & Support (14 | 11.1%), Utilities (13 | 10.3%), and Mining, Quarrying, & Extraction (12 | 9.5%).
Employment Industries by Sex in Taloga
The Taloga industries that see more men than women are Agriculture, Fishing & Hunting (100.0%), Construction (100.0%), and Wholesale Trade (100.0%), whereas the industries that tend to have a higher number of women are Administrative & Support (100.0%), Health Care & Social Assistance (100.0%), and Retail Trade (80.0%).
| Industry | Male | Female |
| Agriculture, Fishing & Hunting | 6 (100.0%) | 0 (0.0%) |
| Mining, Quarrying, & Extraction | 10 (83.3%) | 2 (16.7%) |
| Construction | 4 (100.0%) | 0 (0.0%) |
| Manufacturing | 0 (0.0%) | 0 (0.0%) |
| Wholesale Trade | 10 (100.0%) | 0 (0.0%) |
| Retail Trade | 3 (20.0%) | 12 (80.0%) |
| Transportation & Warehousing | 8 (66.7%) | 4 (33.3%) |
| Utilities | 10 (76.9%) | 3 (23.1%) |
| Information | 0 (0.0%) | 0 (0.0%) |
| Finance & Insurance | 0 (0.0%) | 0 (0.0%) |
| Real Estate, Rental & Leasing | 0 (0.0%) | 0 (0.0%) |
| Professional & Scientific | 5 (83.3%) | 1 (16.7%) |
| Enterprise Management | 0 (0.0%) | 0 (0.0%) |
| Administrative & Support | 0 (0.0%) | 14 (100.0%) |
| Educational Services | 2 (28.6%) | 5 (71.4%) |
| Health Care & Social Assistance | 0 (0.0%) | 4 (100.0%) |
| Arts, Entertainment & Recreation | 0 (0.0%) | 0 (0.0%) |
| Accommodation & Food Services | 1 (33.3%) | 2 (66.7%) |
| Public Administration | 5 (27.8%) | 13 (72.2%) |
| Total | 64 (50.8%) | 62 (49.2%) |
Education in Taloga
School Enrollment in Taloga
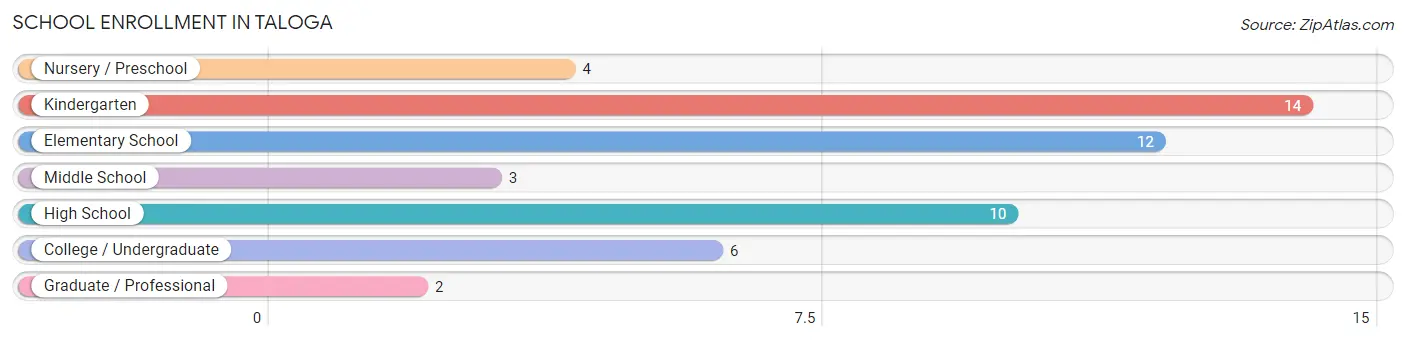
The most common levels of schooling among the 51 students in Taloga are kindergarten (14 | 27.5%), elementary school (12 | 23.5%), and high school (10 | 19.6%).
| School Level | # Students | % Students |
| Nursery / Preschool | 4 | 7.8% |
| Kindergarten | 14 | 27.5% |
| Elementary School | 12 | 23.5% |
| Middle School | 3 | 5.9% |
| High School | 10 | 19.6% |
| College / Undergraduate | 6 | 11.8% |
| Graduate / Professional | 2 | 3.9% |
| Total | 51 | 100.0% |
School Enrollment by Age by Funding Source in Taloga
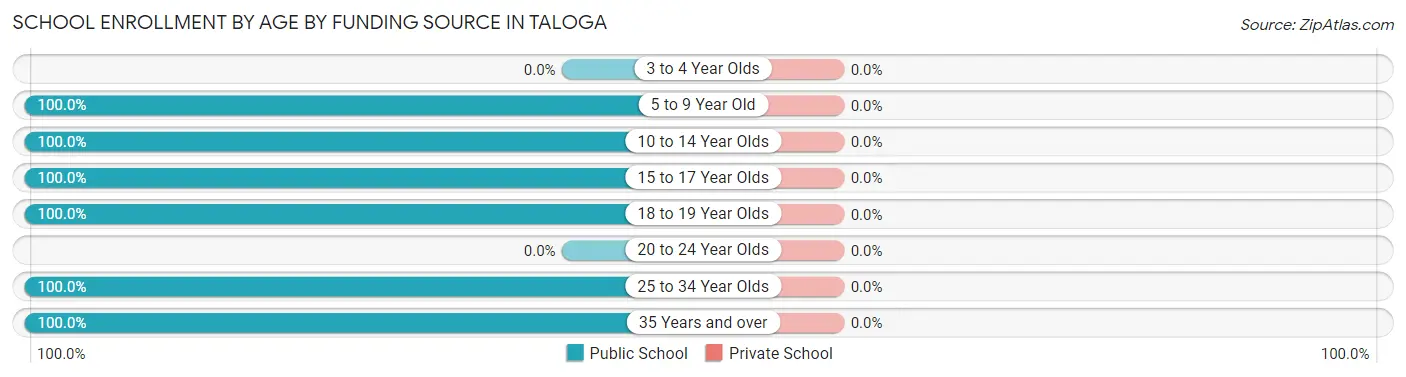
| Age Bracket | Public School | Private School |
| 3 to 4 Year Olds | 0 (0.0%) | 0 (0.0%) |
| 5 to 9 Year Old | 26 (100.0%) | 0 (0.0%) |
| 10 to 14 Year Olds | 7 (100.0%) | 0 (0.0%) |
| 15 to 17 Year Olds | 9 (100.0%) | 0 (0.0%) |
| 18 to 19 Year Olds | 1 (100.0%) | 0 (0.0%) |
| 20 to 24 Year Olds | 0 (0.0%) | 0 (0.0%) |
| 25 to 34 Year Olds | 7 (100.0%) | 0 (0.0%) |
| 35 Years and over | 1 (100.0%) | 0 (0.0%) |
| Total | 51 (100.0%) | 0 (0.0%) |
Educational Attainment by Field of Study in Taloga
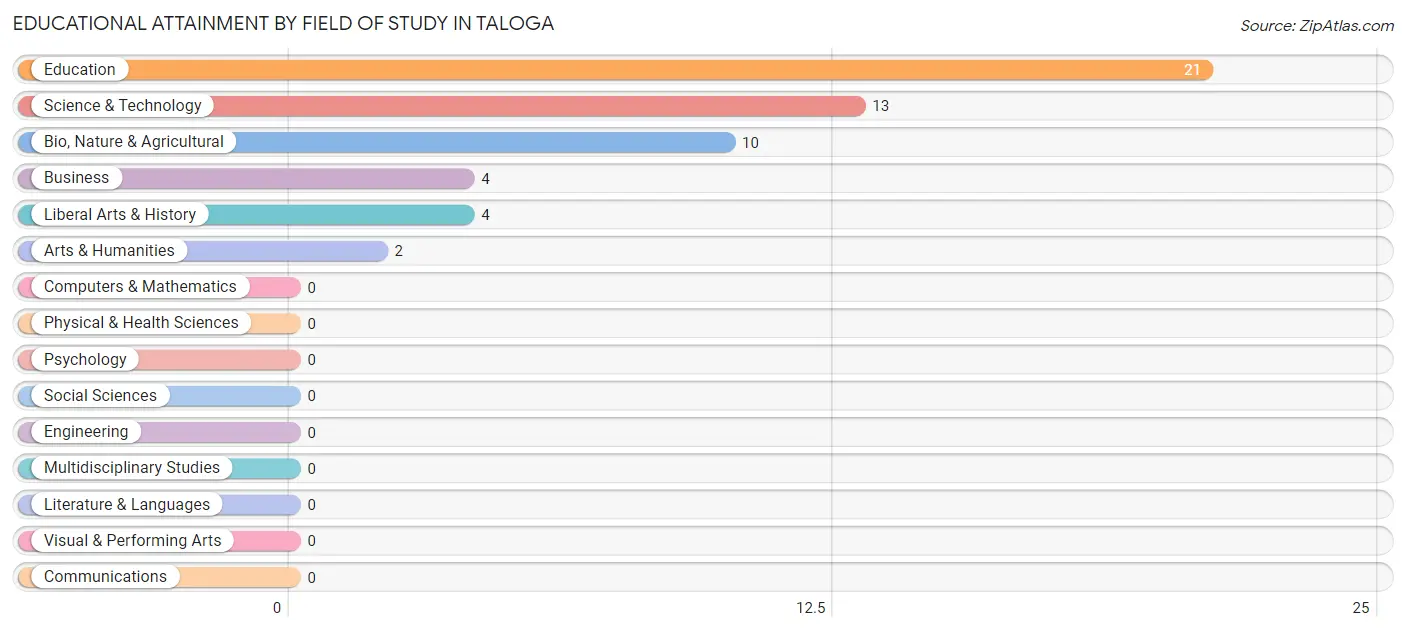
Education (21 | 38.9%), science & technology (13 | 24.1%), bio, nature & agricultural (10 | 18.5%), business (4 | 7.4%), and liberal arts & history (4 | 7.4%) are the most common fields of study among 54 individuals in Taloga who have obtained a bachelor's degree or higher.
| Field of Study | # Graduates | % Graduates |
| Computers & Mathematics | 0 | 0.0% |
| Bio, Nature & Agricultural | 10 | 18.5% |
| Physical & Health Sciences | 0 | 0.0% |
| Psychology | 0 | 0.0% |
| Social Sciences | 0 | 0.0% |
| Engineering | 0 | 0.0% |
| Multidisciplinary Studies | 0 | 0.0% |
| Science & Technology | 13 | 24.1% |
| Business | 4 | 7.4% |
| Education | 21 | 38.9% |
| Literature & Languages | 0 | 0.0% |
| Liberal Arts & History | 4 | 7.4% |
| Visual & Performing Arts | 0 | 0.0% |
| Communications | 0 | 0.0% |
| Arts & Humanities | 2 | 3.7% |
| Total | 54 | 100.0% |
Transportation & Commute in Taloga
Vehicle Availability by Sex in Taloga
The most prevalent vehicle ownership categories in Taloga are males with 3 vehicles (20, accounting for 31.2%) and females with 3 vehicles (28, making up 32.3%).
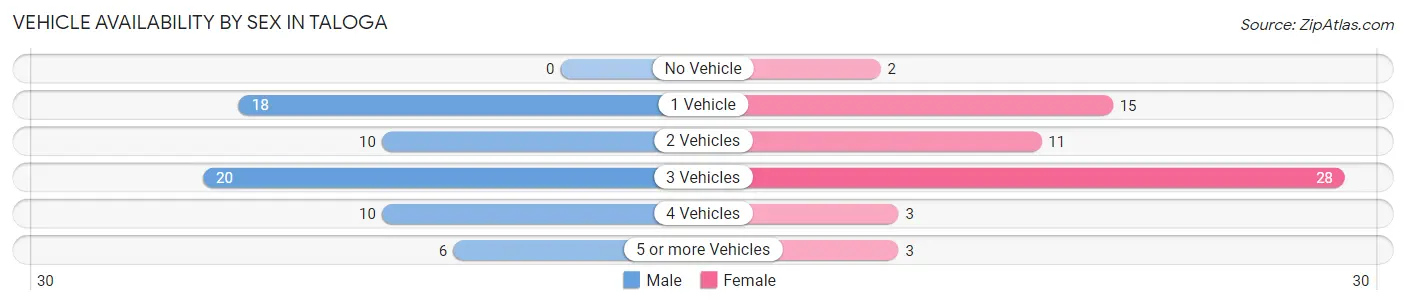
| Vehicles Available | Male | Female |
| No Vehicle | 0 (0.0%) | 2 (3.2%) |
| 1 Vehicle | 18 (28.1%) | 15 (24.2%) |
| 2 Vehicles | 10 (15.6%) | 11 (17.7%) |
| 3 Vehicles | 20 (31.2%) | 28 (45.2%) |
| 4 Vehicles | 10 (15.6%) | 3 (4.8%) |
| 5 or more Vehicles | 6 (9.4%) | 3 (4.8%) |
| Total | 64 (100.0%) | 62 (100.0%) |
Commute Time in Taloga
The most frequently occuring commute durations in Taloga are less than 5 minutes (40 commuters, 35.7%), 10 to 14 minutes (17 commuters, 15.2%), and 15 to 19 minutes (11 commuters, 9.8%).
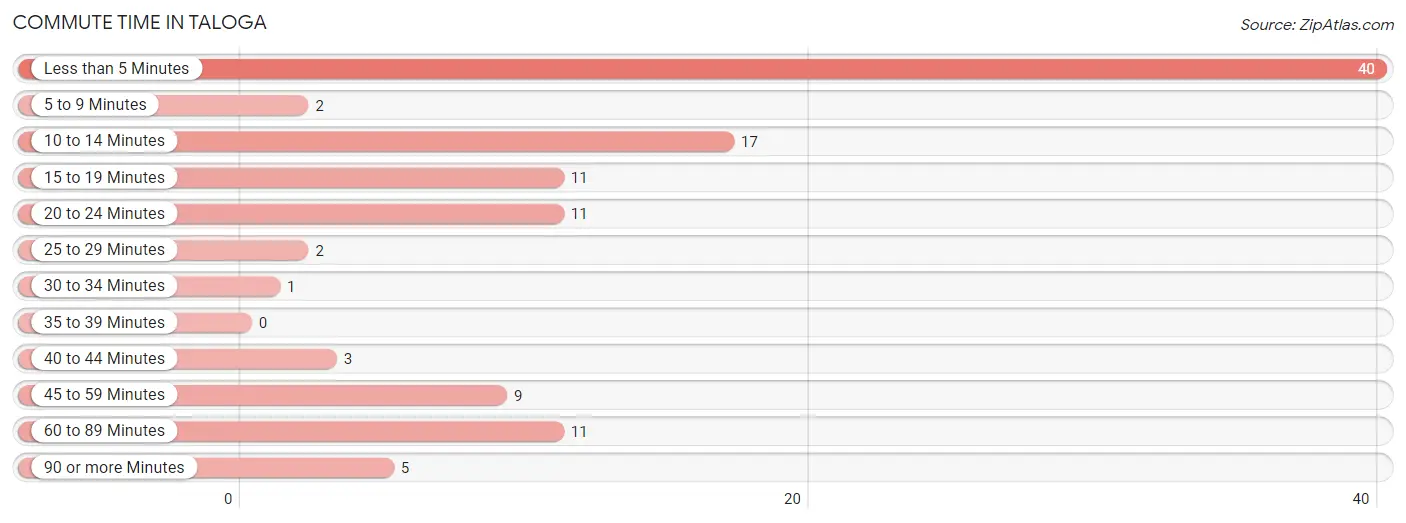
| Commute Time | # Commuters | % Commuters |
| Less than 5 Minutes | 40 | 35.7% |
| 5 to 9 Minutes | 2 | 1.8% |
| 10 to 14 Minutes | 17 | 15.2% |
| 15 to 19 Minutes | 11 | 9.8% |
| 20 to 24 Minutes | 11 | 9.8% |
| 25 to 29 Minutes | 2 | 1.8% |
| 30 to 34 Minutes | 1 | 0.9% |
| 35 to 39 Minutes | 0 | 0.0% |
| 40 to 44 Minutes | 3 | 2.7% |
| 45 to 59 Minutes | 9 | 8.0% |
| 60 to 89 Minutes | 11 | 9.8% |
| 90 or more Minutes | 5 | 4.5% |
Commute Time by Sex in Taloga
The most common commute times in Taloga are less than 5 minutes (16 commuters, 25.0%) for males and less than 5 minutes (24 commuters, 50.0%) for females.
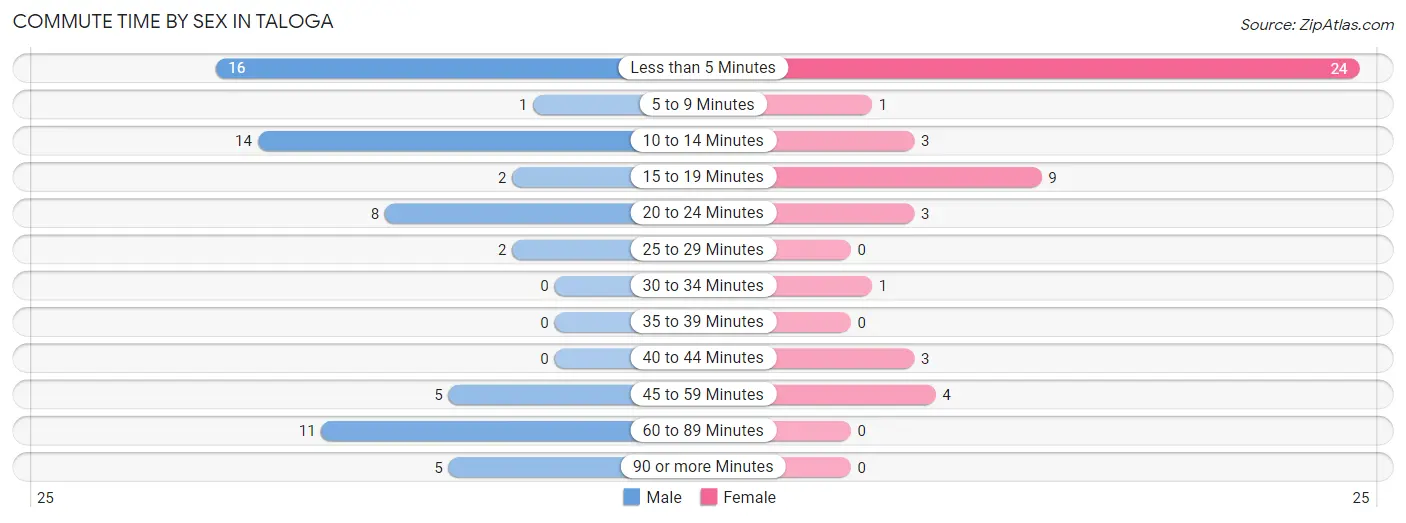
| Commute Time | Male | Female |
| Less than 5 Minutes | 16 (25.0%) | 24 (50.0%) |
| 5 to 9 Minutes | 1 (1.6%) | 1 (2.1%) |
| 10 to 14 Minutes | 14 (21.9%) | 3 (6.2%) |
| 15 to 19 Minutes | 2 (3.1%) | 9 (18.8%) |
| 20 to 24 Minutes | 8 (12.5%) | 3 (6.2%) |
| 25 to 29 Minutes | 2 (3.1%) | 0 (0.0%) |
| 30 to 34 Minutes | 0 (0.0%) | 1 (2.1%) |
| 35 to 39 Minutes | 0 (0.0%) | 0 (0.0%) |
| 40 to 44 Minutes | 0 (0.0%) | 3 (6.2%) |
| 45 to 59 Minutes | 5 (7.8%) | 4 (8.3%) |
| 60 to 89 Minutes | 11 (17.2%) | 0 (0.0%) |
| 90 or more Minutes | 5 (7.8%) | 0 (0.0%) |
Time of Departure to Work by Sex in Taloga
The most frequent times of departure to work in Taloga are 6:30 AM to 6:59 AM (23, 35.9%) for males and 12:00 AM to 4:59 AM (15, 31.2%) for females.
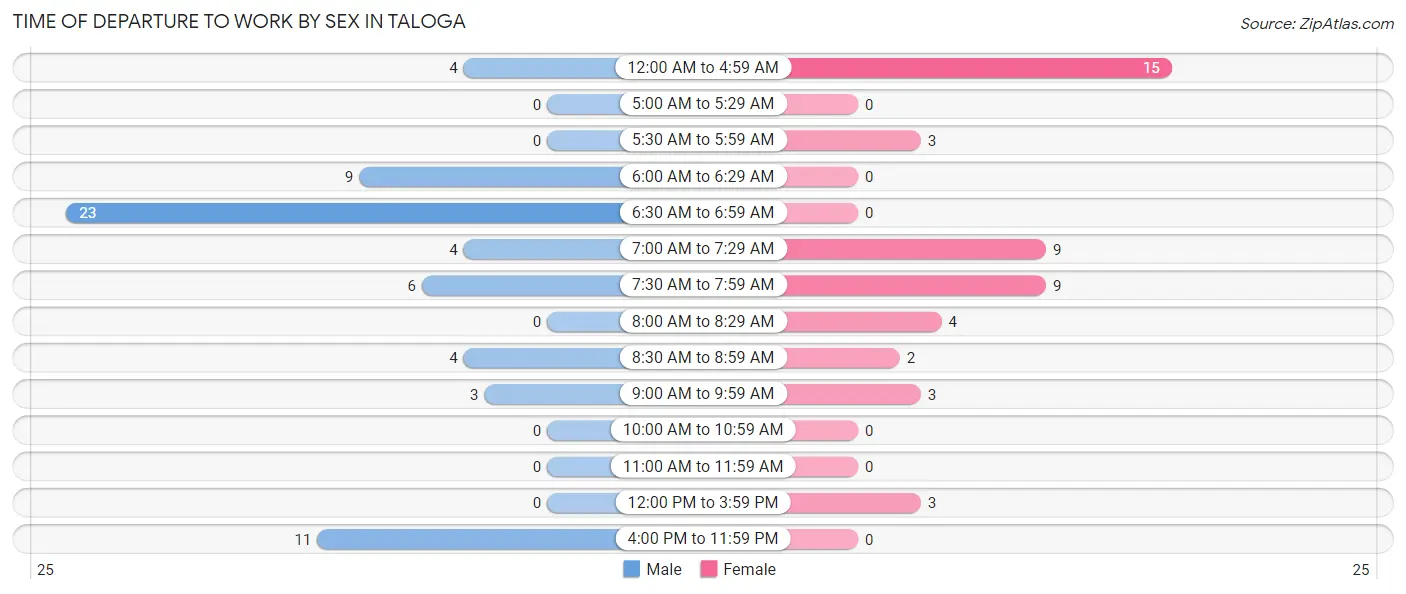
| Time of Departure | Male | Female |
| 12:00 AM to 4:59 AM | 4 (6.2%) | 15 (31.2%) |
| 5:00 AM to 5:29 AM | 0 (0.0%) | 0 (0.0%) |
| 5:30 AM to 5:59 AM | 0 (0.0%) | 3 (6.2%) |
| 6:00 AM to 6:29 AM | 9 (14.1%) | 0 (0.0%) |
| 6:30 AM to 6:59 AM | 23 (35.9%) | 0 (0.0%) |
| 7:00 AM to 7:29 AM | 4 (6.2%) | 9 (18.8%) |
| 7:30 AM to 7:59 AM | 6 (9.4%) | 9 (18.8%) |
| 8:00 AM to 8:29 AM | 0 (0.0%) | 4 (8.3%) |
| 8:30 AM to 8:59 AM | 4 (6.2%) | 2 (4.2%) |
| 9:00 AM to 9:59 AM | 3 (4.7%) | 3 (6.2%) |
| 10:00 AM to 10:59 AM | 0 (0.0%) | 0 (0.0%) |
| 11:00 AM to 11:59 AM | 0 (0.0%) | 0 (0.0%) |
| 12:00 PM to 3:59 PM | 0 (0.0%) | 3 (6.2%) |
| 4:00 PM to 11:59 PM | 11 (17.2%) | 0 (0.0%) |
| Total | 64 (100.0%) | 48 (100.0%) |
Housing Occupancy in Taloga
Occupancy by Ownership in Taloga
Of the total 107 dwellings in Taloga, owner-occupied units account for 79 (73.8%), while renter-occupied units make up 28 (26.2%).
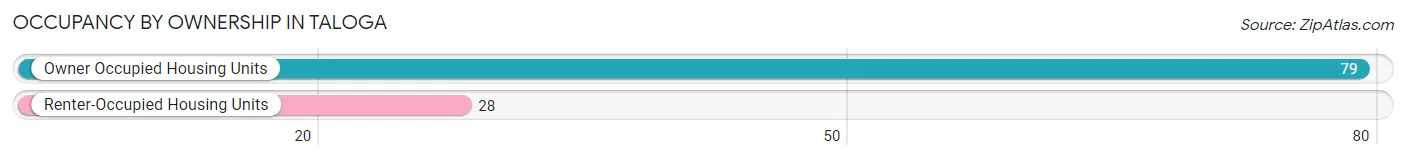
| Occupancy | # Housing Units | % Housing Units |
| Owner Occupied Housing Units | 79 | 73.8% |
| Renter-Occupied Housing Units | 28 | 26.2% |
| Total Occupied Housing Units | 107 | 100.0% |
Occupancy by Household Size in Taloga
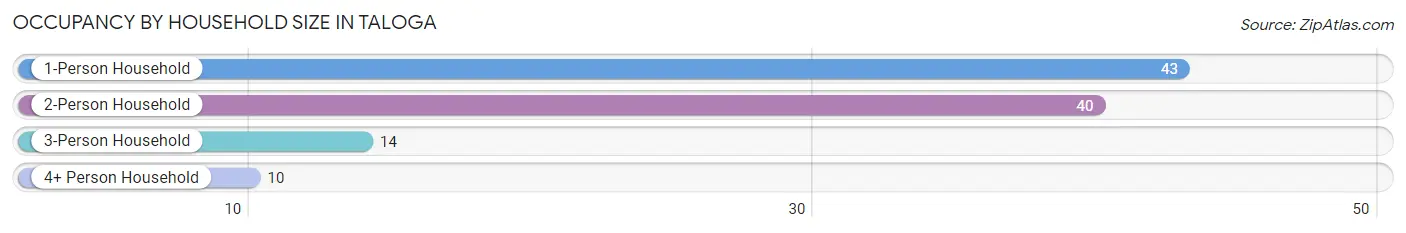
| Household Size | # Housing Units | % Housing Units |
| 1-Person Household | 43 | 40.2% |
| 2-Person Household | 40 | 37.4% |
| 3-Person Household | 14 | 13.1% |
| 4+ Person Household | 10 | 9.3% |
| Total Housing Units | 107 | 100.0% |
Occupancy by Ownership by Household Size in Taloga

| Household Size | Owner-occupied | Renter-occupied |
| 1-Person Household | 28 (65.1%) | 15 (34.9%) |
| 2-Person Household | 33 (82.5%) | 7 (17.5%) |
| 3-Person Household | 12 (85.7%) | 2 (14.3%) |
| 4+ Person Household | 6 (60.0%) | 4 (40.0%) |
| Total Housing Units | 79 (73.8%) | 28 (26.2%) |
Occupancy by Educational Attainment in Taloga
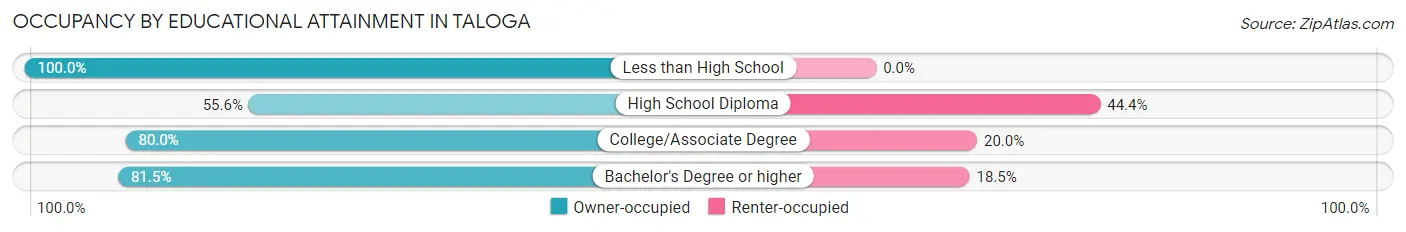
| Household Size | Owner-occupied | Renter-occupied |
| Less than High School | 9 (100.0%) | 0 (0.0%) |
| High School Diploma | 20 (55.6%) | 16 (44.4%) |
| College/Associate Degree | 28 (80.0%) | 7 (20.0%) |
| Bachelor's Degree or higher | 22 (81.5%) | 5 (18.5%) |
Occupancy by Age of Householder in Taloga
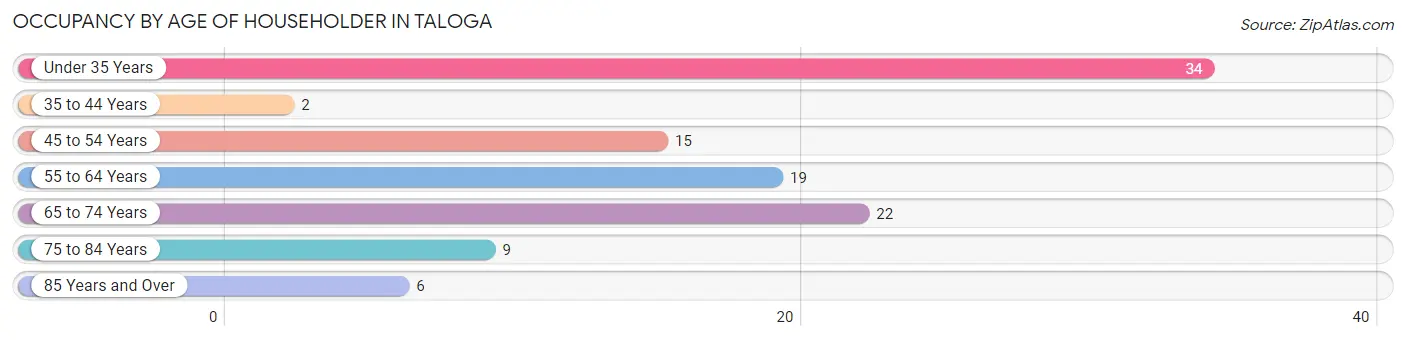
| Age Bracket | # Households | % Households |
| Under 35 Years | 34 | 31.8% |
| 35 to 44 Years | 2 | 1.9% |
| 45 to 54 Years | 15 | 14.0% |
| 55 to 64 Years | 19 | 17.8% |
| 65 to 74 Years | 22 | 20.6% |
| 75 to 84 Years | 9 | 8.4% |
| 85 Years and Over | 6 | 5.6% |
| Total | 107 | 100.0% |
Housing Finances in Taloga
Median Income by Occupancy in Taloga

| Occupancy Type | # Households | Median Income |
| Owner-Occupied | 79 (73.8%) | $78,125 |
| Renter-Occupied | 28 (26.2%) | $23,750 |
| Average | 107 (100.0%) | $48,125 |
Occupancy by Householder Income Bracket in Taloga
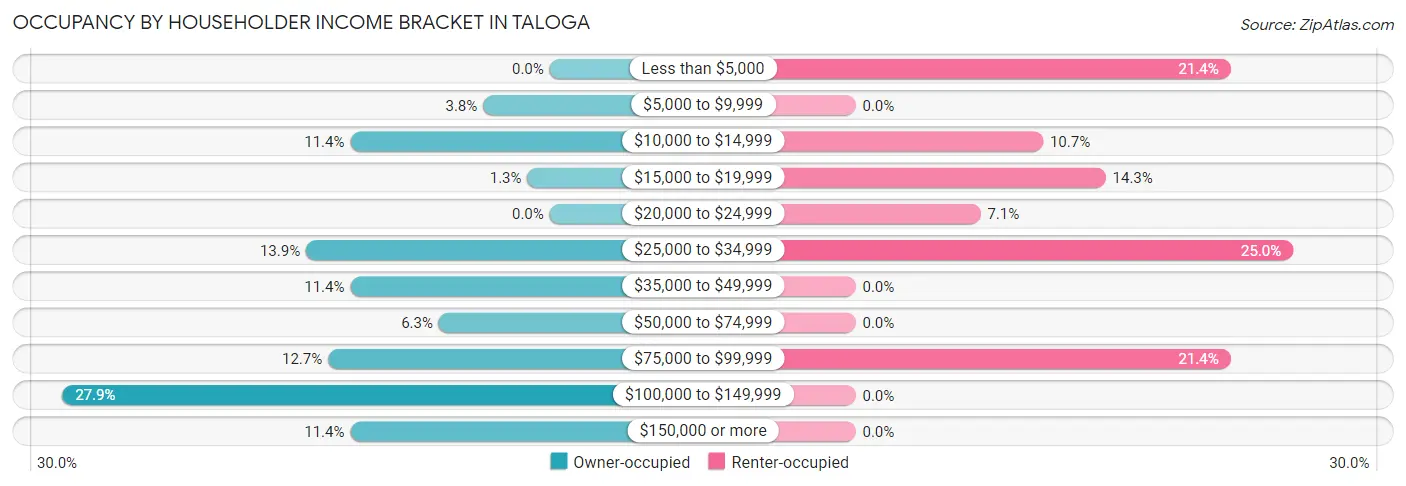
| Income Bracket | Owner-occupied | Renter-occupied |
| Less than $5,000 | 0 (0.0%) | 6 (21.4%) |
| $5,000 to $9,999 | 3 (3.8%) | 0 (0.0%) |
| $10,000 to $14,999 | 9 (11.4%) | 3 (10.7%) |
| $15,000 to $19,999 | 1 (1.3%) | 4 (14.3%) |
| $20,000 to $24,999 | 0 (0.0%) | 2 (7.1%) |
| $25,000 to $34,999 | 11 (13.9%) | 7 (25.0%) |
| $35,000 to $49,999 | 9 (11.4%) | 0 (0.0%) |
| $50,000 to $74,999 | 5 (6.3%) | 0 (0.0%) |
| $75,000 to $99,999 | 10 (12.7%) | 6 (21.4%) |
| $100,000 to $149,999 | 22 (27.9%) | 0 (0.0%) |
| $150,000 or more | 9 (11.4%) | 0 (0.0%) |
| Total | 79 (100.0%) | 28 (100.0%) |
Monthly Housing Cost Tiers in Taloga
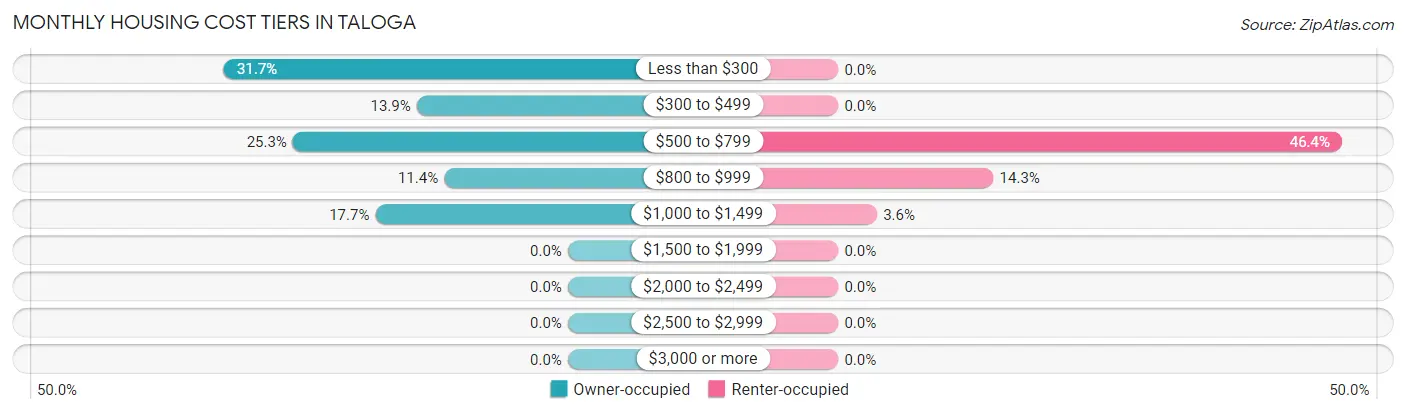
| Monthly Cost | Owner-occupied | Renter-occupied |
| Less than $300 | 25 (31.7%) | 0 (0.0%) |
| $300 to $499 | 11 (13.9%) | 0 (0.0%) |
| $500 to $799 | 20 (25.3%) | 13 (46.4%) |
| $800 to $999 | 9 (11.4%) | 4 (14.3%) |
| $1,000 to $1,499 | 14 (17.7%) | 1 (3.6%) |
| $1,500 to $1,999 | 0 (0.0%) | 0 (0.0%) |
| $2,000 to $2,499 | 0 (0.0%) | 0 (0.0%) |
| $2,500 to $2,999 | 0 (0.0%) | 0 (0.0%) |
| $3,000 or more | 0 (0.0%) | 0 (0.0%) |
| Total | 79 (100.0%) | 28 (100.0%) |
Physical Housing Characteristics in Taloga
Housing Structures in Taloga
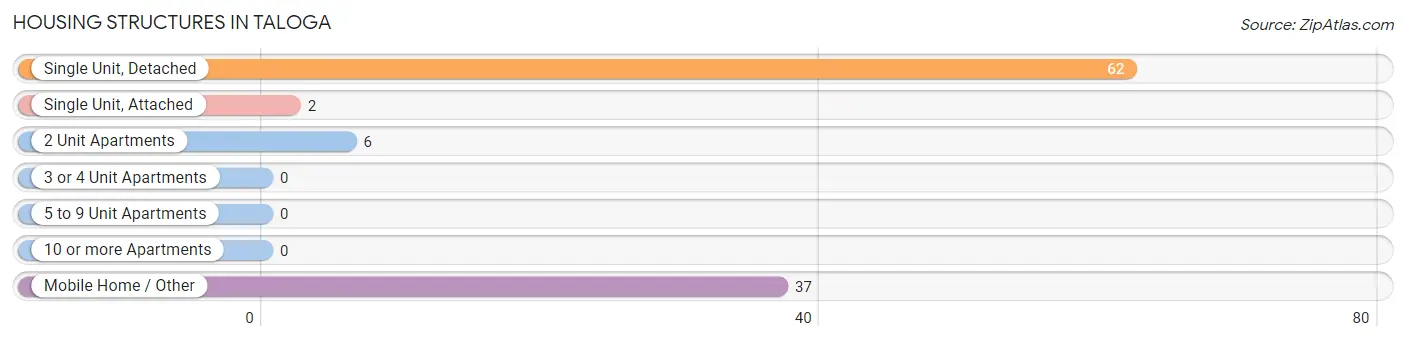
| Structure Type | # Housing Units | % Housing Units |
| Single Unit, Detached | 62 | 57.9% |
| Single Unit, Attached | 2 | 1.9% |
| 2 Unit Apartments | 6 | 5.6% |
| 3 or 4 Unit Apartments | 0 | 0.0% |
| 5 to 9 Unit Apartments | 0 | 0.0% |
| 10 or more Apartments | 0 | 0.0% |
| Mobile Home / Other | 37 | 34.6% |
| Total | 107 | 100.0% |
Housing Structures by Occupancy in Taloga
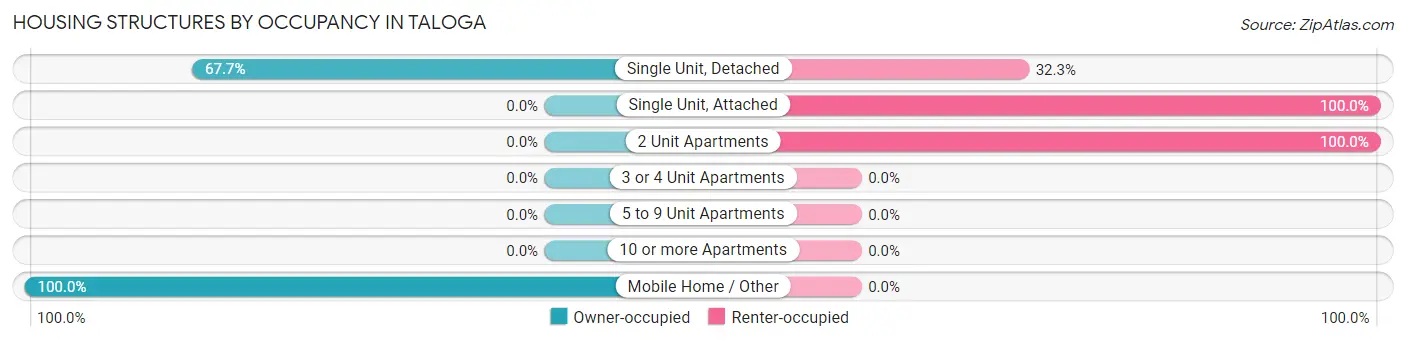
| Structure Type | Owner-occupied | Renter-occupied |
| Single Unit, Detached | 42 (67.7%) | 20 (32.3%) |
| Single Unit, Attached | 0 (0.0%) | 2 (100.0%) |
| 2 Unit Apartments | 0 (0.0%) | 6 (100.0%) |
| 3 or 4 Unit Apartments | 0 (0.0%) | 0 (0.0%) |
| 5 to 9 Unit Apartments | 0 (0.0%) | 0 (0.0%) |
| 10 or more Apartments | 0 (0.0%) | 0 (0.0%) |
| Mobile Home / Other | 37 (100.0%) | 0 (0.0%) |
| Total | 79 (73.8%) | 28 (26.2%) |
Housing Structures by Number of Rooms in Taloga

| Number of Rooms | Owner-occupied | Renter-occupied |
| 1 Room | 0 (0.0%) | 0 (0.0%) |
| 2 or 3 Rooms | 0 (0.0%) | 0 (0.0%) |
| 4 or 5 Rooms | 26 (32.9%) | 22 (78.6%) |
| 6 or 7 Rooms | 37 (46.8%) | 6 (21.4%) |
| 8 or more Rooms | 16 (20.3%) | 0 (0.0%) |
| Total | 79 (100.0%) | 28 (100.0%) |
Housing Structure by Heating Type in Taloga
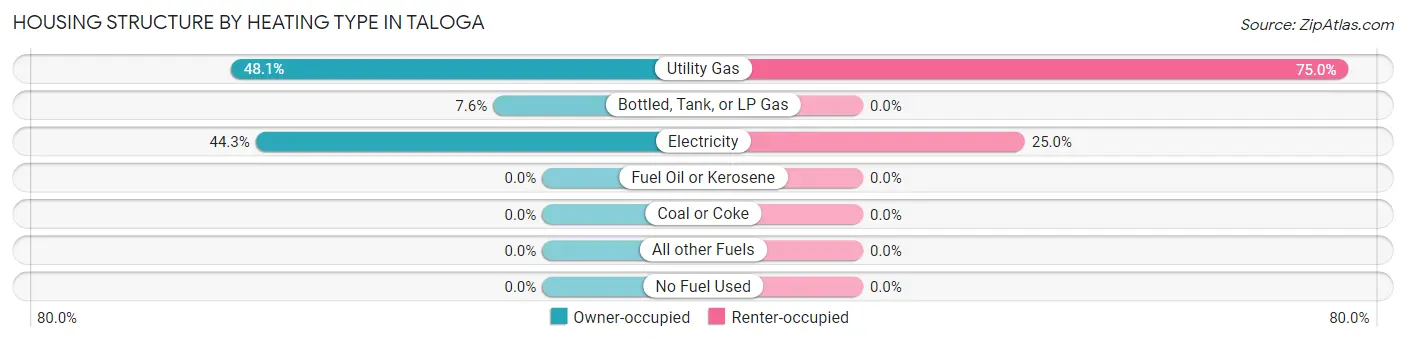
| Heating Type | Owner-occupied | Renter-occupied |
| Utility Gas | 38 (48.1%) | 21 (75.0%) |
| Bottled, Tank, or LP Gas | 6 (7.6%) | 0 (0.0%) |
| Electricity | 35 (44.3%) | 7 (25.0%) |
| Fuel Oil or Kerosene | 0 (0.0%) | 0 (0.0%) |
| Coal or Coke | 0 (0.0%) | 0 (0.0%) |
| All other Fuels | 0 (0.0%) | 0 (0.0%) |
| No Fuel Used | 0 (0.0%) | 0 (0.0%) |
| Total | 79 (100.0%) | 28 (100.0%) |
Household Vehicle Usage in Taloga
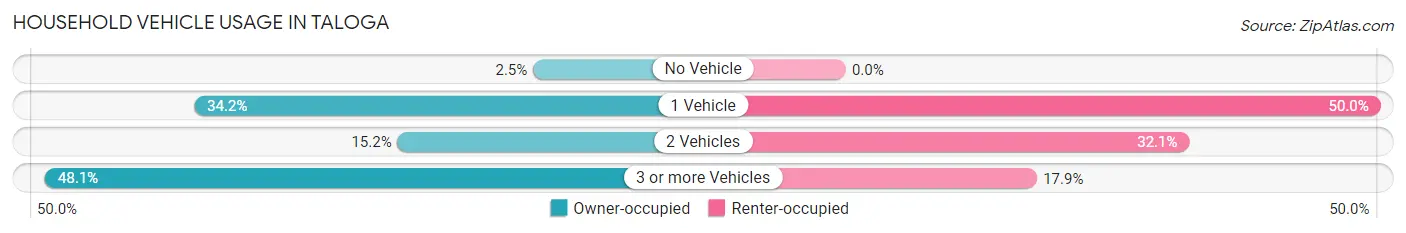
| Vehicles per Household | Owner-occupied | Renter-occupied |
| No Vehicle | 2 (2.5%) | 0 (0.0%) |
| 1 Vehicle | 27 (34.2%) | 14 (50.0%) |
| 2 Vehicles | 12 (15.2%) | 9 (32.1%) |
| 3 or more Vehicles | 38 (48.1%) | 5 (17.9%) |
| Total | 79 (100.0%) | 28 (100.0%) |
Real Estate & Mortgages in Taloga
Real Estate and Mortgage Overview in Taloga
| Characteristic | Without Mortgage | With Mortgage |
| Housing Units | 52 | 27 |
| Median Property Value | $51,700 | $128,400 |
| Median Household Income | $47,500 | $1 |
| Monthly Housing Costs | $307 | $0 |
| Real Estate Taxes | $443 | $0 |
Property Value by Mortgage Status in Taloga
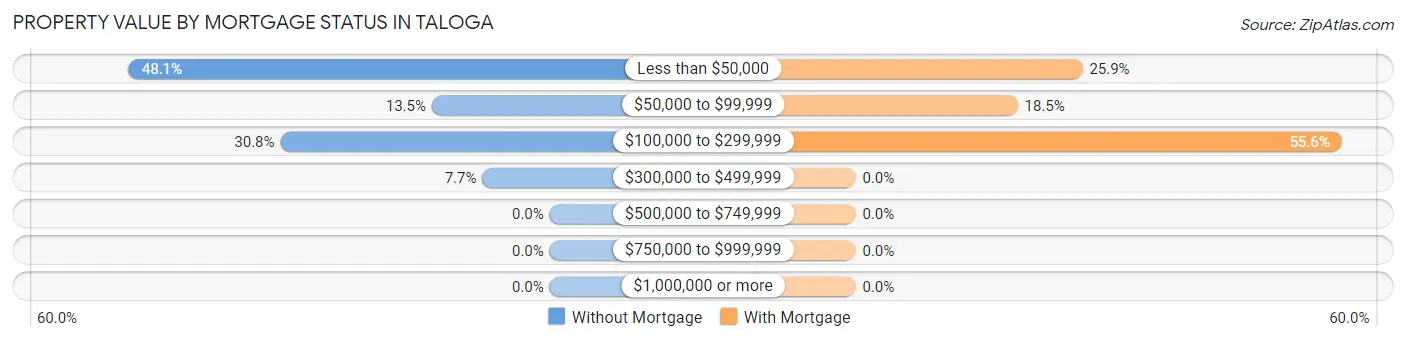
| Property Value | Without Mortgage | With Mortgage |
| Less than $50,000 | 25 (48.1%) | 7 (25.9%) |
| $50,000 to $99,999 | 7 (13.5%) | 5 (18.5%) |
| $100,000 to $299,999 | 16 (30.8%) | 15 (55.6%) |
| $300,000 to $499,999 | 4 (7.7%) | 0 (0.0%) |
| $500,000 to $749,999 | 0 (0.0%) | 0 (0.0%) |
| $750,000 to $999,999 | 0 (0.0%) | 0 (0.0%) |
| $1,000,000 or more | 0 (0.0%) | 0 (0.0%) |
| Total | 52 (100.0%) | 27 (100.0%) |
Household Income by Mortgage Status in Taloga

| Household Income | Without Mortgage | With Mortgage |
| Less than $10,000 | 3 (5.8%) | 0 (0.0%) |
| $10,000 to $24,999 | 10 (19.2%) | 0 (0.0%) |
| $25,000 to $34,999 | 6 (11.5%) | 0 (0.0%) |
| $35,000 to $49,999 | 9 (17.3%) | 5 (18.5%) |
| $50,000 to $74,999 | 5 (9.6%) | 0 (0.0%) |
| $75,000 to $99,999 | 9 (17.3%) | 0 (0.0%) |
| $100,000 to $149,999 | 2 (3.8%) | 1 (3.7%) |
| $150,000 or more | 8 (15.4%) | 20 (74.1%) |
| Total | 52 (100.0%) | 27 (100.0%) |
Property Value to Household Income Ratio in Taloga
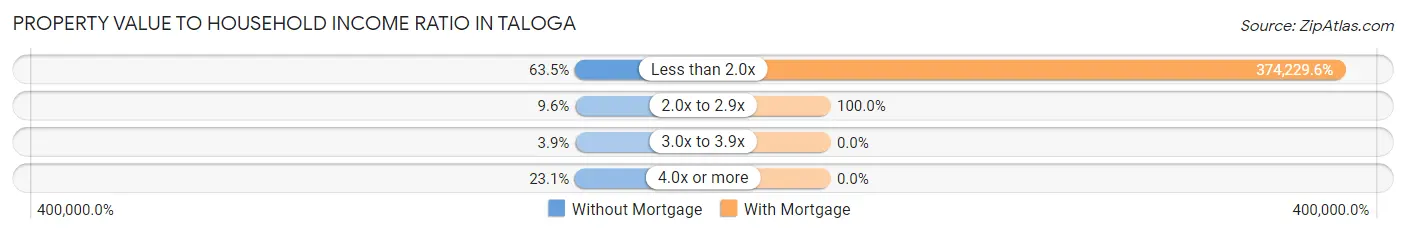
| Value-to-Income Ratio | Without Mortgage | With Mortgage |
| Less than 2.0x | 33 (63.5%) | 101,042 (374,229.6%) |
| 2.0x to 2.9x | 5 (9.6%) | 27 (100.0%) |
| 3.0x to 3.9x | 2 (3.8%) | 0 (0.0%) |
| 4.0x or more | 12 (23.1%) | 0 (0.0%) |
| Total | 52 (100.0%) | 27 (100.0%) |
Real Estate Taxes by Mortgage Status in Taloga
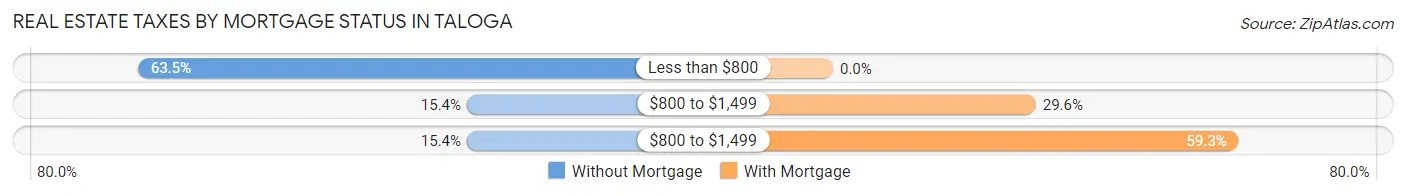
| Property Taxes | Without Mortgage | With Mortgage |
| Less than $800 | 33 (63.5%) | 0 (0.0%) |
| $800 to $1,499 | 8 (15.4%) | 8 (29.6%) |
| $800 to $1,499 | 8 (15.4%) | 16 (59.3%) |
| Total | 52 (100.0%) | 27 (100.0%) |
Health & Disability in Taloga
Health Insurance Coverage by Age in Taloga
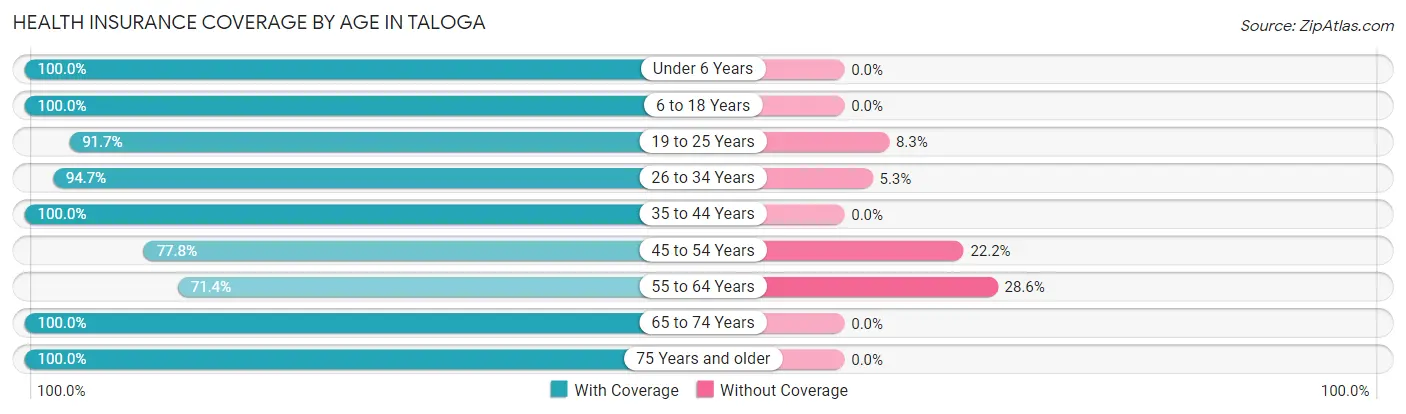
| Age Bracket | With Coverage | Without Coverage |
| Under 6 Years | 35 (100.0%) | 0 (0.0%) |
| 6 to 18 Years | 66 (100.0%) | 0 (0.0%) |
| 19 to 25 Years | 11 (91.7%) | 1 (8.3%) |
| 26 to 34 Years | 36 (94.7%) | 2 (5.3%) |
| 35 to 44 Years | 17 (100.0%) | 0 (0.0%) |
| 45 to 54 Years | 14 (77.8%) | 4 (22.2%) |
| 55 to 64 Years | 30 (71.4%) | 12 (28.6%) |
| 65 to 74 Years | 31 (100.0%) | 0 (0.0%) |
| 75 Years and older | 28 (100.0%) | 0 (0.0%) |
| Total | 268 (93.4%) | 19 (6.6%) |
Health Insurance Coverage by Citizenship Status in Taloga
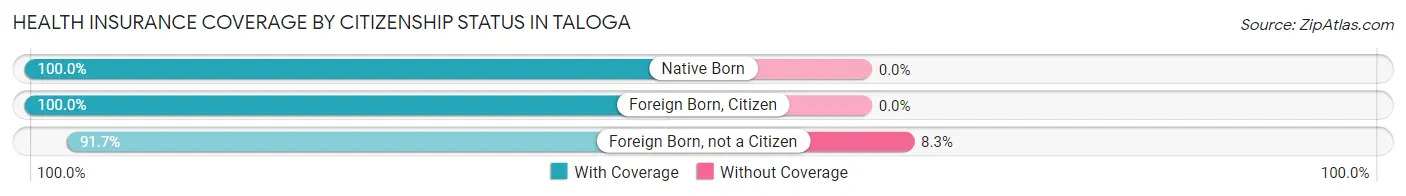
| Citizenship Status | With Coverage | Without Coverage |
| Native Born | 35 (100.0%) | 0 (0.0%) |
| Foreign Born, Citizen | 66 (100.0%) | 0 (0.0%) |
| Foreign Born, not a Citizen | 11 (91.7%) | 1 (8.3%) |
Health Insurance Coverage by Household Income in Taloga
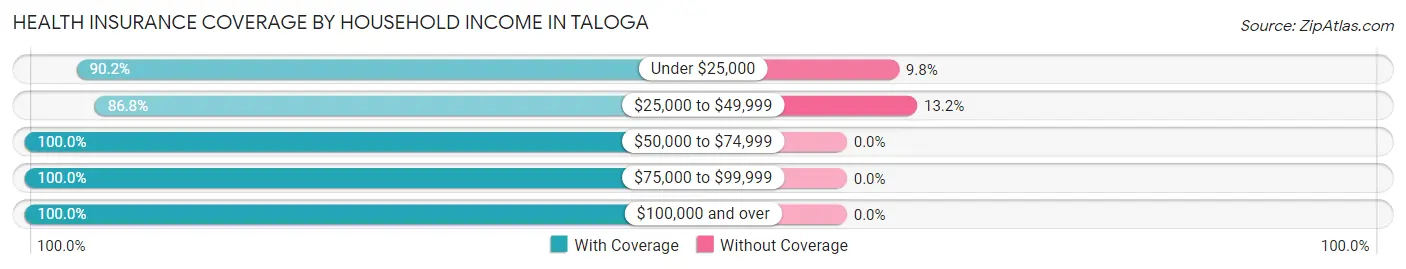
| Household Income | With Coverage | Without Coverage |
| Under $25,000 | 37 (90.2%) | 4 (9.8%) |
| $25,000 to $49,999 | 99 (86.8%) | 15 (13.2%) |
| $50,000 to $74,999 | 12 (100.0%) | 0 (0.0%) |
| $75,000 to $99,999 | 34 (100.0%) | 0 (0.0%) |
| $100,000 and over | 86 (100.0%) | 0 (0.0%) |
Public vs Private Health Insurance Coverage by Age in Taloga
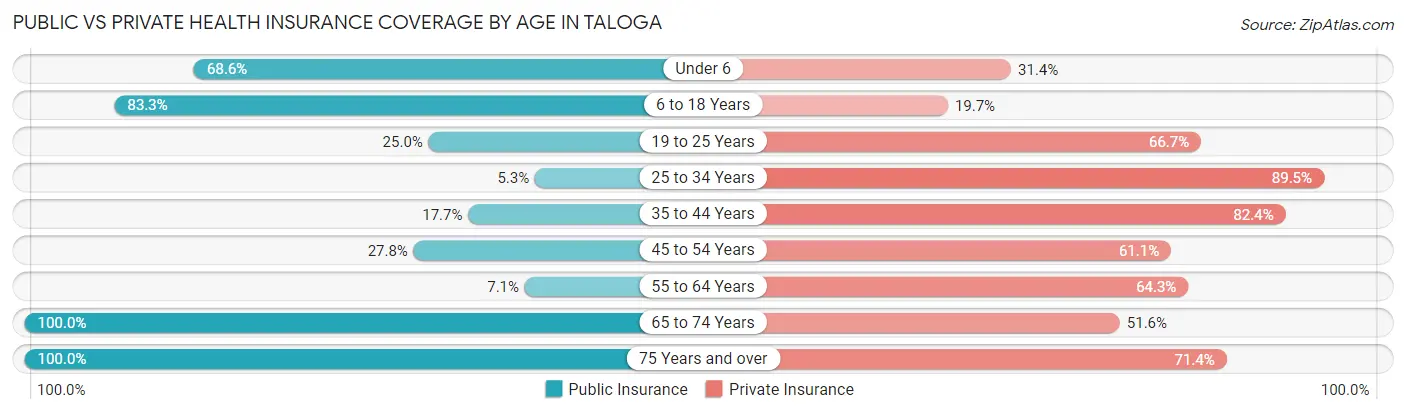
| Age Bracket | Public Insurance | Private Insurance |
| Under 6 | 24 (68.6%) | 11 (31.4%) |
| 6 to 18 Years | 55 (83.3%) | 13 (19.7%) |
| 19 to 25 Years | 3 (25.0%) | 8 (66.7%) |
| 25 to 34 Years | 2 (5.3%) | 34 (89.5%) |
| 35 to 44 Years | 3 (17.6%) | 14 (82.4%) |
| 45 to 54 Years | 5 (27.8%) | 11 (61.1%) |
| 55 to 64 Years | 3 (7.1%) | 27 (64.3%) |
| 65 to 74 Years | 31 (100.0%) | 16 (51.6%) |
| 75 Years and over | 28 (100.0%) | 20 (71.4%) |
| Total | 154 (53.7%) | 154 (53.7%) |
Disability Status by Sex by Age in Taloga
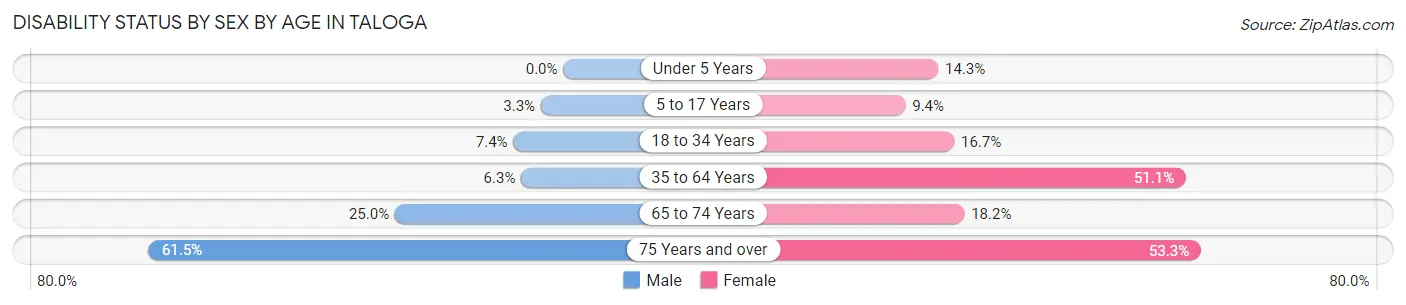
| Age Bracket | Male | Female |
| Under 5 Years | 0 (0.0%) | 2 (14.3%) |
| 5 to 17 Years | 1 (3.3%) | 5 (9.4%) |
| 18 to 34 Years | 2 (7.4%) | 4 (16.7%) |
| 35 to 64 Years | 2 (6.2%) | 23 (51.1%) |
| 65 to 74 Years | 5 (25.0%) | 2 (18.2%) |
| 75 Years and over | 8 (61.5%) | 8 (53.3%) |
Disability Class by Sex by Age in Taloga
Disability Class: Hearing Difficulty
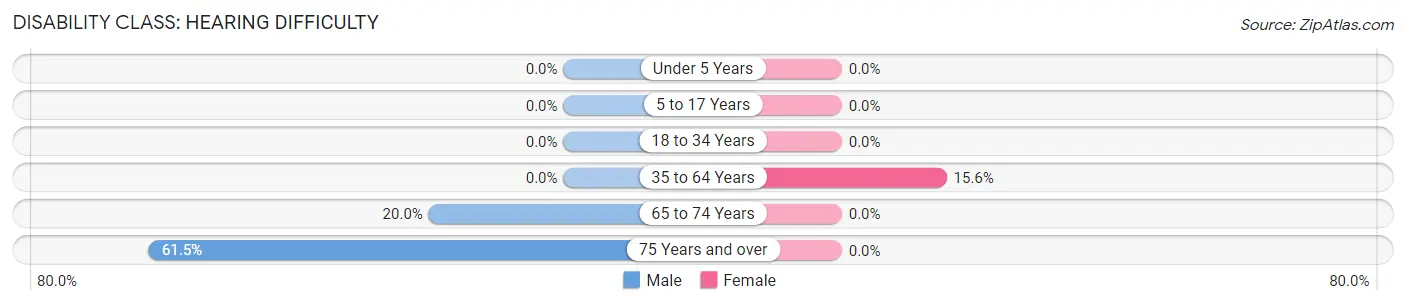
| Age Bracket | Male | Female |
| Under 5 Years | 0 (0.0%) | 0 (0.0%) |
| 5 to 17 Years | 0 (0.0%) | 0 (0.0%) |
| 18 to 34 Years | 0 (0.0%) | 0 (0.0%) |
| 35 to 64 Years | 0 (0.0%) | 7 (15.6%) |
| 65 to 74 Years | 4 (20.0%) | 0 (0.0%) |
| 75 Years and over | 8 (61.5%) | 0 (0.0%) |
Disability Class: Vision Difficulty
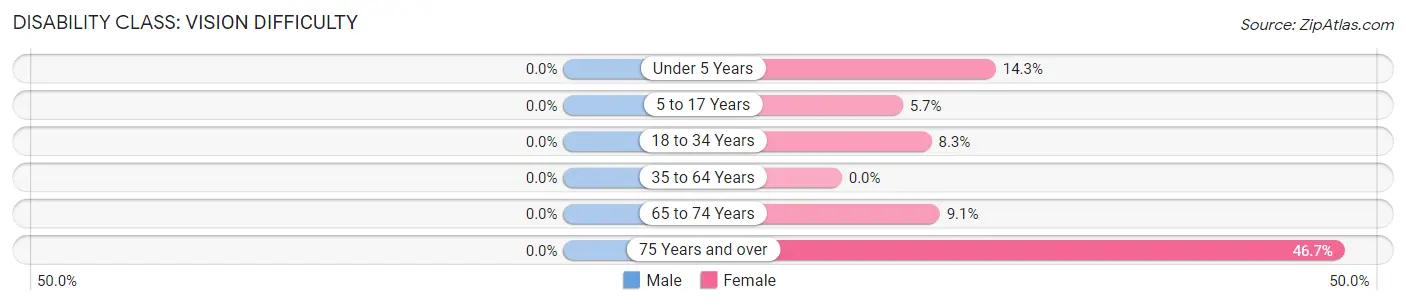
| Age Bracket | Male | Female |
| Under 5 Years | 0 (0.0%) | 2 (14.3%) |
| 5 to 17 Years | 0 (0.0%) | 3 (5.7%) |
| 18 to 34 Years | 0 (0.0%) | 2 (8.3%) |
| 35 to 64 Years | 0 (0.0%) | 0 (0.0%) |
| 65 to 74 Years | 0 (0.0%) | 1 (9.1%) |
| 75 Years and over | 0 (0.0%) | 7 (46.7%) |
Disability Class: Cognitive Difficulty
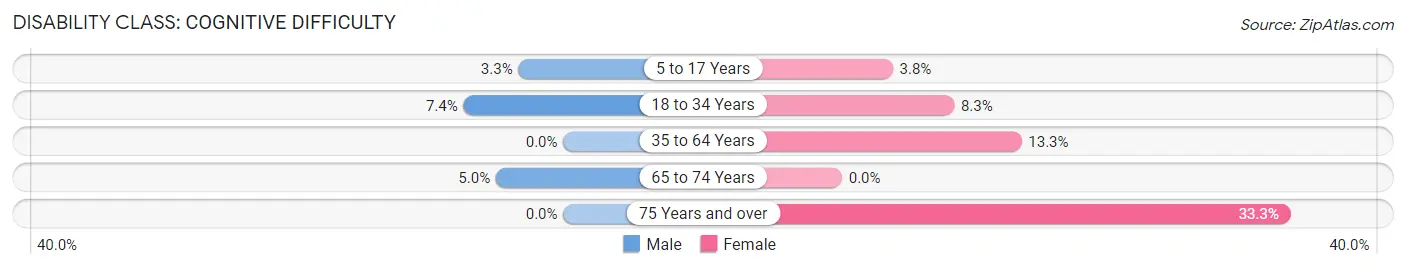
| Age Bracket | Male | Female |
| 5 to 17 Years | 1 (3.3%) | 2 (3.8%) |
| 18 to 34 Years | 2 (7.4%) | 2 (8.3%) |
| 35 to 64 Years | 0 (0.0%) | 6 (13.3%) |
| 65 to 74 Years | 1 (5.0%) | 0 (0.0%) |
| 75 Years and over | 0 (0.0%) | 5 (33.3%) |
Disability Class: Ambulatory Difficulty
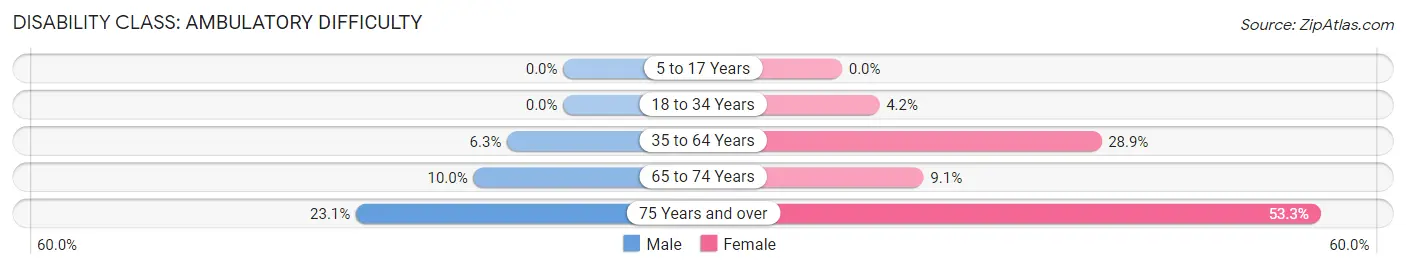
| Age Bracket | Male | Female |
| 5 to 17 Years | 0 (0.0%) | 0 (0.0%) |
| 18 to 34 Years | 0 (0.0%) | 1 (4.2%) |
| 35 to 64 Years | 2 (6.2%) | 13 (28.9%) |
| 65 to 74 Years | 2 (10.0%) | 1 (9.1%) |
| 75 Years and over | 3 (23.1%) | 8 (53.3%) |
Disability Class: Self-Care Difficulty
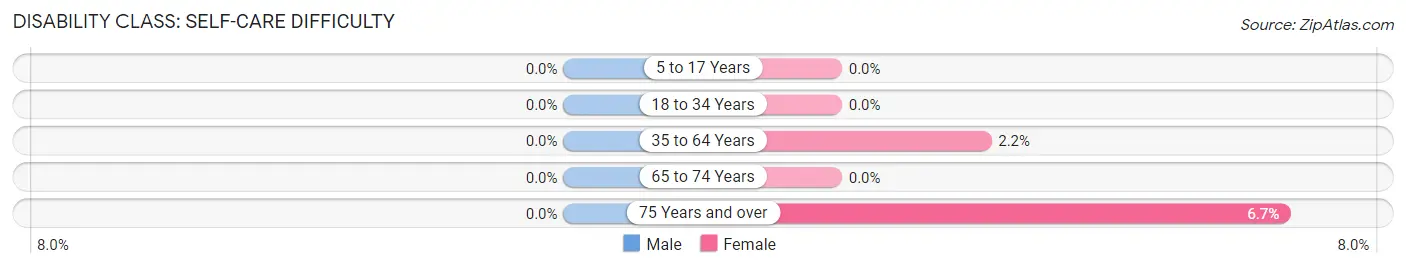
| Age Bracket | Male | Female |
| 5 to 17 Years | 0 (0.0%) | 0 (0.0%) |
| 18 to 34 Years | 0 (0.0%) | 0 (0.0%) |
| 35 to 64 Years | 0 (0.0%) | 1 (2.2%) |
| 65 to 74 Years | 0 (0.0%) | 0 (0.0%) |
| 75 Years and over | 0 (0.0%) | 1 (6.7%) |
Technology Access in Taloga
Computing Device Access in Taloga
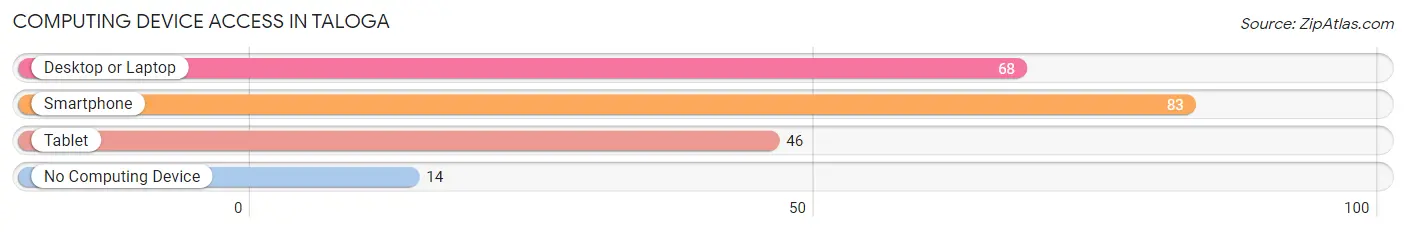
| Device Type | # Households | % Households |
| Desktop or Laptop | 68 | 63.5% |
| Smartphone | 83 | 77.6% |
| Tablet | 46 | 43.0% |
| No Computing Device | 14 | 13.1% |
| Total | 107 | 100.0% |
Internet Access in Taloga
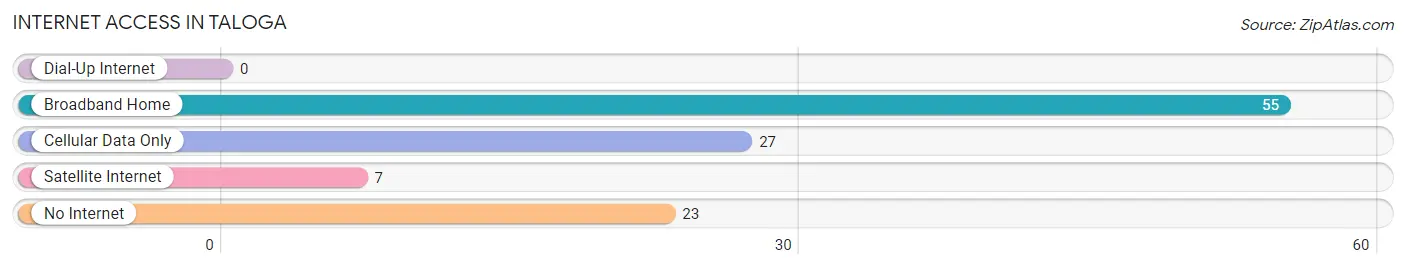
| Internet Type | # Households | % Households |
| Dial-Up Internet | 0 | 0.0% |
| Broadband Home | 55 | 51.4% |
| Cellular Data Only | 27 | 25.2% |
| Satellite Internet | 7 | 6.5% |
| No Internet | 23 | 21.5% |
| Total | 107 | 100.0% |
Taloga Summary
Introduction
Taloga is a small town located in Dewey County, Oklahoma. It is situated in the western part of the state, about 30 miles east of Woodward. The town was founded in 1901 and has a population of approximately 500 people. The town is known for its rich history, diverse geography, and vibrant economy.
History
The town of Taloga was founded in 1901 by a group of settlers from Kansas. The settlers were looking for a place to settle and start a new life. The town was named after the nearby Taloga Creek, which was named after a Native American chief. The town quickly grew and by 1910, it had a population of over 500 people.
The town was a thriving agricultural community, with many of the residents working in the local farms and ranches. The town also had a number of businesses, including a bank, a hotel, a general store, and a post office.
In the 1920s, the town experienced a period of growth and prosperity. The population increased to over 1,000 people and the town had a number of new businesses, including a movie theater, a bowling alley, and a hospital.
The Great Depression hit the town hard, and many of the businesses closed. The population decreased to just over 500 people by 1940. The town slowly recovered and by the 1950s, the population had increased to over 700 people.
Geography
Taloga is located in the western part of Oklahoma, about 30 miles east of Woodward. The town is situated in a flat, open area, with rolling hills in the distance. The town is surrounded by farmland and ranches, and is located near the Taloga Creek.
The town has a total area of 1.2 square miles, all of which is land. The town has a humid subtropical climate, with hot summers and mild winters. The average temperature in the summer is around 90 degrees Fahrenheit, and the average temperature in the winter is around 40 degrees Fahrenheit.
Economy
The economy of Taloga is largely based on agriculture. The town is surrounded by farmland and ranches, and many of the residents work in the local farms and ranches. The town also has a number of businesses, including a bank, a hotel, a general store, and a post office.
The town also has a number of manufacturing businesses, including a furniture factory and a metal fabrication plant. The town also has a number of retail stores, including a grocery store, a hardware store, and a clothing store.
Demographics
As of the 2010 census, the population of Taloga was 514 people. The town has a population density of 425 people per square mile. The median age of the population is 44.7 years, and the median household income is $35,000.
The town is predominantly white, with 92.3% of the population being white. The town also has a small Hispanic population, with 4.7% of the population being Hispanic. The town also has a small African American population, with 1.2% of the population being African American.
Conclusion
Taloga is a small town located in Dewey County, Oklahoma. The town has a rich history, diverse geography, and vibrant economy. The town is predominantly white, with a small Hispanic and African American population. The town is largely based on agriculture, with many of the residents working in the local farms and ranches. The town also has a number of businesses, including a bank, a hotel, a general store, and a post office. The town has a population of 514 people, with a median age of 44.7 years and a median household income of $35,000.
Common Questions
What is the Total Population of Taloga?
Total Population of Taloga is 303.
What is the Total Male Population of Taloga?
Total Male Population of Taloga is 132.
What is the Total Female Population of Taloga?
Total Female Population of Taloga is 171.
What is the Ratio of Males per 100 Females in Taloga?
There are 77.19 Males per 100 Females in Taloga.
What is the Ratio of Females per 100 Males in Taloga?
There are 129.55 Females per 100 Males in Taloga.
What is the Median Population Age in Taloga?
Median Population Age in Taloga is 33.8 Years.
What is the Average Family Size in Taloga
Average Family Size in Taloga is 3.8 People.
What is the Average Household Size in Taloga
Average Household Size in Taloga is 2.7 People.
What is Per Capita Income in Taloga?
Per Capita income in Taloga is $24,794.
What is the Median Family Income in Taloga?
Median Family Income in Taloga is $51,250.
What is the Median Household income in Taloga?
Median Household Income in Taloga is $48,125.
What is Inequality or Gini Index in Taloga?
Inequality or Gini Index in Taloga is 0.45.
How Large is the Labor Force in Taloga?
There are 127 People in the Labor Forcein in Taloga.
What is the Percentage of People in the Labor Force in Taloga?
61.7% of People are in the Labor Force in Taloga.
What is the Unemployment Rate in Taloga?
Unemployment Rate in Taloga is 0.8%.