East Duke, OK
East Duke Map
East Duke Overview
346
TOTAL POPULATION
182
MALE POPULATION
164
FEMALE POPULATION
110.98
MALES / 100 FEMALES
90.11
FEMALES / 100 MALES
37.4
MEDIAN AGE
3.6
AVG FAMILY SIZE
2.8
AVG HOUSEHOLD SIZE
$34,283
PER CAPITA INCOME
$84,375
AVG FAMILY INCOME
$60,000
AVG HOUSEHOLD INCOME
35.5%
WAGE / INCOME GAP [ % ]
64.5¢/ $1
WAGE / INCOME GAP [ $ ]
0.48
INEQUALITY / GINI INDEX
169
LABOR FORCE [ PEOPLE ]
66.0%
PERCENT IN LABOR FORCE
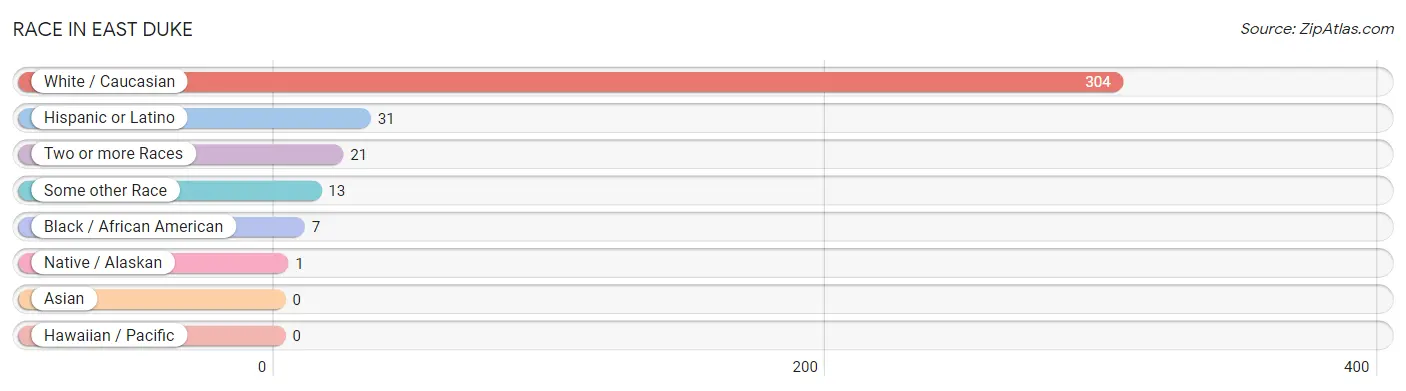
Race in East Duke
The most populous races in East Duke are White / Caucasian (304 | 87.9%), Hispanic or Latino (31 | 9.0%), and Two or more Races (21 | 6.1%).
| Race | # Population | % Population |
| Asian | 0 | 0.0% |
| Black / African American | 7 | 2.0% |
| Hawaiian / Pacific | 0 | 0.0% |
| Hispanic or Latino | 31 | 9.0% |
| Native / Alaskan | 1 | 0.3% |
| White / Caucasian | 304 | 87.9% |
| Two or more Races | 21 | 6.1% |
| Some other Race | 13 | 3.8% |
| Total | 346 | 100.0% |
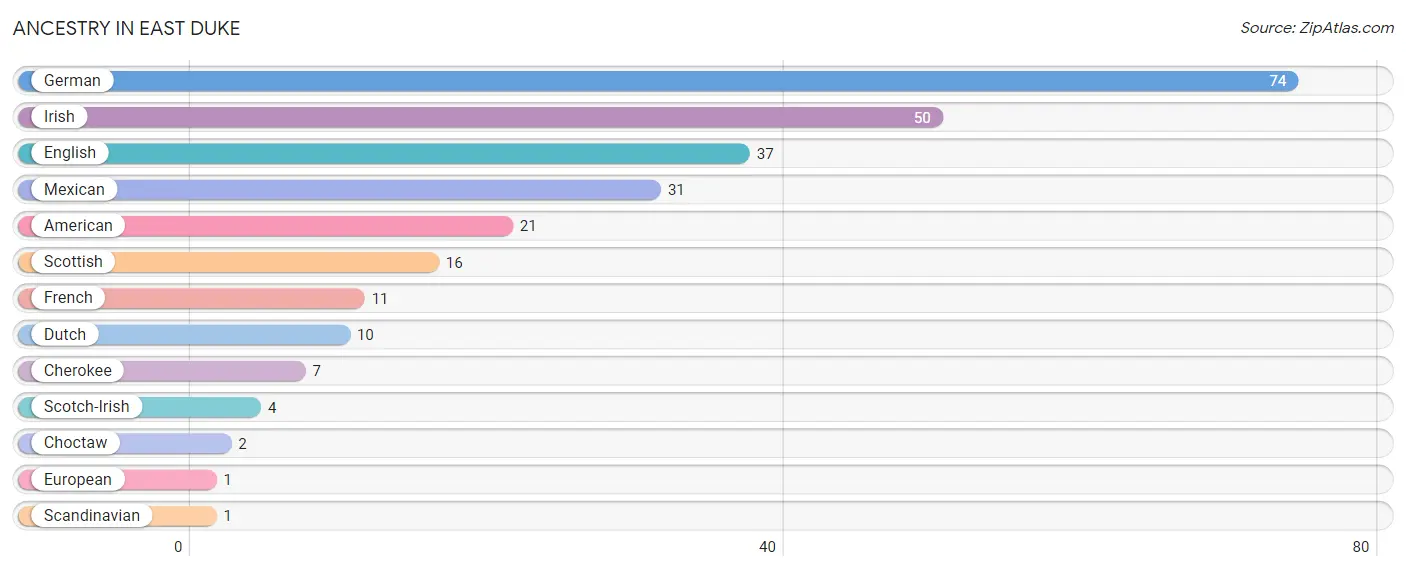
Ancestry in East Duke
The most populous ancestries reported in East Duke are German (74 | 21.4%), Irish (50 | 14.4%), English (37 | 10.7%), Mexican (31 | 9.0%), and American (21 | 6.1%), together accounting for 61.6% of all East Duke residents.
| Ancestry | # Population | % Population |
| American | 21 | 6.1% |
| Cherokee | 7 | 2.0% |
| Choctaw | 2 | 0.6% |
| Dutch | 10 | 2.9% |
| English | 37 | 10.7% |
| European | 1 | 0.3% |
| French | 11 | 3.2% |
| German | 74 | 21.4% |
| Irish | 50 | 14.4% |
| Mexican | 31 | 9.0% |
| Scandinavian | 1 | 0.3% |
| Scotch-Irish | 4 | 1.2% |
| Scottish | 16 | 4.6% | View All 13 Rows |
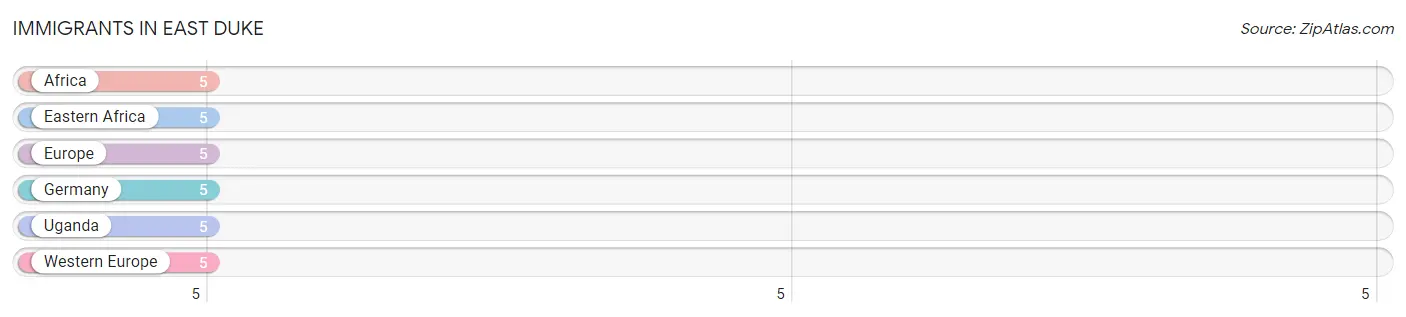
Immigrants in East Duke
The most numerous immigrant groups reported in East Duke came from Africa (5 | 1.5%), Eastern Africa (5 | 1.5%), Europe (5 | 1.5%), Germany (5 | 1.5%), and Uganda (5 | 1.5%), together accounting for 7.3% of all East Duke residents.
| Immigration Origin | # Population | % Population |
| Africa | 5 | 1.5% |
| Eastern Africa | 5 | 1.5% |
| Europe | 5 | 1.5% |
| Germany | 5 | 1.5% |
| Uganda | 5 | 1.5% |
| Western Europe | 5 | 1.5% | View All 6 Rows |
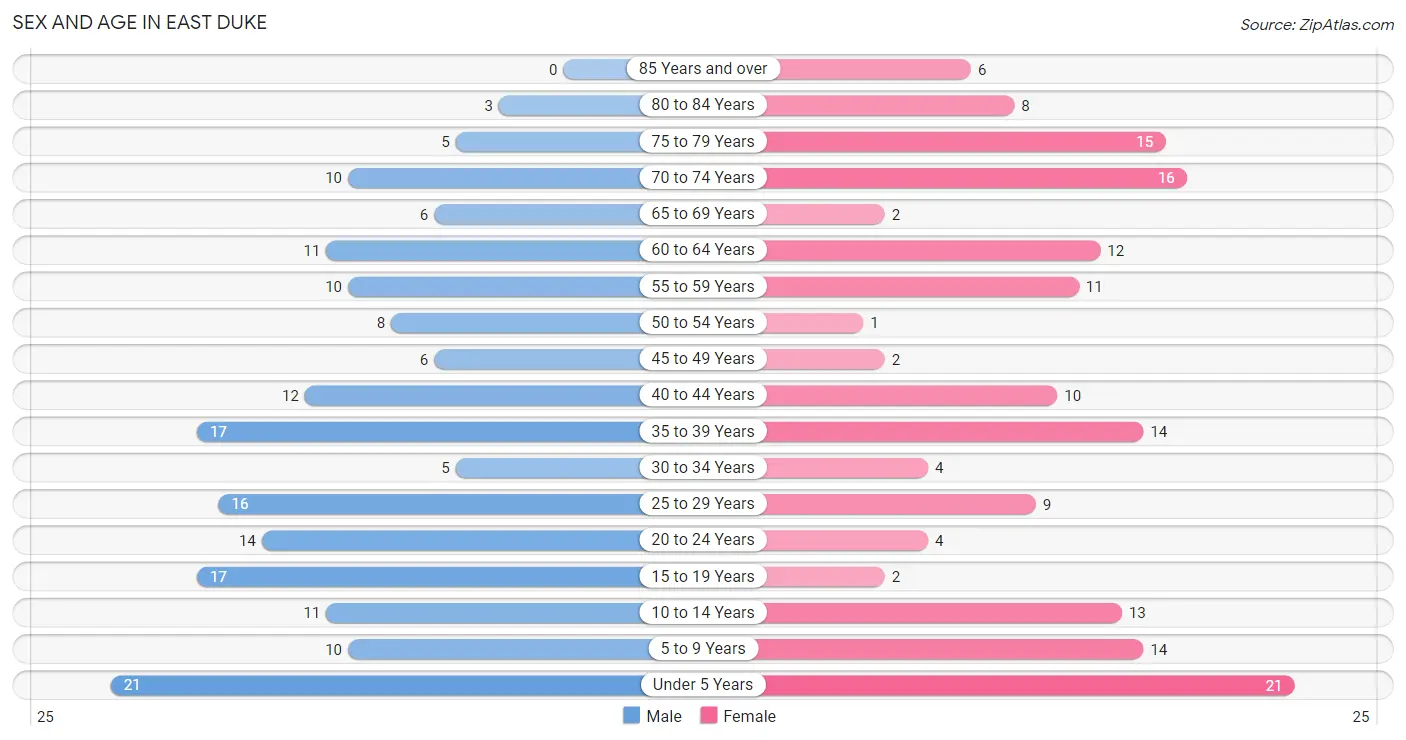
Sex and Age in East Duke
Sex and Age in East Duke
The most populous age groups in East Duke are Under 5 Years (21 | 11.5%) for men and Under 5 Years (21 | 12.8%) for women.
| Age Bracket | Male | Female |
| Under 5 Years | 21 (11.5%) | 21 (12.8%) |
| 5 to 9 Years | 10 (5.5%) | 14 (8.5%) |
| 10 to 14 Years | 11 (6.0%) | 13 (7.9%) |
| 15 to 19 Years | 17 (9.3%) | 2 (1.2%) |
| 20 to 24 Years | 14 (7.7%) | 4 (2.4%) |
| 25 to 29 Years | 16 (8.8%) | 9 (5.5%) |
| 30 to 34 Years | 5 (2.8%) | 4 (2.4%) |
| 35 to 39 Years | 17 (9.3%) | 14 (8.5%) |
| 40 to 44 Years | 12 (6.6%) | 10 (6.1%) |
| 45 to 49 Years | 6 (3.3%) | 2 (1.2%) |
| 50 to 54 Years | 8 (4.4%) | 1 (0.6%) |
| 55 to 59 Years | 10 (5.5%) | 11 (6.7%) |
| 60 to 64 Years | 11 (6.0%) | 12 (7.3%) |
| 65 to 69 Years | 6 (3.3%) | 2 (1.2%) |
| 70 to 74 Years | 10 (5.5%) | 16 (9.8%) |
| 75 to 79 Years | 5 (2.8%) | 15 (9.1%) |
| 80 to 84 Years | 3 (1.7%) | 8 (4.9%) |
| 85 Years and over | 0 (0.0%) | 6 (3.7%) |
| Total | 182 (100.0%) | 164 (100.0%) |
Families and Households in East Duke
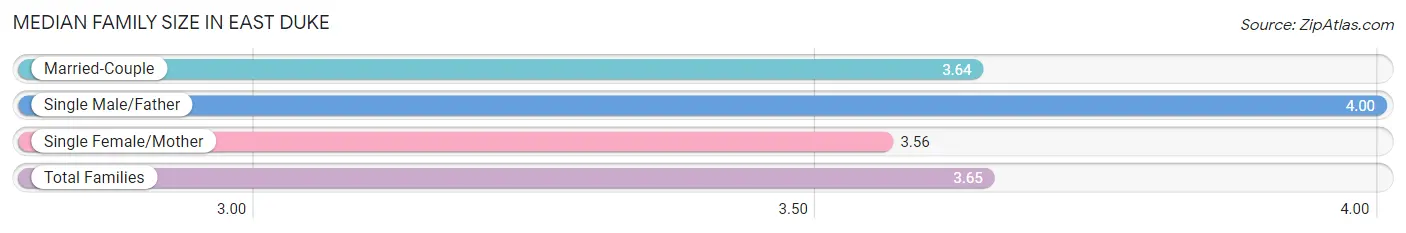
Median Family Size in East Duke
The median family size in East Duke is 3.65 persons per family, with single male/father families (4 | 5.0%) accounting for the largest median family size of 4 persons per family. On the other hand, single female/mother families (9 | 11.3%) represent the smallest median family size with 3.56 persons per family.
| Family Type | # Families | Family Size |
| Married-Couple | 67 (83.8%) | 3.64 |
| Single Male/Father | 4 (5.0%) | 4.00 |
| Single Female/Mother | 9 (11.3%) | 3.56 |
| Total Families | 80 (100.0%) | 3.65 |
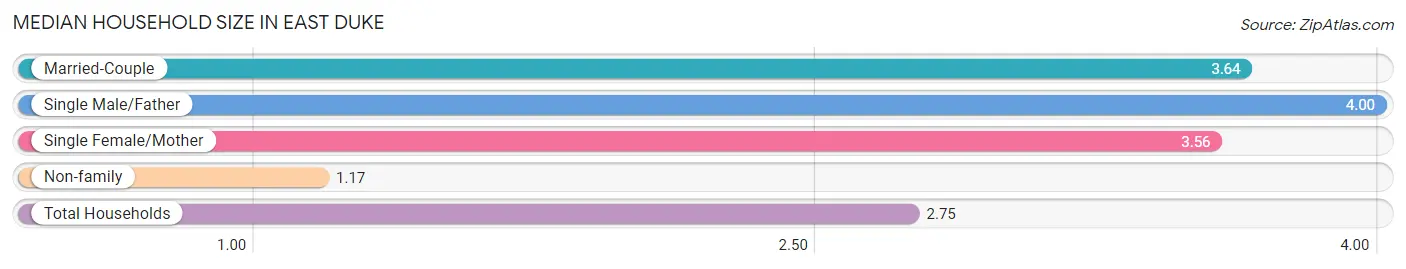
Median Household Size in East Duke
The median household size in East Duke is 2.75 persons per household, with single male/father households (4 | 3.2%) accounting for the largest median household size of 4 persons per household. non-family households (46 | 36.5%) represent the smallest median household size with 1.17 persons per household.
| Household Type | # Households | Household Size |
| Married-Couple | 67 (53.2%) | 3.64 |
| Single Male/Father | 4 (3.2%) | 4.00 |
| Single Female/Mother | 9 (7.1%) | 3.56 |
| Non-family | 46 (36.5%) | 1.17 |
| Total Households | 126 (100.0%) | 2.75 |
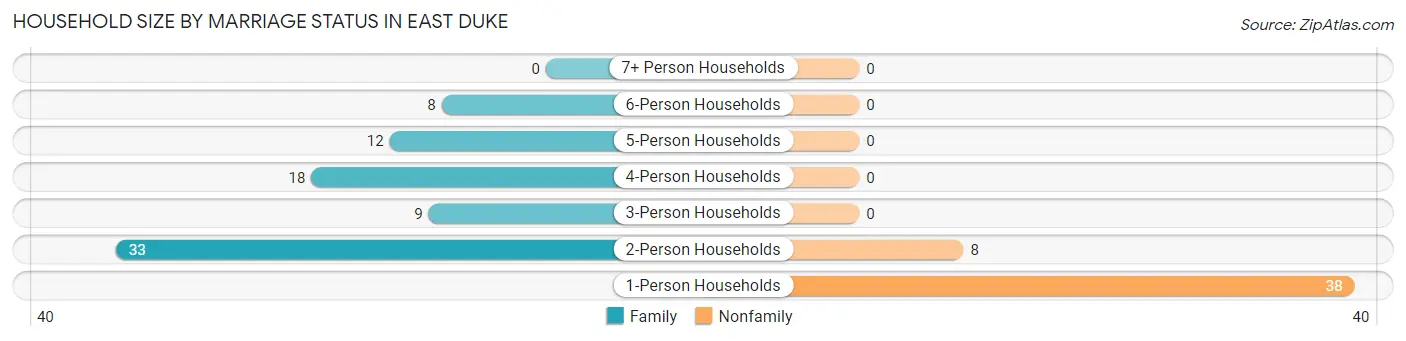
Household Size by Marriage Status in East Duke
Out of a total of 126 households in East Duke, 80 (63.5%) are family households, while 46 (36.5%) are nonfamily households. The most numerous type of family households are 2-person households, comprising 33, and the most common type of nonfamily households are 1-person households, comprising 38.
| Household Size | Family Households | Nonfamily Households |
| 1-Person Households | - | 38 (30.2%) |
| 2-Person Households | 33 (26.2%) | 8 (6.4%) |
| 3-Person Households | 9 (7.1%) | 0 (0.0%) |
| 4-Person Households | 18 (14.3%) | 0 (0.0%) |
| 5-Person Households | 12 (9.5%) | 0 (0.0%) |
| 6-Person Households | 8 (6.4%) | 0 (0.0%) |
| 7+ Person Households | 0 (0.0%) | 0 (0.0%) |
| Total | 80 (63.5%) | 46 (36.5%) |
Female Fertility in East Duke
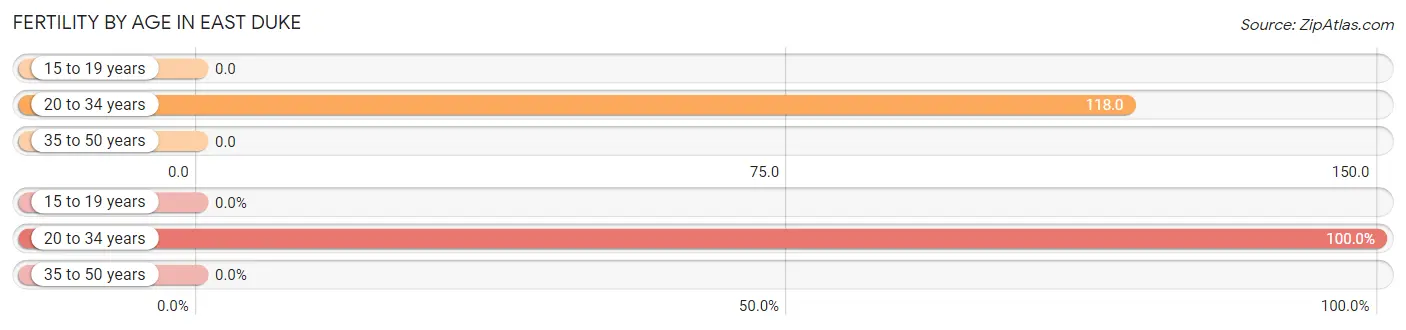
Fertility by Age in East Duke
Average fertility rate in East Duke is 44.0 births per 1,000 women. Women in the age bracket of 20 to 34 years have the highest fertility rate with 118.0 births per 1,000 women. Women in the age bracket of 20 to 34 years acount for 100.0% of all women with births.
| Age Bracket | Women with Births | Births / 1,000 Women |
| 15 to 19 years | 0 (0.0%) | 0.0 |
| 20 to 34 years | 2 (100.0%) | 118.0 |
| 35 to 50 years | 0 (0.0%) | 0.0 |
| Total | 2 (100.0%) | 44.0 |
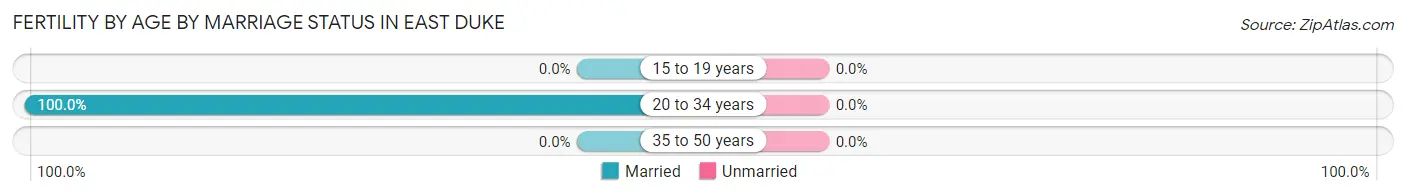
Fertility by Age by Marriage Status in East Duke
| Age Bracket | Married | Unmarried |
| 15 to 19 years | 0 (0.0%) | 0 (0.0%) |
| 20 to 34 years | 2 (100.0%) | 0 (0.0%) |
| 35 to 50 years | 0 (0.0%) | 0 (0.0%) |
| Total | 2 (100.0%) | 0 (0.0%) |
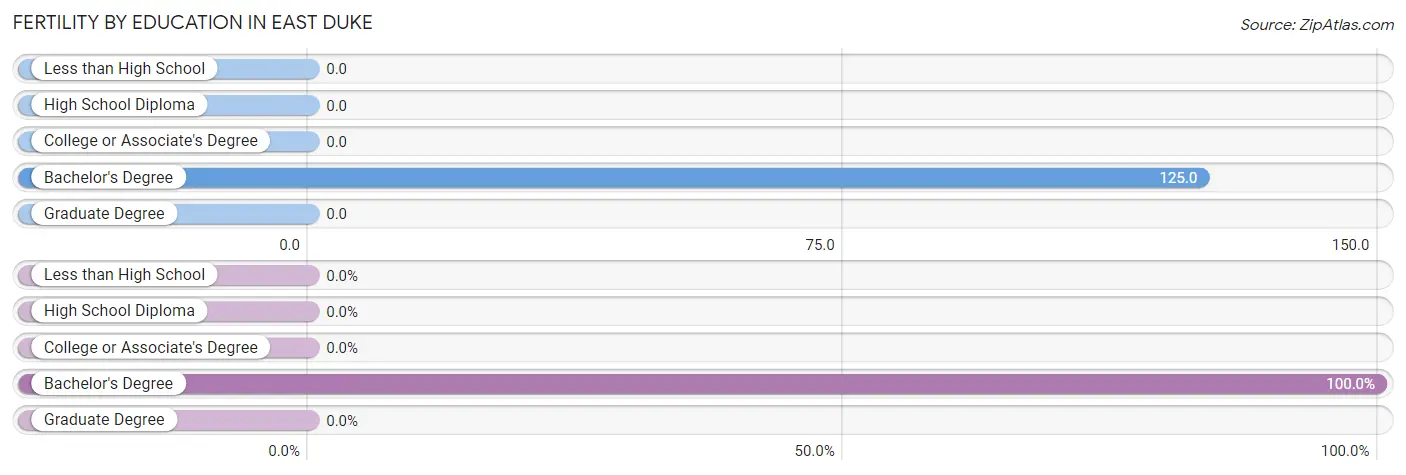
Fertility by Education in East Duke
| Educational Attainment | Women with Births | Births / 1,000 Women |
| Less than High School | 0 (0.0%) | 0.0 |
| High School Diploma | 0 (0.0%) | 0.0 |
| College or Associate's Degree | 0 (0.0%) | 0.0 |
| Bachelor's Degree | 2 (100.0%) | 125.0 |
| Graduate Degree | 0 (0.0%) | 0.0 |
| Total | 2 (100.0%) | 44.0 |
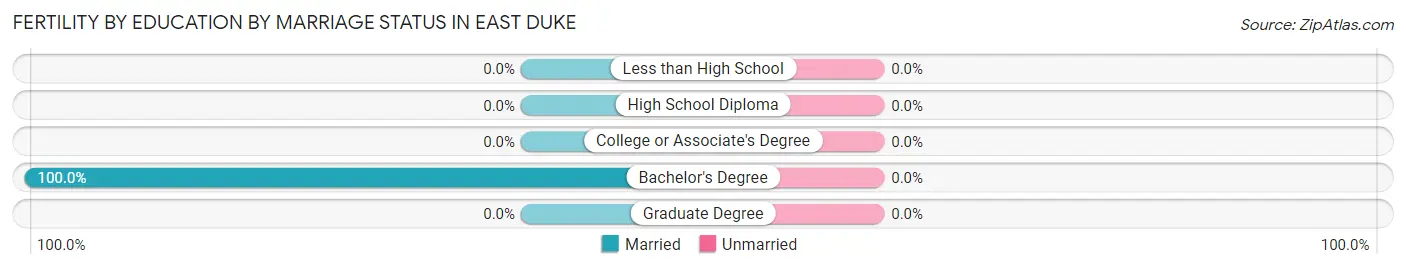
Fertility by Education by Marriage Status in East Duke
| Educational Attainment | Married | Unmarried |
| Less than High School | 0 (0.0%) | 0 (0.0%) |
| High School Diploma | 0 (0.0%) | 0 (0.0%) |
| College or Associate's Degree | 0 (0.0%) | 0 (0.0%) |
| Bachelor's Degree | 2 (100.0%) | 0 (0.0%) |
| Graduate Degree | 0 (0.0%) | 0 (0.0%) |
| Total | 2 (100.0%) | 0 (0.0%) |
Income in East Duke
Income Overview in East Duke
Per Capita Income in East Duke is $34,283, while median incomes of families and households are $84,375 and $60,000 respectively.
| Characteristic | Number | Measure |
| Per Capita Income | 346 | $34,283 |
| Median Family Income | 80 | $84,375 |
| Mean Family Income | 80 | $88,011 |
| Median Household Income | 126 | $60,000 |
| Mean Household Income | 126 | $92,450 |
| Income Deficit | 80 | $0 |
| Wage / Income Gap (%) | 346 | 35.51% |
| Wage / Income Gap ($) | 346 | 64.49¢ per $1 |
| Gini / Inequality Index | 346 | 0.48 |
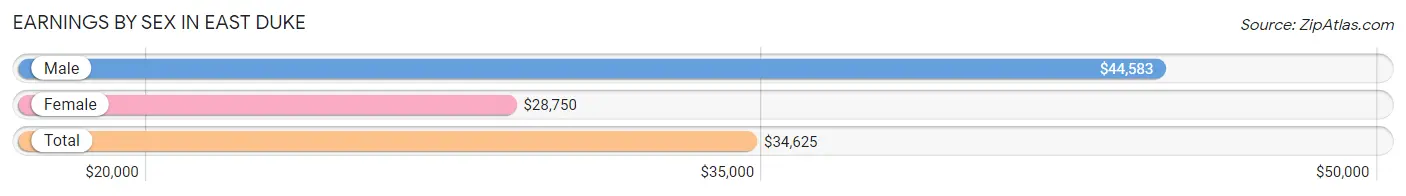
Earnings by Sex in East Duke
Average Earnings in East Duke are $34,625, $44,583 for men and $28,750 for women, a difference of 35.5%.
| Sex | Number | Average Earnings |
| Male | 113 (64.6%) | $44,583 |
| Female | 62 (35.4%) | $28,750 |
| Total | 175 (100.0%) | $34,625 |
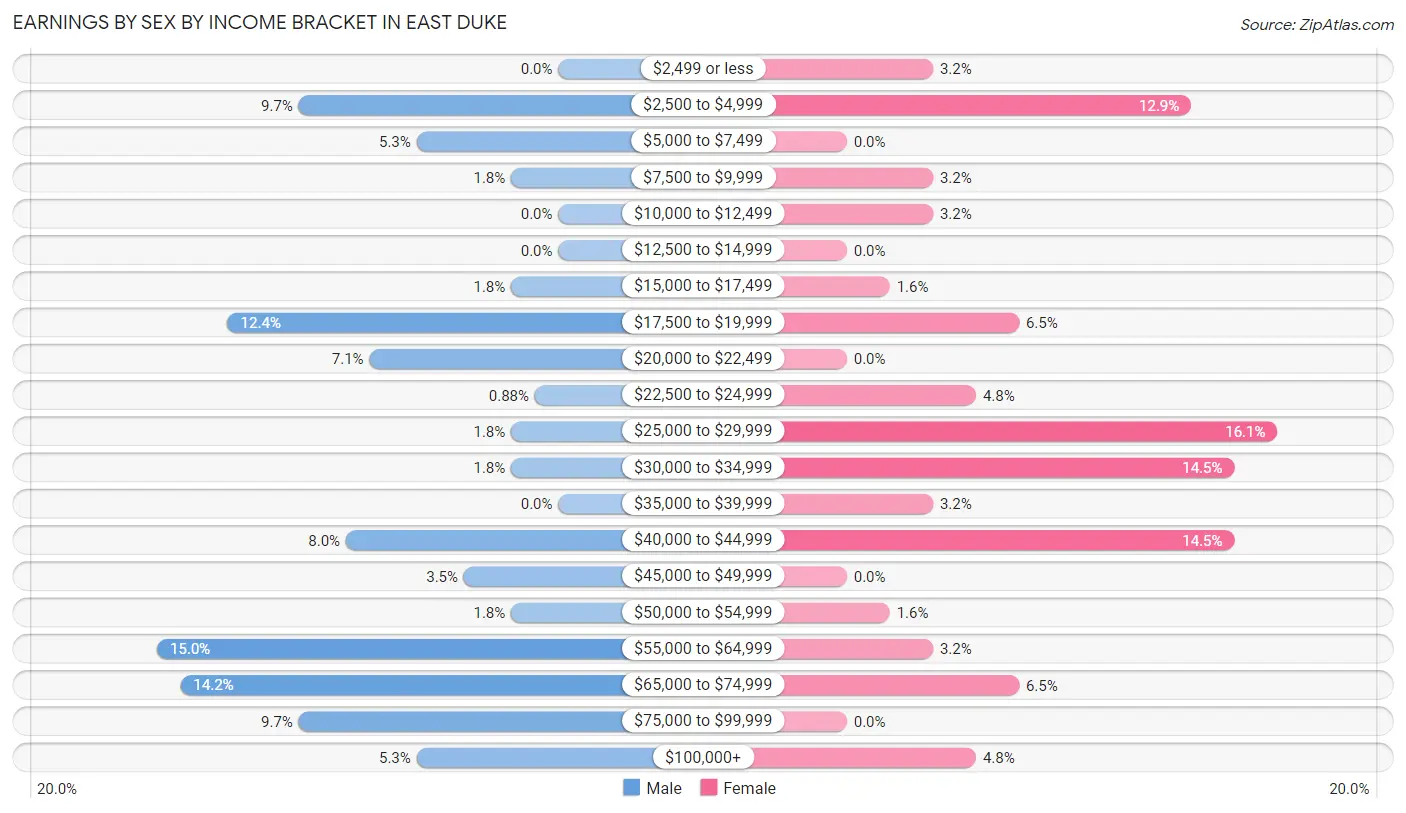
Earnings by Sex by Income Bracket in East Duke
The most common earnings brackets in East Duke are $55,000 to $64,999 for men (17 | 15.0%) and $25,000 to $29,999 for women (10 | 16.1%).
| Income | Male | Female |
| $2,499 or less | 0 (0.0%) | 2 (3.2%) |
| $2,500 to $4,999 | 11 (9.7%) | 8 (12.9%) |
| $5,000 to $7,499 | 6 (5.3%) | 0 (0.0%) |
| $7,500 to $9,999 | 2 (1.8%) | 2 (3.2%) |
| $10,000 to $12,499 | 0 (0.0%) | 2 (3.2%) |
| $12,500 to $14,999 | 0 (0.0%) | 0 (0.0%) |
| $15,000 to $17,499 | 2 (1.8%) | 1 (1.6%) |
| $17,500 to $19,999 | 14 (12.4%) | 4 (6.5%) |
| $20,000 to $22,499 | 8 (7.1%) | 0 (0.0%) |
| $22,500 to $24,999 | 1 (0.9%) | 3 (4.8%) |
| $25,000 to $29,999 | 2 (1.8%) | 10 (16.1%) |
| $30,000 to $34,999 | 2 (1.8%) | 9 (14.5%) |
| $35,000 to $39,999 | 0 (0.0%) | 2 (3.2%) |
| $40,000 to $44,999 | 9 (8.0%) | 9 (14.5%) |
| $45,000 to $49,999 | 4 (3.5%) | 0 (0.0%) |
| $50,000 to $54,999 | 2 (1.8%) | 1 (1.6%) |
| $55,000 to $64,999 | 17 (15.0%) | 2 (3.2%) |
| $65,000 to $74,999 | 16 (14.2%) | 4 (6.5%) |
| $75,000 to $99,999 | 11 (9.7%) | 0 (0.0%) |
| $100,000+ | 6 (5.3%) | 3 (4.8%) |
| Total | 113 (100.0%) | 62 (100.0%) |
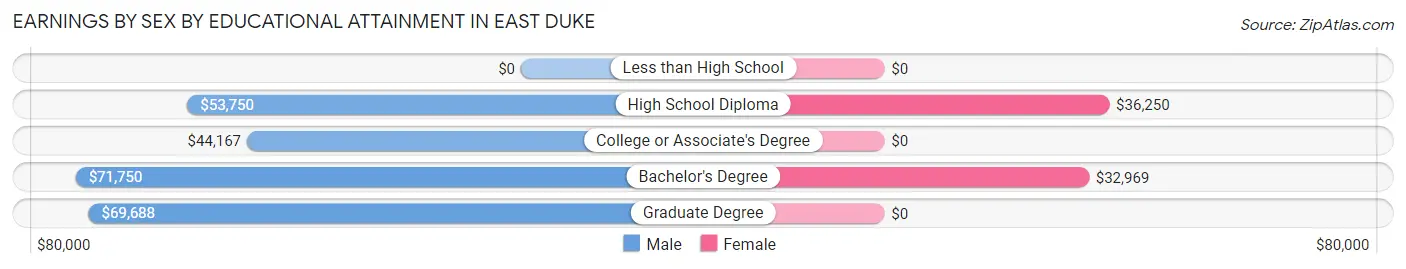
Earnings by Sex by Educational Attainment in East Duke
Average earnings in East Duke are $57,083 for men and $32,813 for women, a difference of 42.5%. Men with an educational attainment of bachelor's degree enjoy the highest average annual earnings of $71,750, while those with college or associate's degree education earn the least with $44,167. Women with an educational attainment of high school diploma earn the most with the average annual earnings of $36,250, while those with bachelor's degree education have the smallest earnings of $32,969.
| Educational Attainment | Male Income | Female Income |
| Less than High School | - | - |
| High School Diploma | $53,750 | $36,250 |
| College or Associate's Degree | $44,167 | $0 |
| Bachelor's Degree | $71,750 | $32,969 |
| Graduate Degree | $69,688 | $0 |
| Total | $57,083 | $32,813 |
Family Income in East Duke
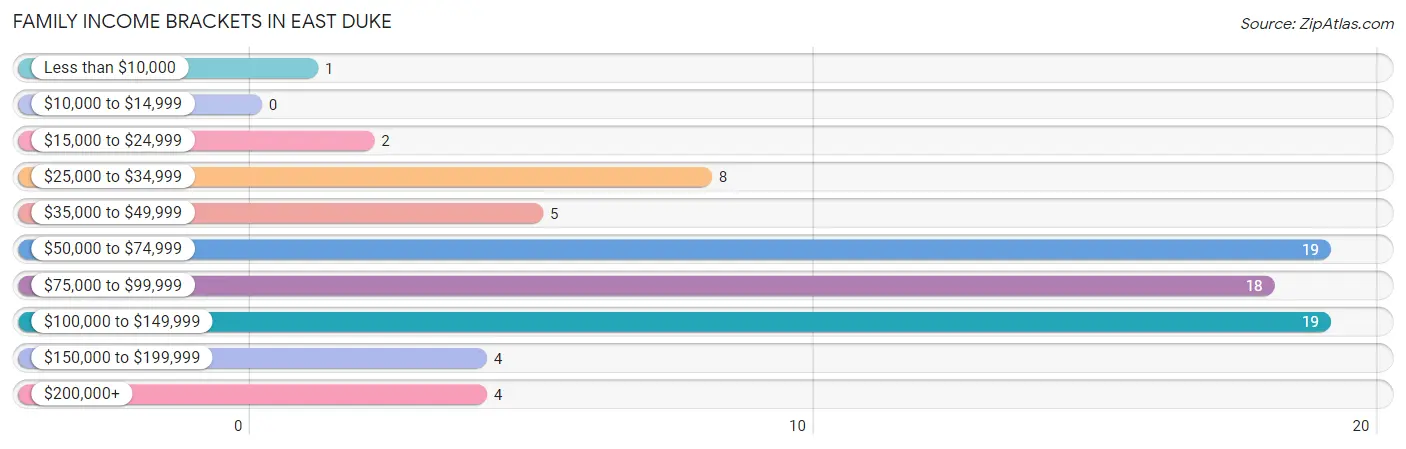
Family Income Brackets in East Duke
According to the East Duke family income data, there are 19 families falling into the $50,000 to $74,999 income range, which is the most common income bracket and makes up 23.7% of all families.
| Income Bracket | # Families | % Families |
| Less than $10,000 | 1 | 1.3% |
| $10,000 to $14,999 | 0 | 0.0% |
| $15,000 to $24,999 | 2 | 2.5% |
| $25,000 to $34,999 | 8 | 10.0% |
| $35,000 to $49,999 | 5 | 6.3% |
| $50,000 to $74,999 | 19 | 23.8% |
| $75,000 to $99,999 | 18 | 22.5% |
| $100,000 to $149,999 | 19 | 23.8% |
| $150,000 to $199,999 | 4 | 5.0% |
| $200,000+ | 4 | 5.0% |
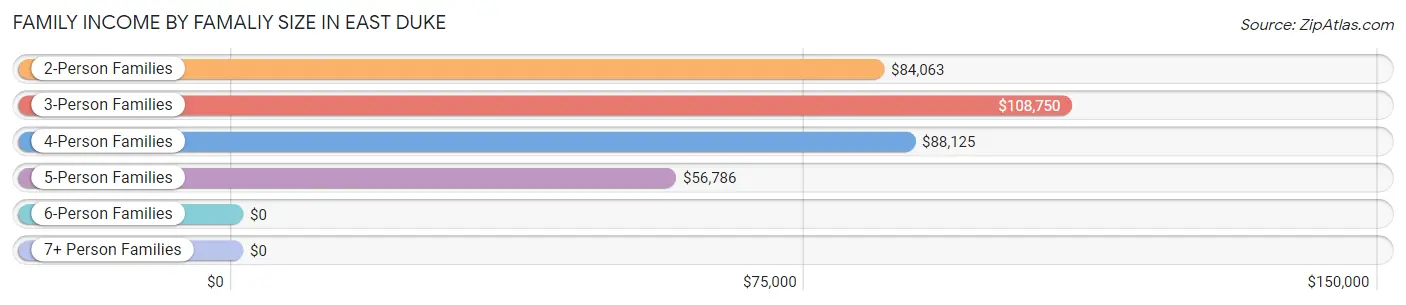
Family Income by Famaliy Size in East Duke
3-person families (9 | 11.3%) account for the highest median family income in East Duke with $108,750 per family, while 2-person families (33 | 41.2%) have the highest median income of $42,032 per family member.
| Income Bracket | # Families | Median Income |
| 2-Person Families | 33 (41.2%) | $84,063 |
| 3-Person Families | 9 (11.3%) | $108,750 |
| 4-Person Families | 18 (22.5%) | $88,125 |
| 5-Person Families | 12 (15.0%) | $56,786 |
| 6-Person Families | 8 (10.0%) | $0 |
| 7+ Person Families | 0 (0.0%) | $0 |
| Total | 80 (100.0%) | $84,375 |
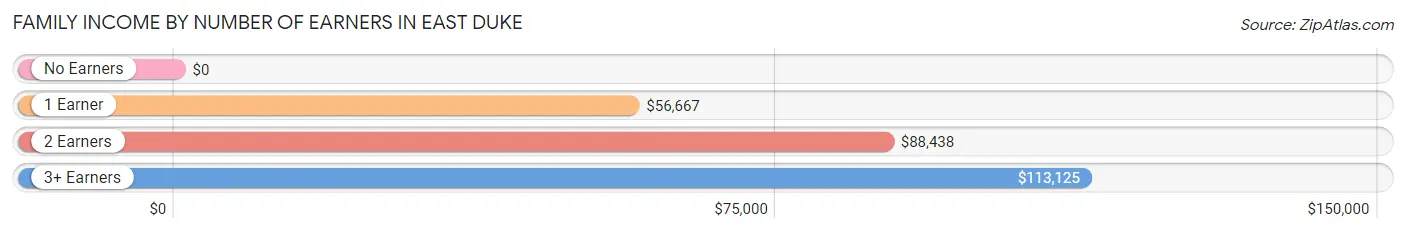
Family Income by Number of Earners in East Duke
| Number of Earners | # Families | Median Income |
| No Earners | 13 (16.3%) | $0 |
| 1 Earner | 20 (25.0%) | $56,667 |
| 2 Earners | 33 (41.2%) | $88,438 |
| 3+ Earners | 14 (17.5%) | $113,125 |
| Total | 80 (100.0%) | $84,375 |
Household Income in East Duke
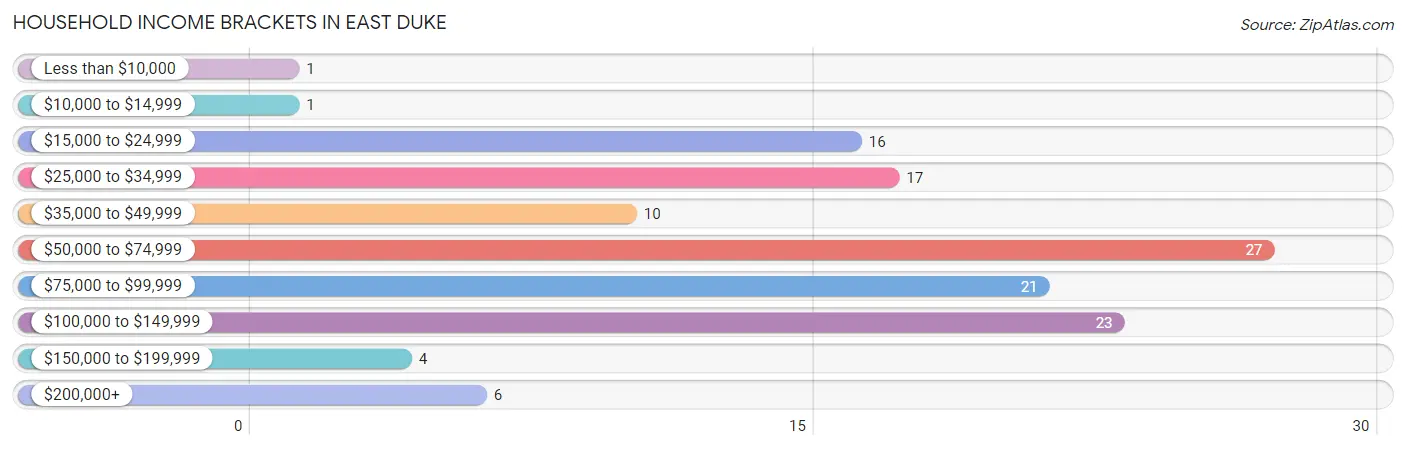
Household Income Brackets in East Duke
With 27 households falling in the category, the $50,000 to $74,999 income range is the most frequent in East Duke, accounting for 21.4% of all households. In contrast, only 1 households (0.8%) fall into the less than $10,000 income bracket, making it the least populous group.
| Income Bracket | # Households | % Households |
| Less than $10,000 | 1 | 0.8% |
| $10,000 to $14,999 | 1 | 0.8% |
| $15,000 to $24,999 | 16 | 12.7% |
| $25,000 to $34,999 | 17 | 13.5% |
| $35,000 to $49,999 | 10 | 7.9% |
| $50,000 to $74,999 | 27 | 21.4% |
| $75,000 to $99,999 | 21 | 16.7% |
| $100,000 to $149,999 | 23 | 18.3% |
| $150,000 to $199,999 | 4 | 3.2% |
| $200,000+ | 6 | 4.8% |
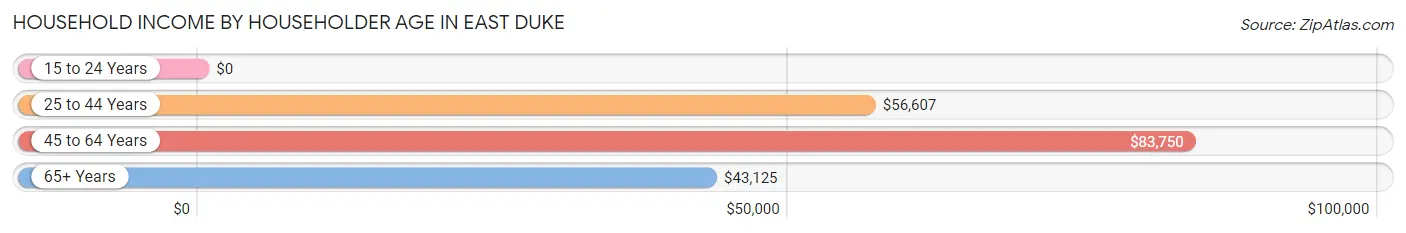
Household Income by Householder Age in East Duke
The median household income in East Duke is $60,000, with the highest median household income of $83,750 found in the 45 to 64 years age bracket for the primary householder. A total of 36 households (28.6%) fall into this category.
| Income Bracket | # Households | Median Income |
| 15 to 24 Years | 0 (0.0%) | $0 |
| 25 to 44 Years | 45 (35.7%) | $56,607 |
| 45 to 64 Years | 36 (28.6%) | $83,750 |
| 65+ Years | 45 (35.7%) | $43,125 |
| Total | 126 (100.0%) | $60,000 |
Poverty in East Duke
Income Below Poverty by Sex and Age in East Duke
With 2.8% poverty level for males and 3.7% for females among the residents of East Duke, 25 to 34 year old males and 6 to 11 year old females are the most vulnerable to poverty, with 3 males (14.3%) and 4 females (17.4%) in their respective age groups living below the poverty level.
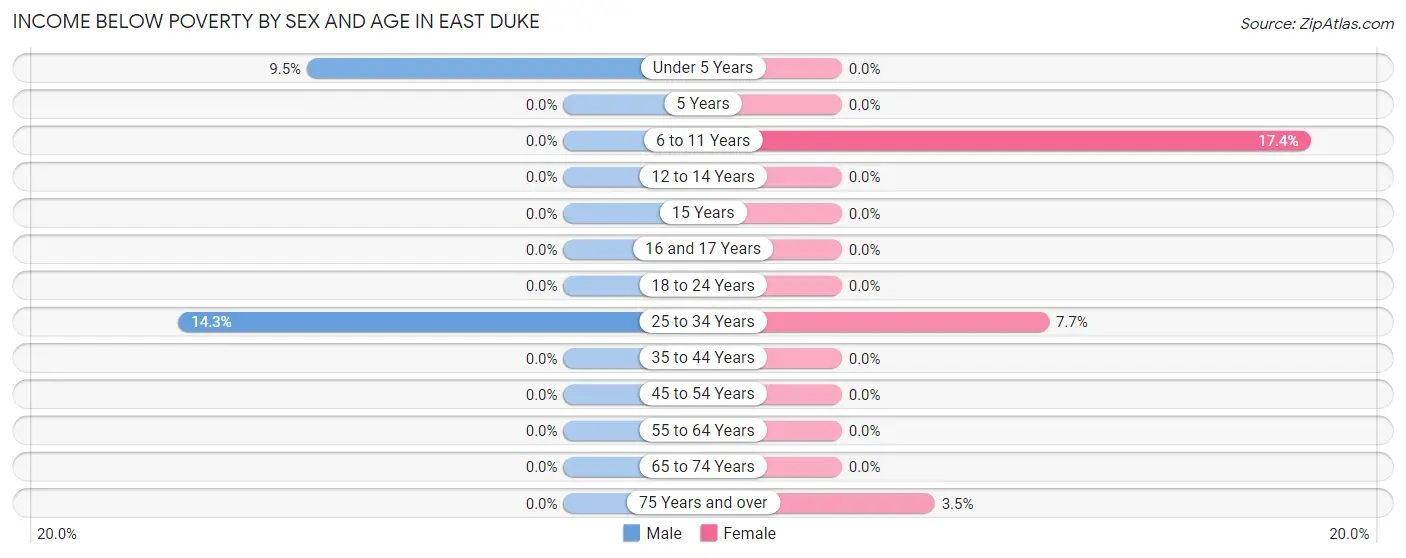
| Age Bracket | Male | Female |
| Under 5 Years | 2 (9.5%) | 0 (0.0%) |
| 5 Years | 0 (0.0%) | 0 (0.0%) |
| 6 to 11 Years | 0 (0.0%) | 4 (17.4%) |
| 12 to 14 Years | 0 (0.0%) | 0 (0.0%) |
| 15 Years | 0 (0.0%) | 0 (0.0%) |
| 16 and 17 Years | 0 (0.0%) | 0 (0.0%) |
| 18 to 24 Years | 0 (0.0%) | 0 (0.0%) |
| 25 to 34 Years | 3 (14.3%) | 1 (7.7%) |
| 35 to 44 Years | 0 (0.0%) | 0 (0.0%) |
| 45 to 54 Years | 0 (0.0%) | 0 (0.0%) |
| 55 to 64 Years | 0 (0.0%) | 0 (0.0%) |
| 65 to 74 Years | 0 (0.0%) | 0 (0.0%) |
| 75 Years and over | 0 (0.0%) | 1 (3.5%) |
| Total | 5 (2.8%) | 6 (3.7%) |
Income Above Poverty by Sex and Age in East Duke
According to the poverty statistics in East Duke, males aged 6 to 11 years and females aged under 5 years are the age groups that are most secure financially, with 100.0% of males and 100.0% of females in these age groups living above the poverty line.
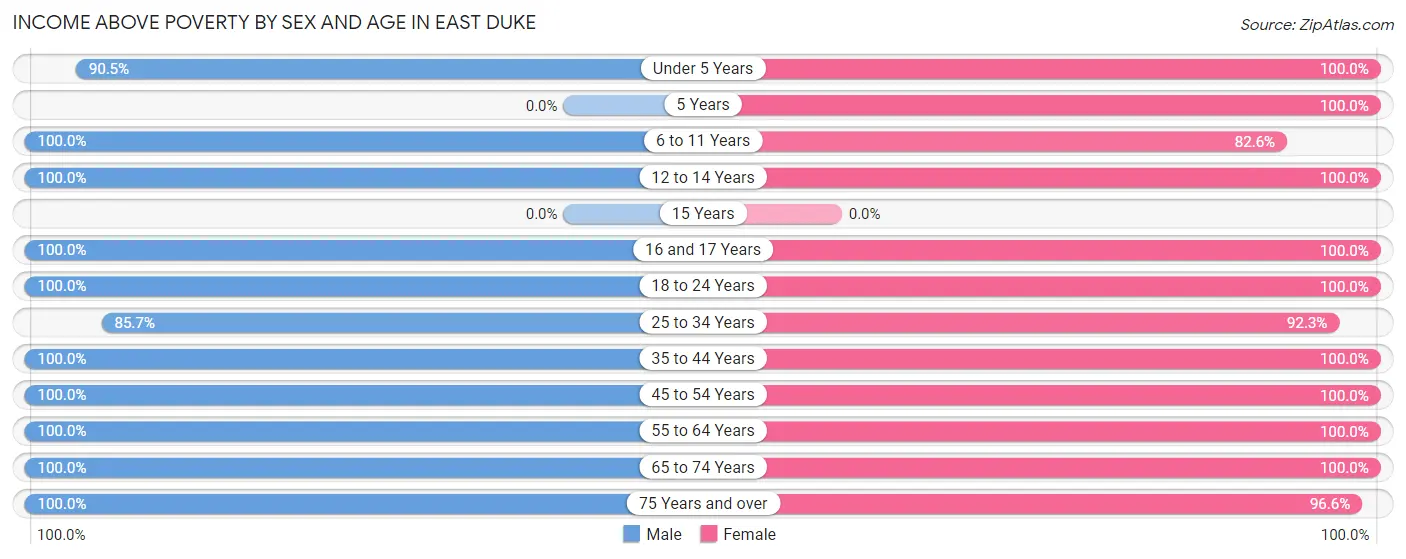
| Age Bracket | Male | Female |
| Under 5 Years | 19 (90.5%) | 21 (100.0%) |
| 5 Years | 0 (0.0%) | 2 (100.0%) |
| 6 to 11 Years | 10 (100.0%) | 19 (82.6%) |
| 12 to 14 Years | 11 (100.0%) | 2 (100.0%) |
| 15 Years | 0 (0.0%) | 0 (0.0%) |
| 16 and 17 Years | 6 (100.0%) | 2 (100.0%) |
| 18 to 24 Years | 25 (100.0%) | 4 (100.0%) |
| 25 to 34 Years | 18 (85.7%) | 12 (92.3%) |
| 35 to 44 Years | 29 (100.0%) | 24 (100.0%) |
| 45 to 54 Years | 14 (100.0%) | 3 (100.0%) |
| 55 to 64 Years | 21 (100.0%) | 23 (100.0%) |
| 65 to 74 Years | 16 (100.0%) | 18 (100.0%) |
| 75 Years and over | 8 (100.0%) | 28 (96.6%) |
| Total | 177 (97.3%) | 158 (96.3%) |
Income Below Poverty Among Married-Couple Families in East Duke
The poverty statistics for married-couple families in East Duke show that 1.5% or 1 of the total 67 families live below the poverty line. Families with 3 or 4 children have the highest poverty rate of 5.0%, comprising of 1 families. On the other hand, families with no children have the lowest poverty rate of 0.0%, which includes 0 families.
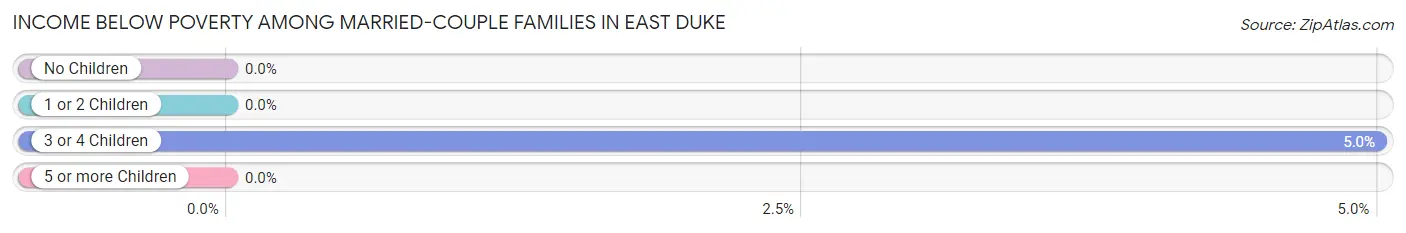
| Children | Above Poverty | Below Poverty |
| No Children | 29 (100.0%) | 0 (0.0%) |
| 1 or 2 Children | 18 (100.0%) | 0 (0.0%) |
| 3 or 4 Children | 19 (95.0%) | 1 (5.0%) |
| 5 or more Children | 0 (0.0%) | 0 (0.0%) |
| Total | 66 (98.5%) | 1 (1.5%) |
Income Below Poverty Among Single-Parent Households in East Duke
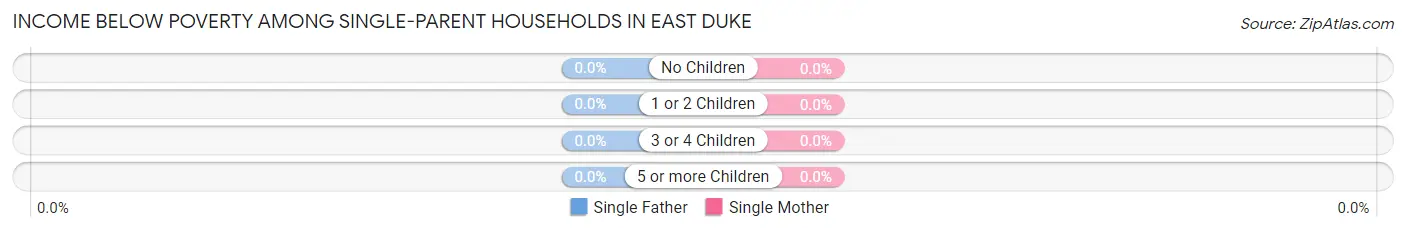
| Children | Single Father | Single Mother |
| No Children | 0 (0.0%) | 0 (0.0%) |
| 1 or 2 Children | 0 (0.0%) | 0 (0.0%) |
| 3 or 4 Children | 0 (0.0%) | 0 (0.0%) |
| 5 or more Children | 0 (0.0%) | 0 (0.0%) |
| Total | 0 (0.0%) | 0 (0.0%) |
Income Below Poverty Among Married-Couple vs Single-Parent Households in East Duke
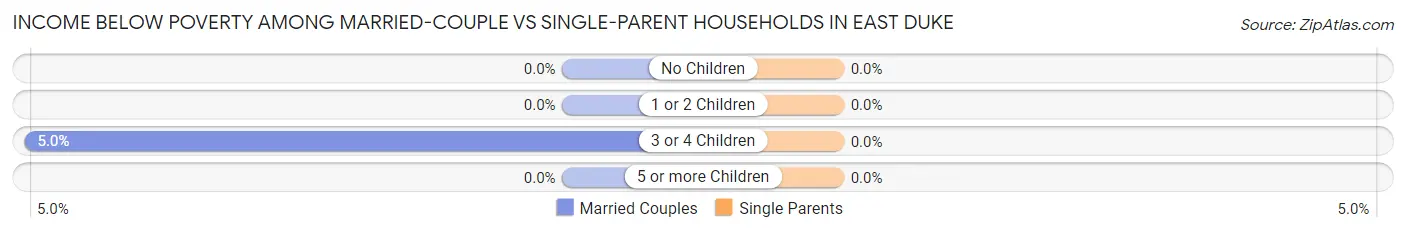
| Children | Married-Couple Families | Single-Parent Households |
| No Children | 0 (0.0%) | 0 (0.0%) |
| 1 or 2 Children | 0 (0.0%) | 0 (0.0%) |
| 3 or 4 Children | 1 (5.0%) | 0 (0.0%) |
| 5 or more Children | 0 (0.0%) | 0 (0.0%) |
| Total | 1 (1.5%) | 0 (0.0%) |
Employment Characteristics in East Duke
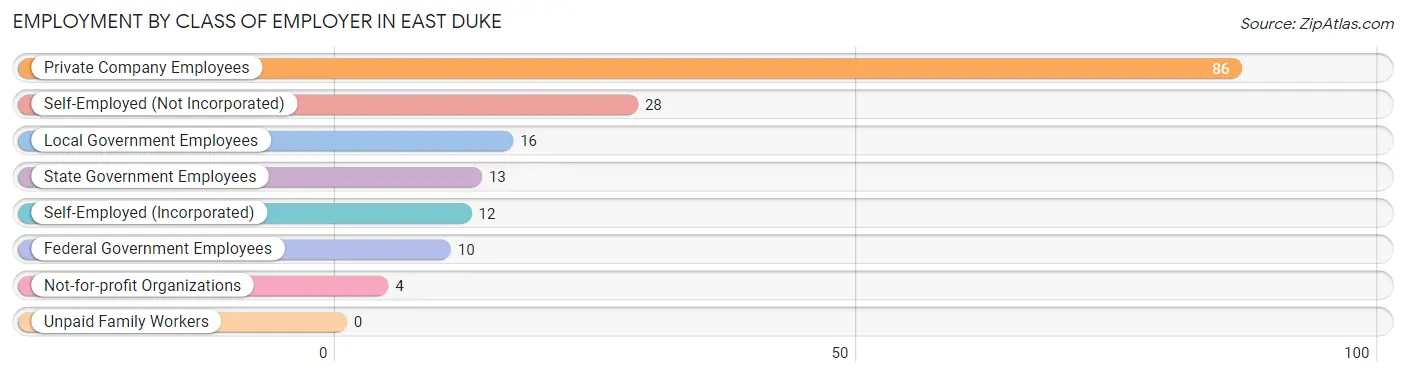
Employment by Class of Employer in East Duke
Among the 169 employed individuals in East Duke, private company employees (86 | 50.9%), self-employed (not incorporated) (28 | 16.6%), and local government employees (16 | 9.5%) make up the most common classes of employment.
| Employer Class | # Employees | % Employees |
| Private Company Employees | 86 | 50.9% |
| Self-Employed (Incorporated) | 12 | 7.1% |
| Self-Employed (Not Incorporated) | 28 | 16.6% |
| Not-for-profit Organizations | 4 | 2.4% |
| Local Government Employees | 16 | 9.5% |
| State Government Employees | 13 | 7.7% |
| Federal Government Employees | 10 | 5.9% |
| Unpaid Family Workers | 0 | 0.0% |
| Total | 169 | 100.0% |
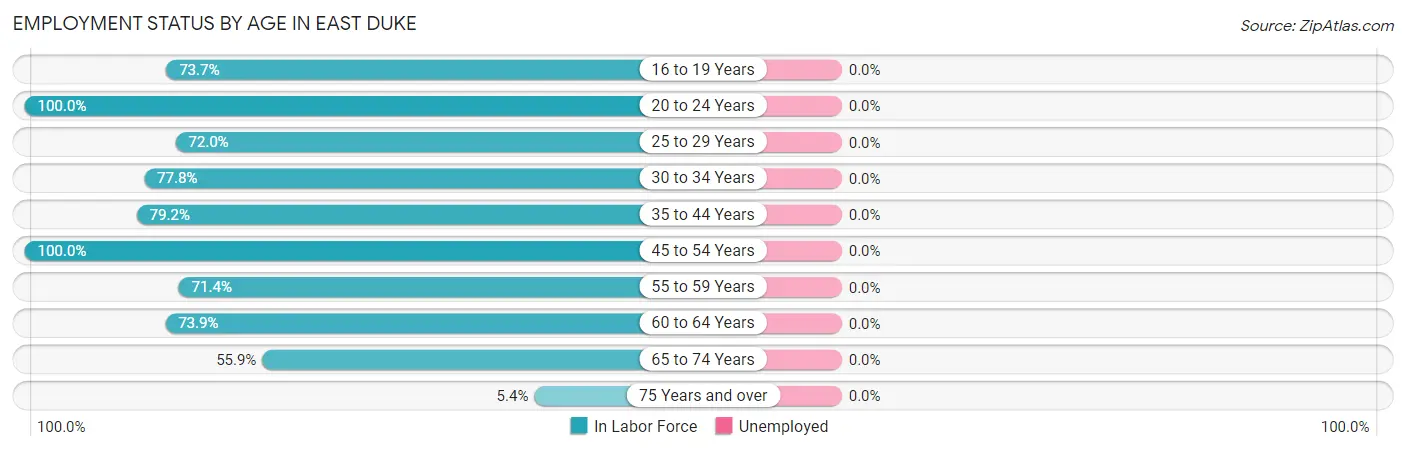
Employment Status by Age in East Duke
| Age Bracket | In Labor Force | Unemployed |
| 16 to 19 Years | 14 (73.7%) | 0 (0.0%) |
| 20 to 24 Years | 18 (100.0%) | 0 (0.0%) |
| 25 to 29 Years | 18 (72.0%) | 0 (0.0%) |
| 30 to 34 Years | 7 (77.8%) | 0 (0.0%) |
| 35 to 44 Years | 42 (79.2%) | 0 (0.0%) |
| 45 to 54 Years | 17 (100.0%) | 0 (0.0%) |
| 55 to 59 Years | 15 (71.4%) | 0 (0.0%) |
| 60 to 64 Years | 17 (73.9%) | 0 (0.0%) |
| 65 to 74 Years | 19 (55.9%) | 0 (0.0%) |
| 75 Years and over | 2 (5.4%) | 0 (0.0%) |
| Total | 169 (66.0%) | 0 (0.0%) |
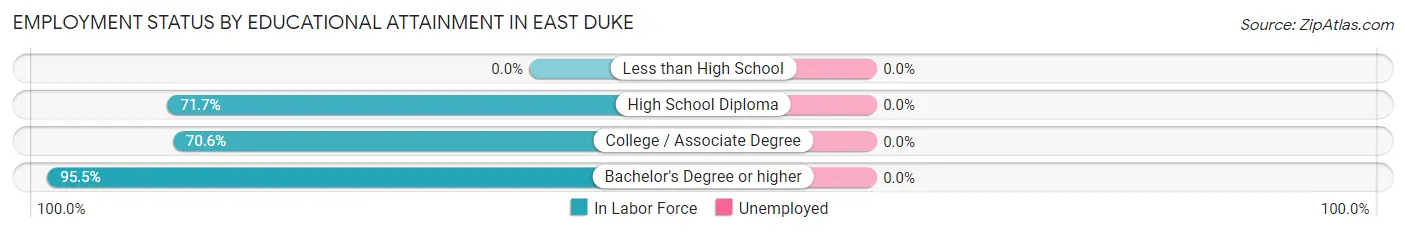
Employment Status by Educational Attainment in East Duke
| Educational Attainment | In Labor Force | Unemployed |
| Less than High School | 0 (0.0%) | 0 (0.0%) |
| High School Diploma | 38 (71.7%) | 0 (0.0%) |
| College / Associate Degree | 36 (70.6%) | 0 (0.0%) |
| Bachelor's Degree or higher | 42 (95.5%) | 0 (0.0%) |
| Total | 116 (78.4%) | 0 (0.0%) |
Employment Occupations by Sex in East Duke
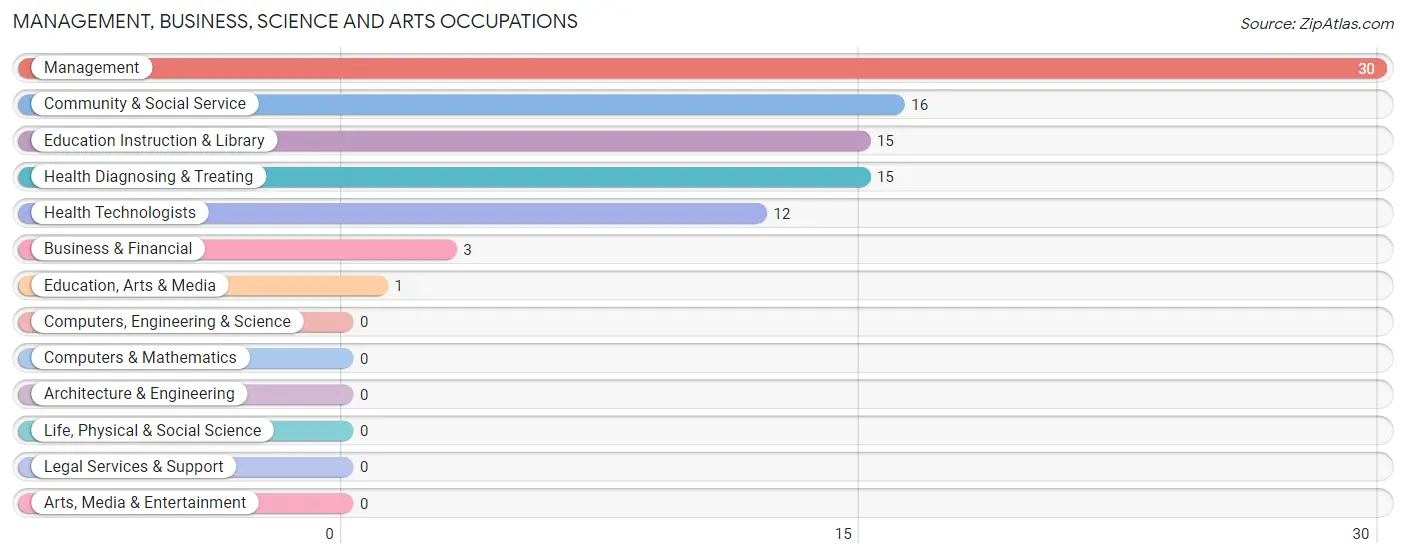
Management, Business, Science and Arts Occupations
The most common Management, Business, Science and Arts occupations in East Duke are Management (30 | 18.2%), Community & Social Service (16 | 9.7%), Education Instruction & Library (15 | 9.1%), Health Diagnosing & Treating (15 | 9.1%), and Health Technologists (12 | 7.3%).
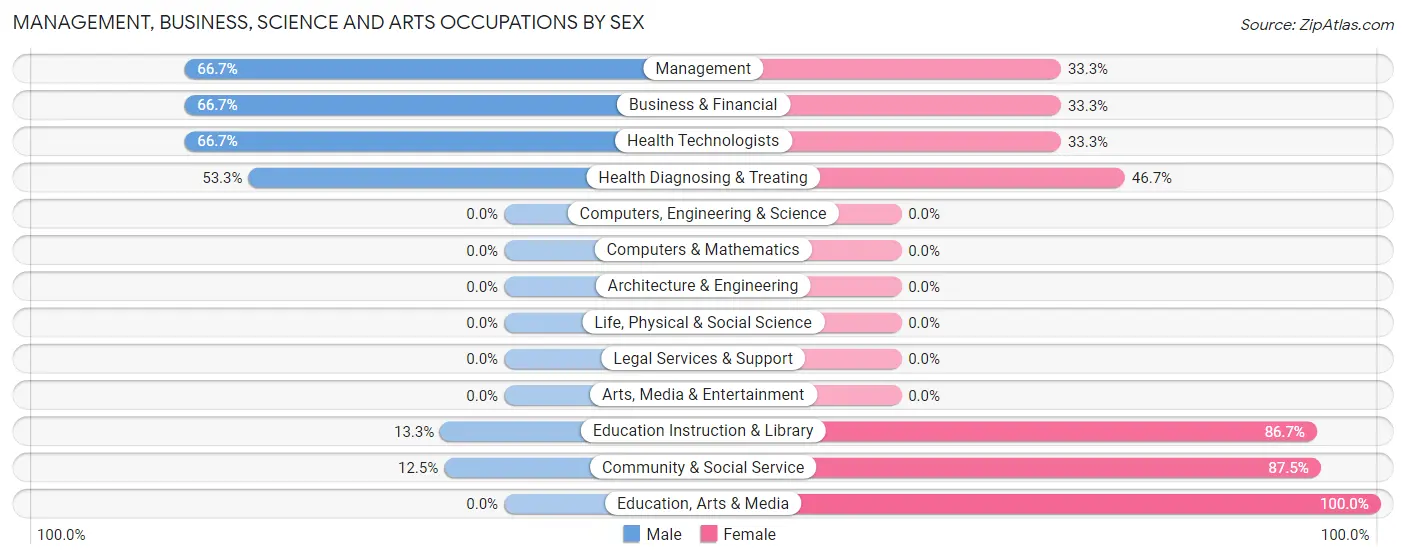
Management, Business, Science and Arts Occupations by Sex
Within the Management, Business, Science and Arts occupations in East Duke, the most male-oriented occupations are Management (66.7%), Business & Financial (66.7%), and Health Technologists (66.7%), while the most female-oriented occupations are Education, Arts & Media (100.0%), Community & Social Service (87.5%), and Education Instruction & Library (86.7%).
| Occupation | Male | Female |
| Management | 20 (66.7%) | 10 (33.3%) |
| Business & Financial | 2 (66.7%) | 1 (33.3%) |
| Computers, Engineering & Science | 0 (0.0%) | 0 (0.0%) |
| Computers & Mathematics | 0 (0.0%) | 0 (0.0%) |
| Architecture & Engineering | 0 (0.0%) | 0 (0.0%) |
| Life, Physical & Social Science | 0 (0.0%) | 0 (0.0%) |
| Community & Social Service | 2 (12.5%) | 14 (87.5%) |
| Education, Arts & Media | 0 (0.0%) | 1 (100.0%) |
| Legal Services & Support | 0 (0.0%) | 0 (0.0%) |
| Education Instruction & Library | 2 (13.3%) | 13 (86.7%) |
| Arts, Media & Entertainment | 0 (0.0%) | 0 (0.0%) |
| Health Diagnosing & Treating | 8 (53.3%) | 7 (46.7%) |
| Health Technologists | 8 (66.7%) | 4 (33.3%) |
| Total (Category) | 32 (50.0%) | 32 (50.0%) |
| Total (Overall) | 108 (65.4%) | 57 (34.5%) |
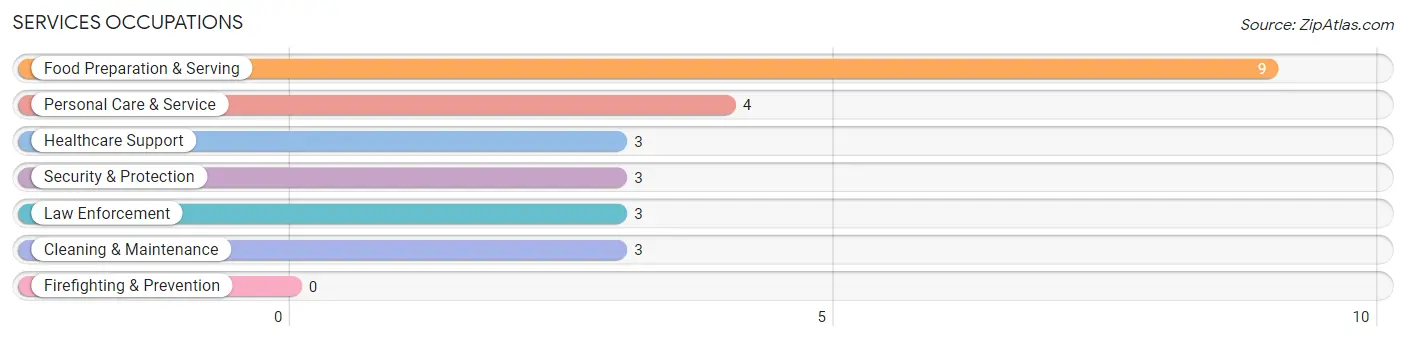
Services Occupations
The most common Services occupations in East Duke are Food Preparation & Serving (9 | 5.4%), Personal Care & Service (4 | 2.4%), Healthcare Support (3 | 1.8%), Security & Protection (3 | 1.8%), and Law Enforcement (3 | 1.8%).
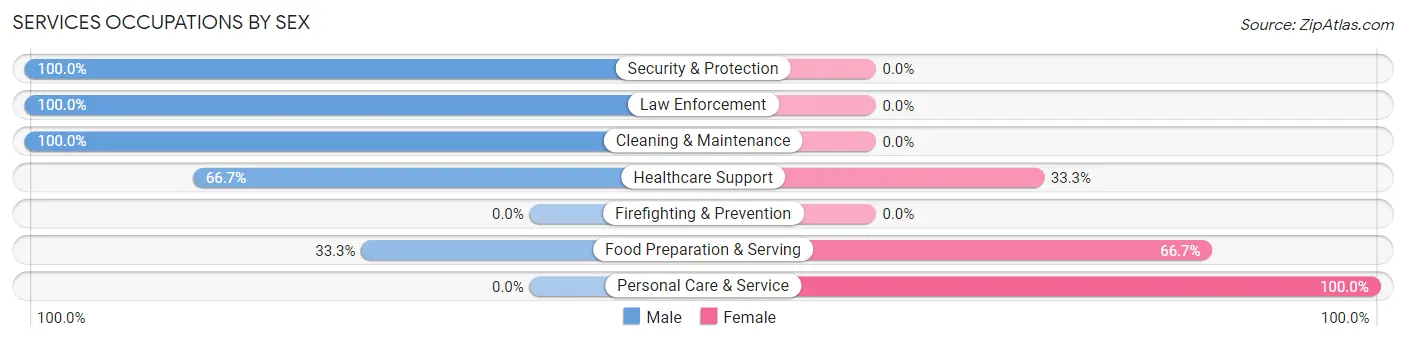
Services Occupations by Sex
Within the Services occupations in East Duke, the most male-oriented occupations are Security & Protection (100.0%), Law Enforcement (100.0%), and Cleaning & Maintenance (100.0%), while the most female-oriented occupations are Personal Care & Service (100.0%), Food Preparation & Serving (66.7%), and Healthcare Support (33.3%).
| Occupation | Male | Female |
| Healthcare Support | 2 (66.7%) | 1 (33.3%) |
| Security & Protection | 3 (100.0%) | 0 (0.0%) |
| Firefighting & Prevention | 0 (0.0%) | 0 (0.0%) |
| Law Enforcement | 3 (100.0%) | 0 (0.0%) |
| Food Preparation & Serving | 3 (33.3%) | 6 (66.7%) |
| Cleaning & Maintenance | 3 (100.0%) | 0 (0.0%) |
| Personal Care & Service | 0 (0.0%) | 4 (100.0%) |
| Total (Category) | 11 (50.0%) | 11 (50.0%) |
| Total (Overall) | 108 (65.4%) | 57 (34.5%) |
Sales and Office Occupations
The most common Sales and Office occupations in East Duke are Office & Administration (28 | 17.0%), and Sales & Related (20 | 12.1%).

Sales and Office Occupations by Sex

| Occupation | Male | Female |
| Sales & Related | 18 (90.0%) | 2 (10.0%) |
| Office & Administration | 16 (57.1%) | 12 (42.9%) |
| Total (Category) | 34 (70.8%) | 14 (29.2%) |
| Total (Overall) | 108 (65.4%) | 57 (34.5%) |
Natural Resources, Construction and Maintenance Occupations
The most common Natural Resources, Construction and Maintenance occupations in East Duke are Farming, Fishing & Forestry (11 | 6.7%), Construction & Extraction (8 | 4.9%), and Installation, Maintenance & Repair (4 | 2.4%).
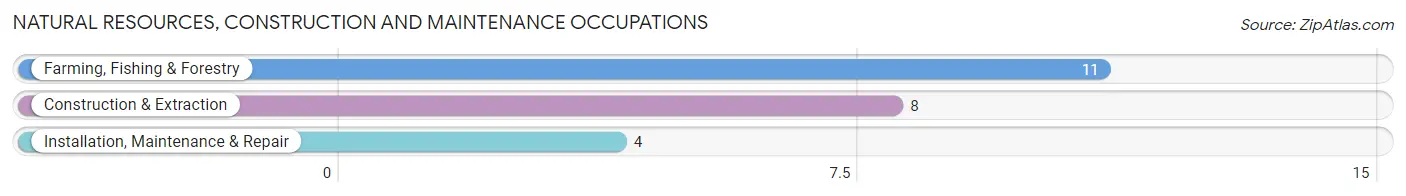
Natural Resources, Construction and Maintenance Occupations by Sex

| Occupation | Male | Female |
| Farming, Fishing & Forestry | 11 (100.0%) | 0 (0.0%) |
| Construction & Extraction | 8 (100.0%) | 0 (0.0%) |
| Installation, Maintenance & Repair | 4 (100.0%) | 0 (0.0%) |
| Total (Category) | 23 (100.0%) | 0 (0.0%) |
| Total (Overall) | 108 (65.4%) | 57 (34.5%) |
Production, Transportation and Moving Occupations
The most common Production, Transportation and Moving occupations in East Duke are Transportation (6 | 3.6%), and Production (2 | 1.2%).
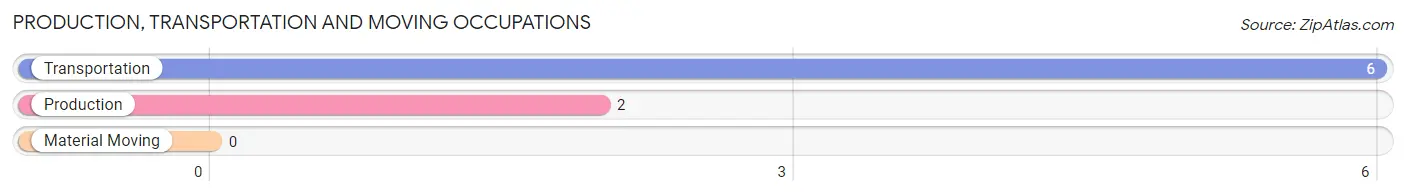
Production, Transportation and Moving Occupations by Sex
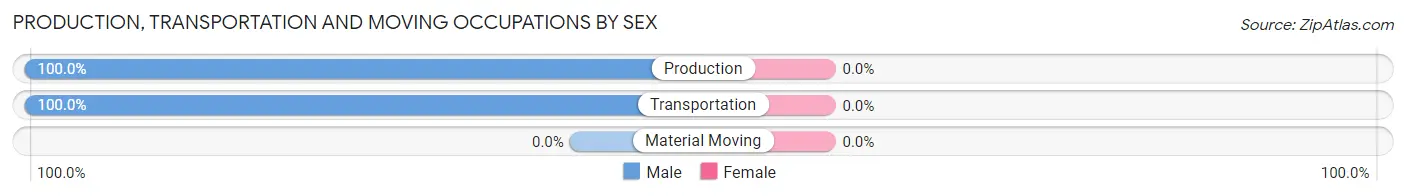
| Occupation | Male | Female |
| Production | 2 (100.0%) | 0 (0.0%) |
| Transportation | 6 (100.0%) | 0 (0.0%) |
| Material Moving | 0 (0.0%) | 0 (0.0%) |
| Total (Category) | 8 (100.0%) | 0 (0.0%) |
| Total (Overall) | 108 (65.4%) | 57 (34.5%) |
Employment Industries by Sex in East Duke
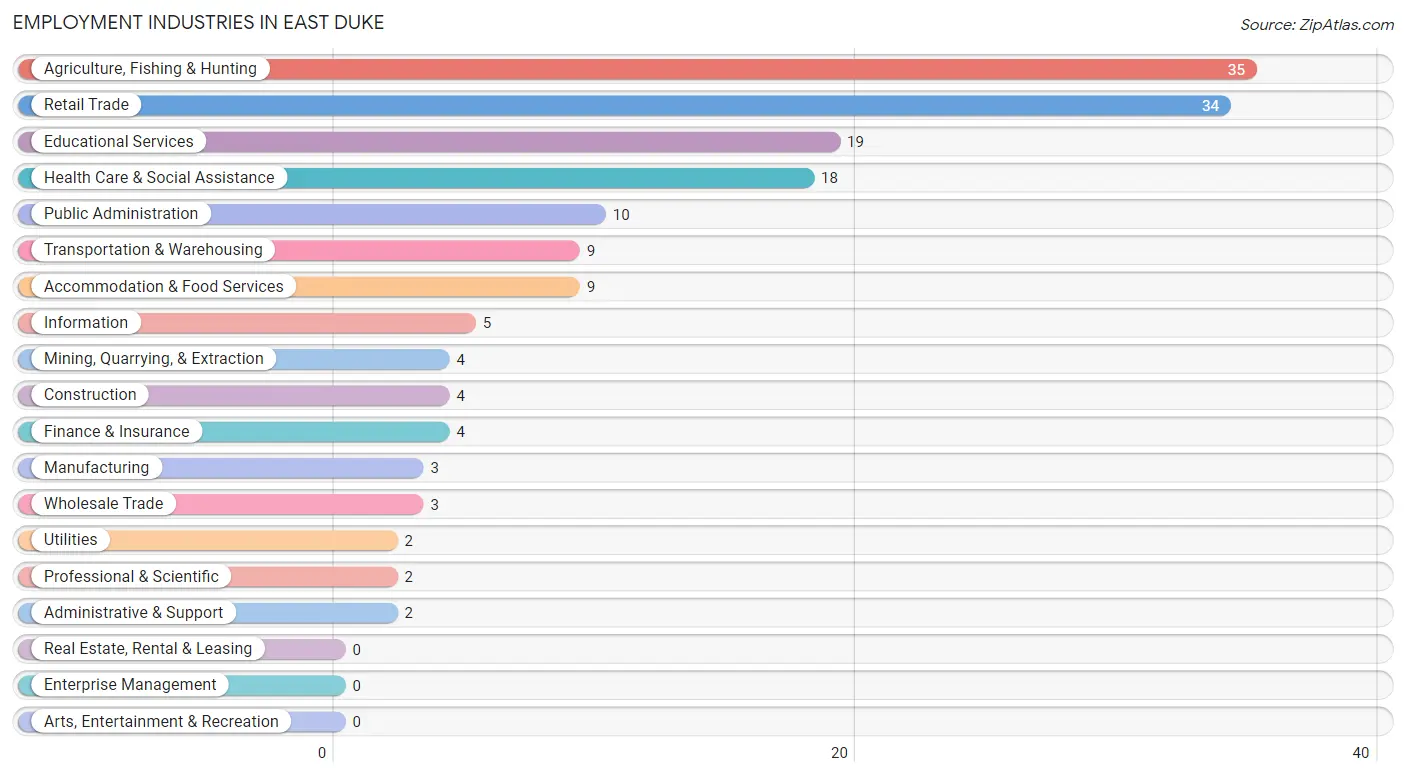
Employment Industries in East Duke
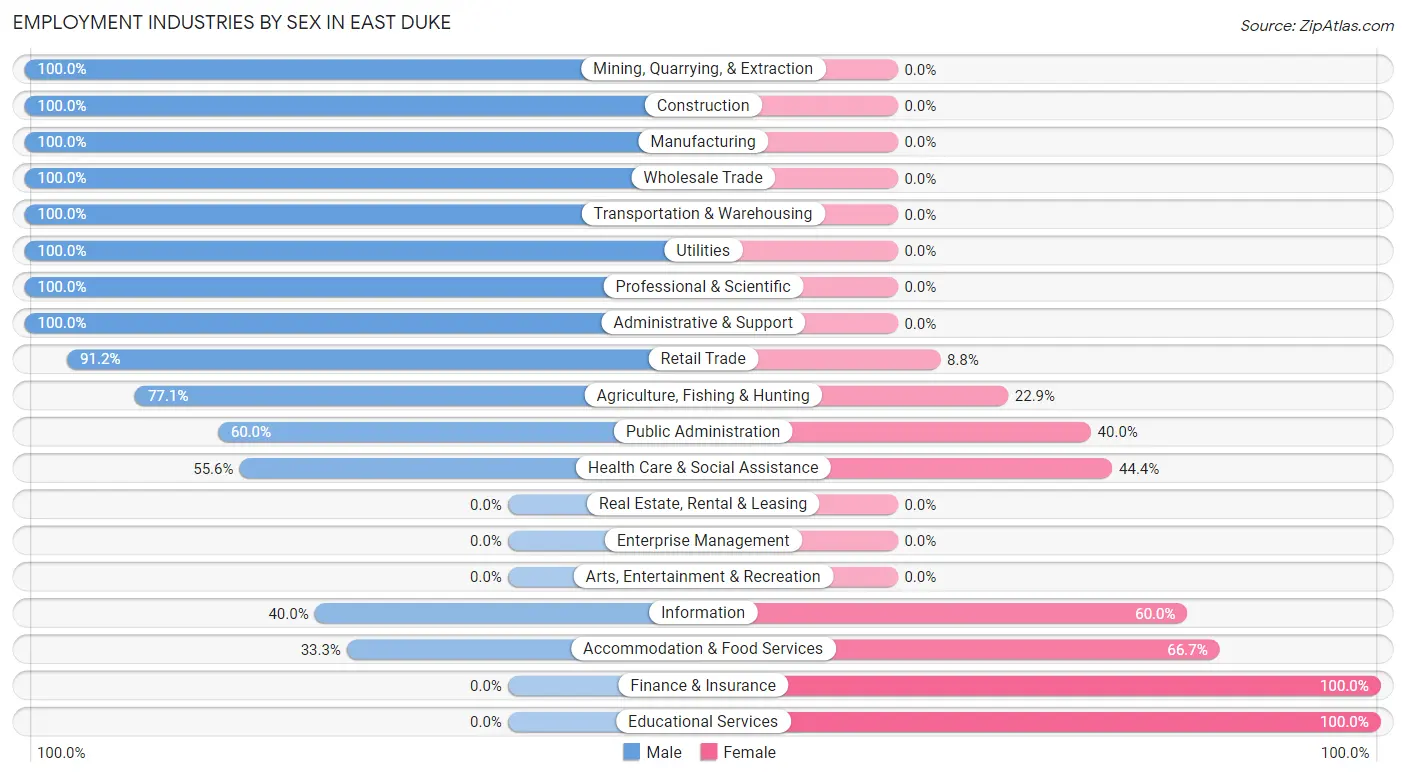
The major employment industries in East Duke include Agriculture, Fishing & Hunting (35 | 21.2%), Retail Trade (34 | 20.6%), Educational Services (19 | 11.5%), Health Care & Social Assistance (18 | 10.9%), and Public Administration (10 | 6.1%).
Employment Industries by Sex in East Duke
The East Duke industries that see more men than women are Mining, Quarrying, & Extraction (100.0%), Construction (100.0%), and Manufacturing (100.0%), whereas the industries that tend to have a higher number of women are Finance & Insurance (100.0%), Educational Services (100.0%), and Accommodation & Food Services (66.7%).
| Industry | Male | Female |
| Agriculture, Fishing & Hunting | 27 (77.1%) | 8 (22.9%) |
| Mining, Quarrying, & Extraction | 4 (100.0%) | 0 (0.0%) |
| Construction | 4 (100.0%) | 0 (0.0%) |
| Manufacturing | 3 (100.0%) | 0 (0.0%) |
| Wholesale Trade | 3 (100.0%) | 0 (0.0%) |
| Retail Trade | 31 (91.2%) | 3 (8.8%) |
| Transportation & Warehousing | 9 (100.0%) | 0 (0.0%) |
| Utilities | 2 (100.0%) | 0 (0.0%) |
| Information | 2 (40.0%) | 3 (60.0%) |
| Finance & Insurance | 0 (0.0%) | 4 (100.0%) |
| Real Estate, Rental & Leasing | 0 (0.0%) | 0 (0.0%) |
| Professional & Scientific | 2 (100.0%) | 0 (0.0%) |
| Enterprise Management | 0 (0.0%) | 0 (0.0%) |
| Administrative & Support | 2 (100.0%) | 0 (0.0%) |
| Educational Services | 0 (0.0%) | 19 (100.0%) |
| Health Care & Social Assistance | 10 (55.6%) | 8 (44.4%) |
| Arts, Entertainment & Recreation | 0 (0.0%) | 0 (0.0%) |
| Accommodation & Food Services | 3 (33.3%) | 6 (66.7%) |
| Public Administration | 6 (60.0%) | 4 (40.0%) |
| Total | 108 (65.4%) | 57 (34.5%) |
Education in East Duke
School Enrollment in East Duke
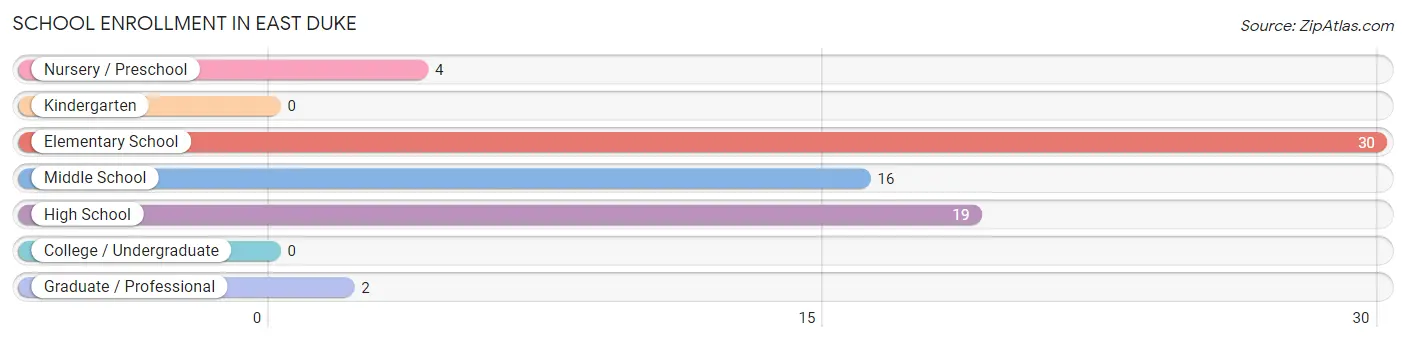
The most common levels of schooling among the 71 students in East Duke are elementary school (30 | 42.2%), high school (19 | 26.8%), and middle school (16 | 22.5%).
| School Level | # Students | % Students |
| Nursery / Preschool | 4 | 5.6% |
| Kindergarten | 0 | 0.0% |
| Elementary School | 30 | 42.2% |
| Middle School | 16 | 22.5% |
| High School | 19 | 26.8% |
| College / Undergraduate | 0 | 0.0% |
| Graduate / Professional | 2 | 2.8% |
| Total | 71 | 100.0% |
School Enrollment by Age by Funding Source in East Duke
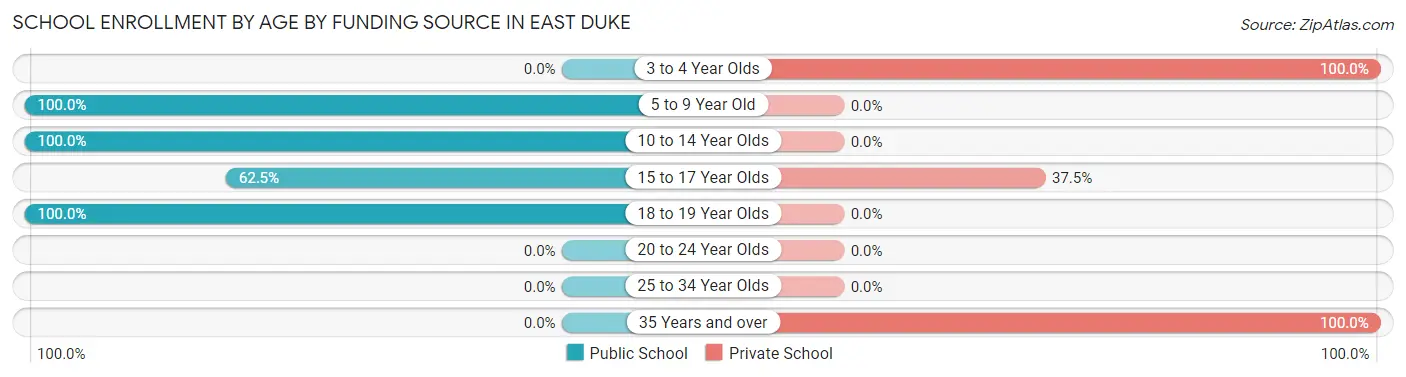
Out of a total of 71 students who are enrolled in schools in East Duke, 7 (9.9%) attend a private institution, while the remaining 64 (90.1%) are enrolled in public schools. The age group of 3 to 4 year olds has the highest likelihood of being enrolled in private schools, with 2 (100.0% in the age bracket) enrolled. Conversely, the age group of 5 to 9 year old has the lowest likelihood of being enrolled in a private school, with 24 (100.0% in the age bracket) attending a public institution.
| Age Bracket | Public School | Private School |
| 3 to 4 Year Olds | 0 (0.0%) | 2 (100.0%) |
| 5 to 9 Year Old | 24 (100.0%) | 0 (0.0%) |
| 10 to 14 Year Olds | 24 (100.0%) | 0 (0.0%) |
| 15 to 17 Year Olds | 5 (62.5%) | 3 (37.5%) |
| 18 to 19 Year Olds | 11 (100.0%) | 0 (0.0%) |
| 20 to 24 Year Olds | 0 (0.0%) | 0 (0.0%) |
| 25 to 34 Year Olds | 0 (0.0%) | 0 (0.0%) |
| 35 Years and over | 0 (0.0%) | 2 (100.0%) |
| Total | 64 (90.1%) | 7 (9.9%) |
Educational Attainment by Field of Study in East Duke
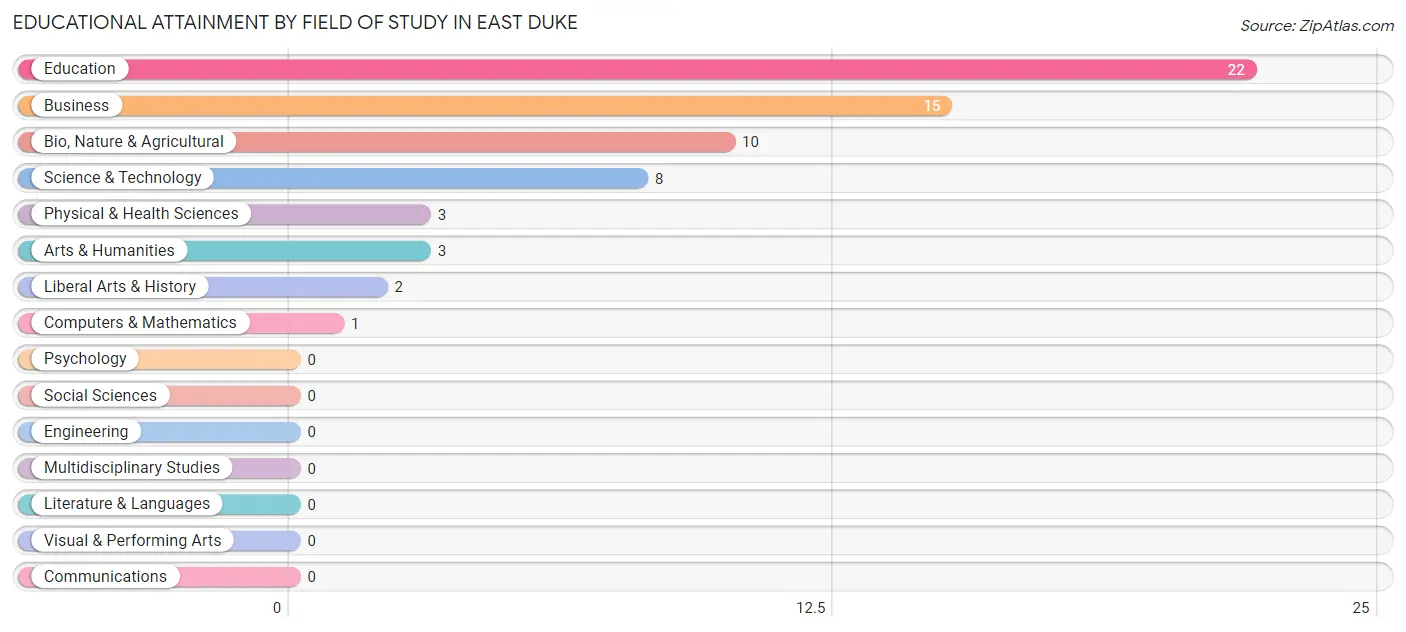
Education (22 | 34.4%), business (15 | 23.4%), bio, nature & agricultural (10 | 15.6%), science & technology (8 | 12.5%), and physical & health sciences (3 | 4.7%) are the most common fields of study among 64 individuals in East Duke who have obtained a bachelor's degree or higher.
| Field of Study | # Graduates | % Graduates |
| Computers & Mathematics | 1 | 1.6% |
| Bio, Nature & Agricultural | 10 | 15.6% |
| Physical & Health Sciences | 3 | 4.7% |
| Psychology | 0 | 0.0% |
| Social Sciences | 0 | 0.0% |
| Engineering | 0 | 0.0% |
| Multidisciplinary Studies | 0 | 0.0% |
| Science & Technology | 8 | 12.5% |
| Business | 15 | 23.4% |
| Education | 22 | 34.4% |
| Literature & Languages | 0 | 0.0% |
| Liberal Arts & History | 2 | 3.1% |
| Visual & Performing Arts | 0 | 0.0% |
| Communications | 0 | 0.0% |
| Arts & Humanities | 3 | 4.7% |
| Total | 64 | 100.0% |
Transportation & Commute in East Duke
Vehicle Availability by Sex in East Duke
The most prevalent vehicle ownership categories in East Duke are males with 3 vehicles (58, accounting for 51.8%) and females with 3 vehicles (30, making up 101.8%).
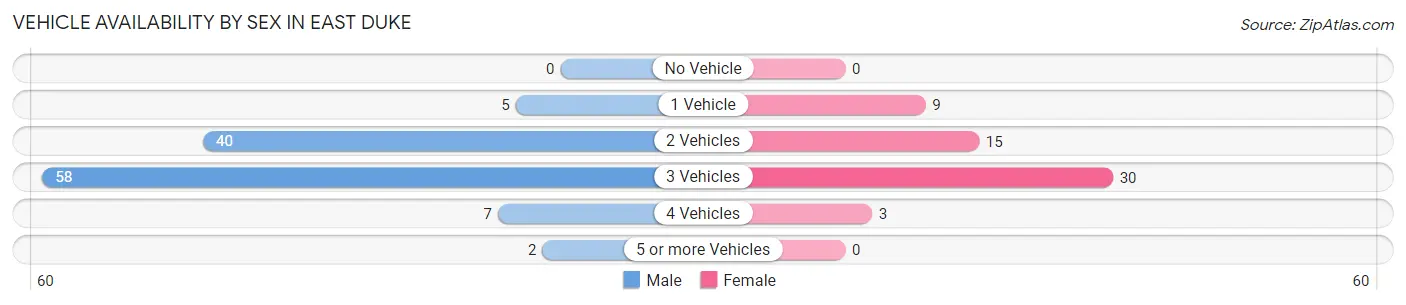
| Vehicles Available | Male | Female |
| No Vehicle | 0 (0.0%) | 0 (0.0%) |
| 1 Vehicle | 5 (4.5%) | 9 (15.8%) |
| 2 Vehicles | 40 (35.7%) | 15 (26.3%) |
| 3 Vehicles | 58 (51.8%) | 30 (52.6%) |
| 4 Vehicles | 7 (6.2%) | 3 (5.3%) |
| 5 or more Vehicles | 2 (1.8%) | 0 (0.0%) |
| Total | 112 (100.0%) | 57 (100.0%) |
Commute Time in East Duke
The most frequently occuring commute durations in East Duke are 20 to 24 minutes (45 commuters, 29.4%), 15 to 19 minutes (28 commuters, 18.3%), and less than 5 minutes (24 commuters, 15.7%).
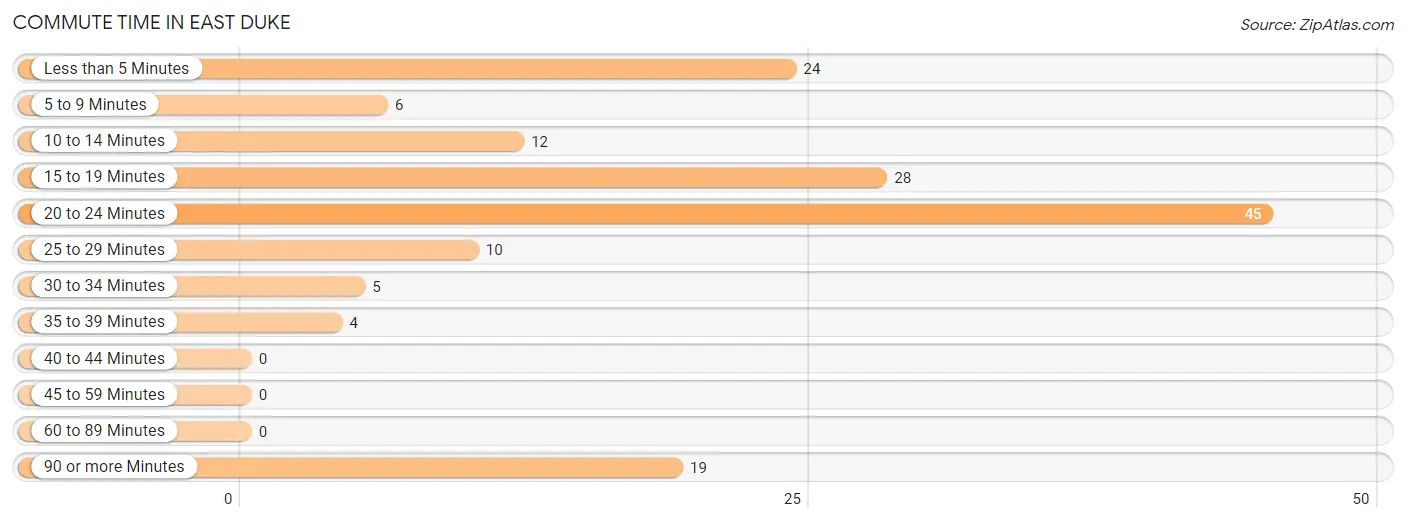
| Commute Time | # Commuters | % Commuters |
| Less than 5 Minutes | 24 | 15.7% |
| 5 to 9 Minutes | 6 | 3.9% |
| 10 to 14 Minutes | 12 | 7.8% |
| 15 to 19 Minutes | 28 | 18.3% |
| 20 to 24 Minutes | 45 | 29.4% |
| 25 to 29 Minutes | 10 | 6.5% |
| 30 to 34 Minutes | 5 | 3.3% |
| 35 to 39 Minutes | 4 | 2.6% |
| 40 to 44 Minutes | 0 | 0.0% |
| 45 to 59 Minutes | 0 | 0.0% |
| 60 to 89 Minutes | 0 | 0.0% |
| 90 or more Minutes | 19 | 12.4% |
Commute Time by Sex in East Duke
The most common commute times in East Duke are 20 to 24 minutes (26 commuters, 26.3%) for males and 20 to 24 minutes (19 commuters, 35.2%) for females.
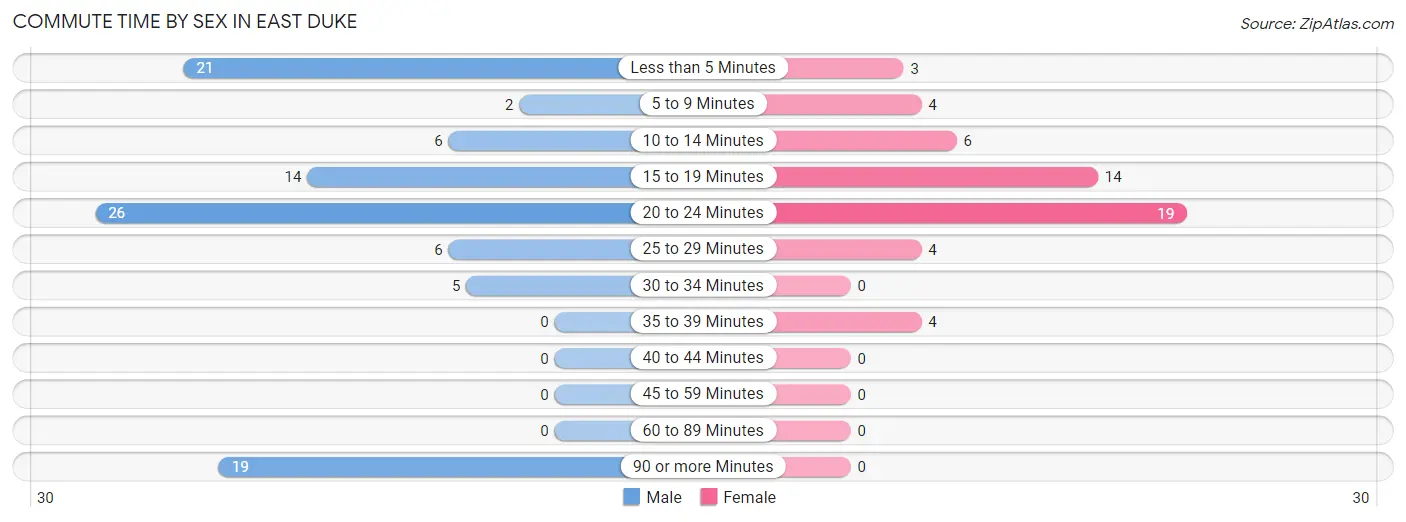
| Commute Time | Male | Female |
| Less than 5 Minutes | 21 (21.2%) | 3 (5.6%) |
| 5 to 9 Minutes | 2 (2.0%) | 4 (7.4%) |
| 10 to 14 Minutes | 6 (6.1%) | 6 (11.1%) |
| 15 to 19 Minutes | 14 (14.1%) | 14 (25.9%) |
| 20 to 24 Minutes | 26 (26.3%) | 19 (35.2%) |
| 25 to 29 Minutes | 6 (6.1%) | 4 (7.4%) |
| 30 to 34 Minutes | 5 (5.1%) | 0 (0.0%) |
| 35 to 39 Minutes | 0 (0.0%) | 4 (7.4%) |
| 40 to 44 Minutes | 0 (0.0%) | 0 (0.0%) |
| 45 to 59 Minutes | 0 (0.0%) | 0 (0.0%) |
| 60 to 89 Minutes | 0 (0.0%) | 0 (0.0%) |
| 90 or more Minutes | 19 (19.2%) | 0 (0.0%) |
Time of Departure to Work by Sex in East Duke
The most frequent times of departure to work in East Duke are 7:30 AM to 7:59 AM (22, 22.2%) for males and 7:30 AM to 7:59 AM (17, 31.5%) for females.
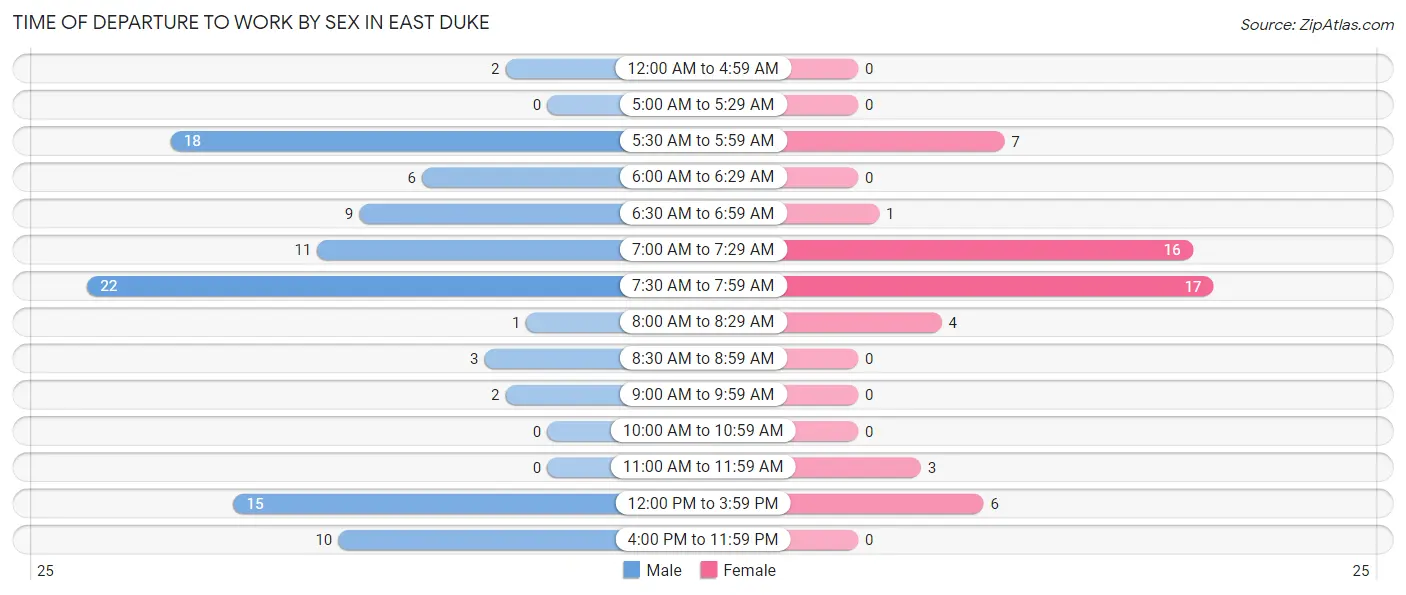
| Time of Departure | Male | Female |
| 12:00 AM to 4:59 AM | 2 (2.0%) | 0 (0.0%) |
| 5:00 AM to 5:29 AM | 0 (0.0%) | 0 (0.0%) |
| 5:30 AM to 5:59 AM | 18 (18.2%) | 7 (13.0%) |
| 6:00 AM to 6:29 AM | 6 (6.1%) | 0 (0.0%) |
| 6:30 AM to 6:59 AM | 9 (9.1%) | 1 (1.8%) |
| 7:00 AM to 7:29 AM | 11 (11.1%) | 16 (29.6%) |
| 7:30 AM to 7:59 AM | 22 (22.2%) | 17 (31.5%) |
| 8:00 AM to 8:29 AM | 1 (1.0%) | 4 (7.4%) |
| 8:30 AM to 8:59 AM | 3 (3.0%) | 0 (0.0%) |
| 9:00 AM to 9:59 AM | 2 (2.0%) | 0 (0.0%) |
| 10:00 AM to 10:59 AM | 0 (0.0%) | 0 (0.0%) |
| 11:00 AM to 11:59 AM | 0 (0.0%) | 3 (5.6%) |
| 12:00 PM to 3:59 PM | 15 (15.1%) | 6 (11.1%) |
| 4:00 PM to 11:59 PM | 10 (10.1%) | 0 (0.0%) |
| Total | 99 (100.0%) | 54 (100.0%) |
Housing Occupancy in East Duke
Occupancy by Ownership in East Duke
Of the total 126 dwellings in East Duke, owner-occupied units account for 91 (72.2%), while renter-occupied units make up 35 (27.8%).
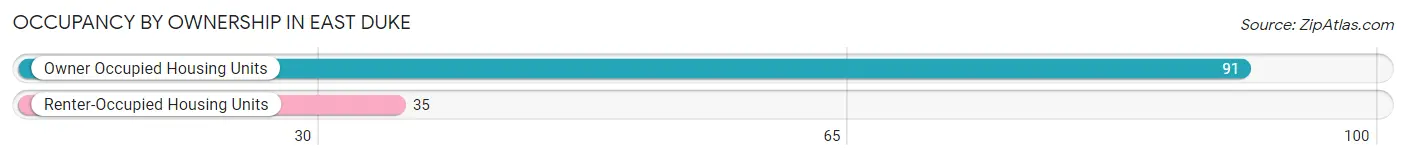
| Occupancy | # Housing Units | % Housing Units |
| Owner Occupied Housing Units | 91 | 72.2% |
| Renter-Occupied Housing Units | 35 | 27.8% |
| Total Occupied Housing Units | 126 | 100.0% |
Occupancy by Household Size in East Duke
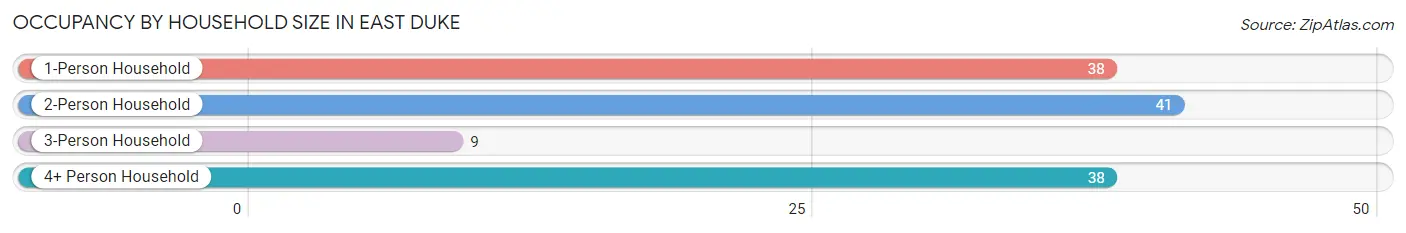
| Household Size | # Housing Units | % Housing Units |
| 1-Person Household | 38 | 30.2% |
| 2-Person Household | 41 | 32.5% |
| 3-Person Household | 9 | 7.1% |
| 4+ Person Household | 38 | 30.2% |
| Total Housing Units | 126 | 100.0% |
Occupancy by Ownership by Household Size in East Duke
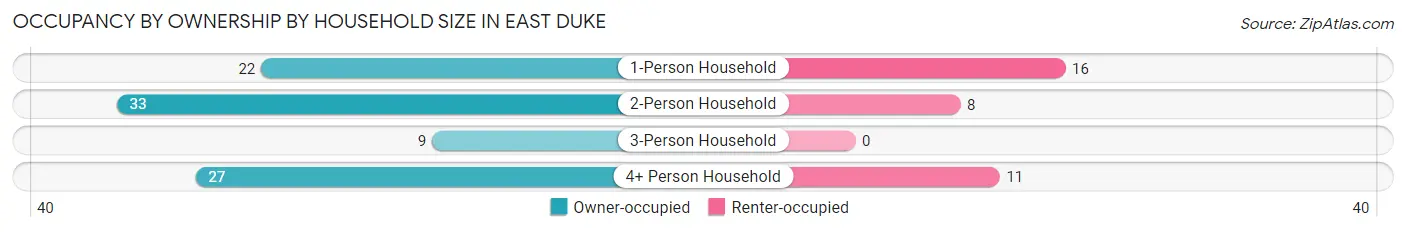
| Household Size | Owner-occupied | Renter-occupied |
| 1-Person Household | 22 (57.9%) | 16 (42.1%) |
| 2-Person Household | 33 (80.5%) | 8 (19.5%) |
| 3-Person Household | 9 (100.0%) | 0 (0.0%) |
| 4+ Person Household | 27 (71.1%) | 11 (28.9%) |
| Total Housing Units | 91 (72.2%) | 35 (27.8%) |
Occupancy by Educational Attainment in East Duke
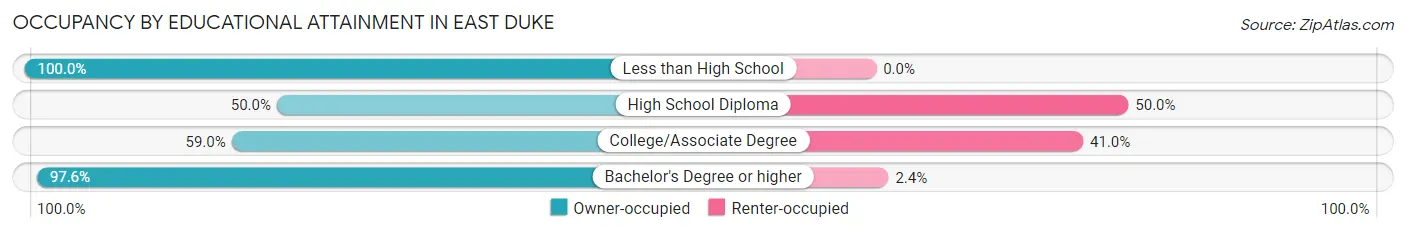
| Household Size | Owner-occupied | Renter-occupied |
| Less than High School | 10 (100.0%) | 0 (0.0%) |
| High School Diploma | 18 (50.0%) | 18 (50.0%) |
| College/Associate Degree | 23 (59.0%) | 16 (41.0%) |
| Bachelor's Degree or higher | 40 (97.6%) | 1 (2.4%) |
Occupancy by Age of Householder in East Duke
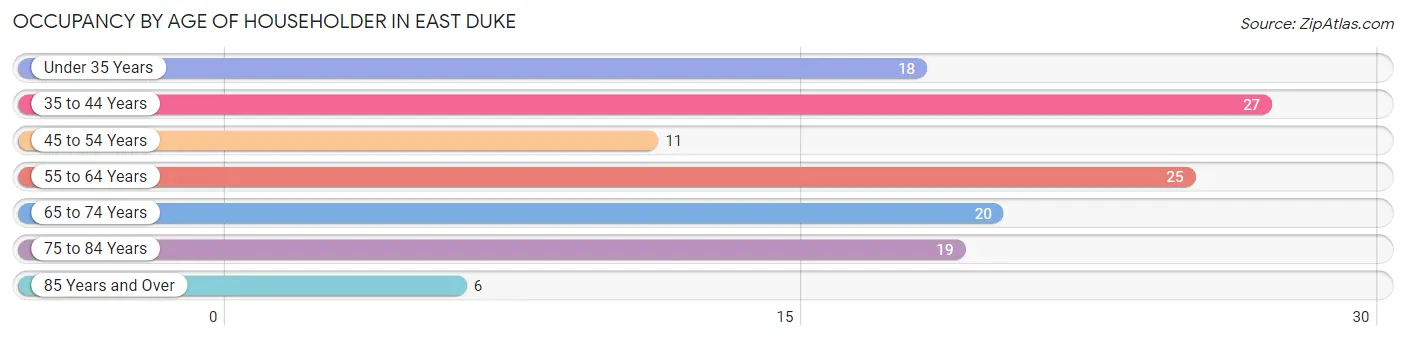
| Age Bracket | # Households | % Households |
| Under 35 Years | 18 | 14.3% |
| 35 to 44 Years | 27 | 21.4% |
| 45 to 54 Years | 11 | 8.7% |
| 55 to 64 Years | 25 | 19.8% |
| 65 to 74 Years | 20 | 15.9% |
| 75 to 84 Years | 19 | 15.1% |
| 85 Years and Over | 6 | 4.8% |
| Total | 126 | 100.0% |
Housing Finances in East Duke
Median Income by Occupancy in East Duke
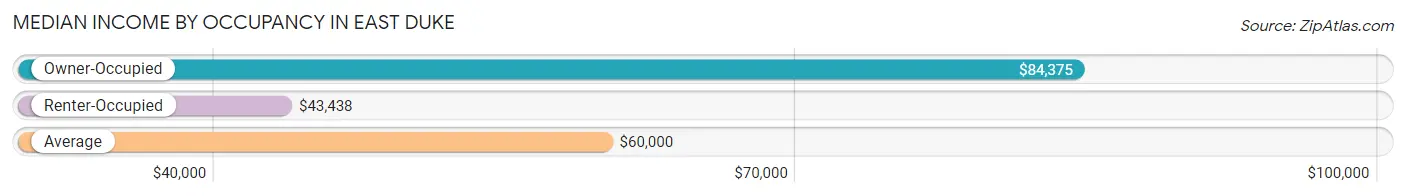
| Occupancy Type | # Households | Median Income |
| Owner-Occupied | 91 (72.2%) | $84,375 |
| Renter-Occupied | 35 (27.8%) | $43,438 |
| Average | 126 (100.0%) | $60,000 |
Occupancy by Householder Income Bracket in East Duke
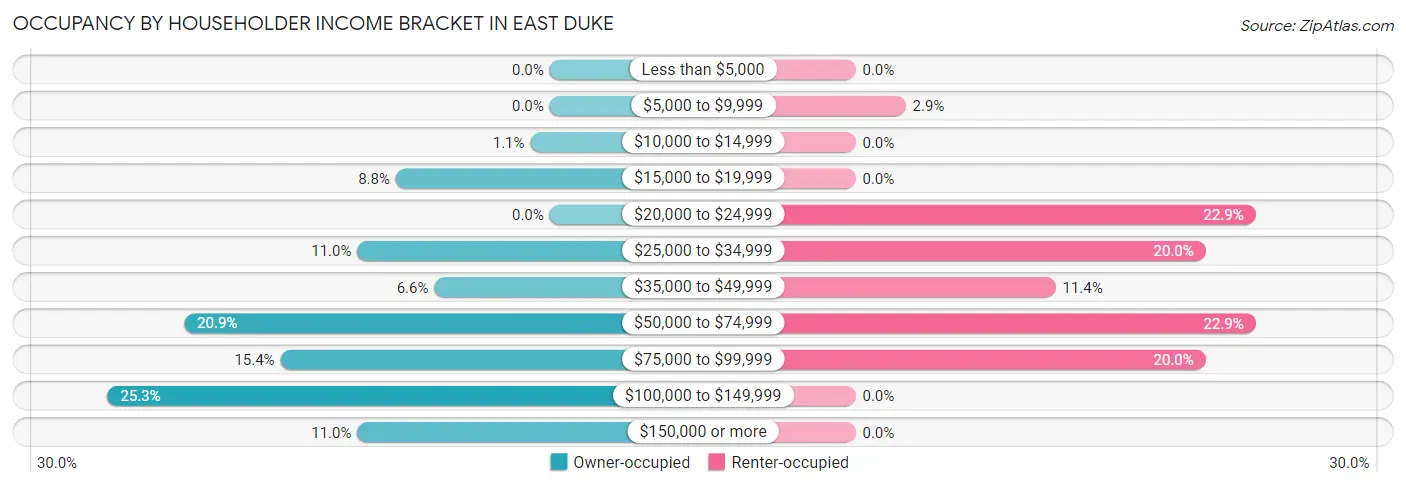
| Income Bracket | Owner-occupied | Renter-occupied |
| Less than $5,000 | 0 (0.0%) | 0 (0.0%) |
| $5,000 to $9,999 | 0 (0.0%) | 1 (2.9%) |
| $10,000 to $14,999 | 1 (1.1%) | 0 (0.0%) |
| $15,000 to $19,999 | 8 (8.8%) | 0 (0.0%) |
| $20,000 to $24,999 | 0 (0.0%) | 8 (22.9%) |
| $25,000 to $34,999 | 10 (11.0%) | 7 (20.0%) |
| $35,000 to $49,999 | 6 (6.6%) | 4 (11.4%) |
| $50,000 to $74,999 | 19 (20.9%) | 8 (22.9%) |
| $75,000 to $99,999 | 14 (15.4%) | 7 (20.0%) |
| $100,000 to $149,999 | 23 (25.3%) | 0 (0.0%) |
| $150,000 or more | 10 (11.0%) | 0 (0.0%) |
| Total | 91 (100.0%) | 35 (100.0%) |
Monthly Housing Cost Tiers in East Duke
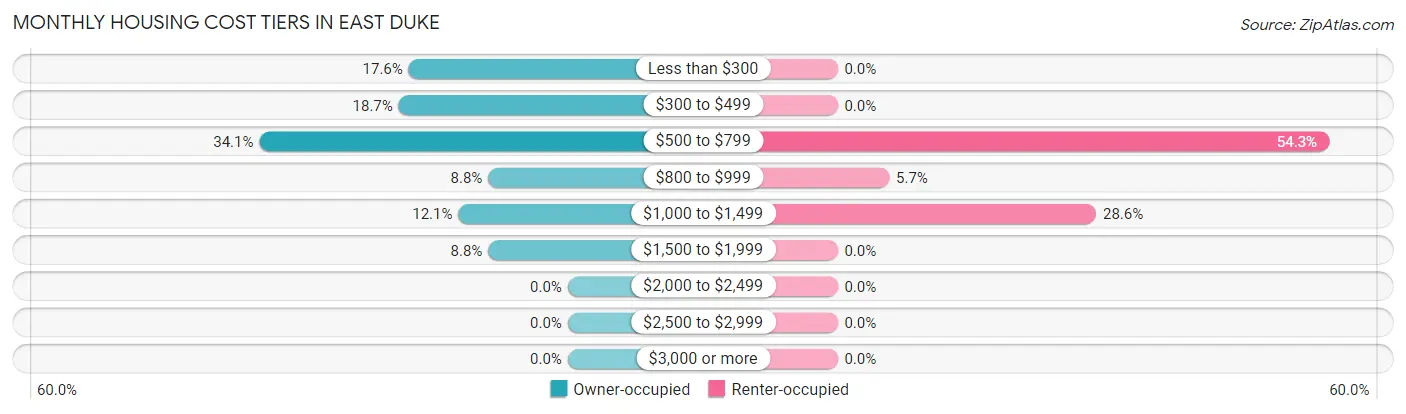
| Monthly Cost | Owner-occupied | Renter-occupied |
| Less than $300 | 16 (17.6%) | 0 (0.0%) |
| $300 to $499 | 17 (18.7%) | 0 (0.0%) |
| $500 to $799 | 31 (34.1%) | 19 (54.3%) |
| $800 to $999 | 8 (8.8%) | 2 (5.7%) |
| $1,000 to $1,499 | 11 (12.1%) | 10 (28.6%) |
| $1,500 to $1,999 | 8 (8.8%) | 0 (0.0%) |
| $2,000 to $2,499 | 0 (0.0%) | 0 (0.0%) |
| $2,500 to $2,999 | 0 (0.0%) | 0 (0.0%) |
| $3,000 or more | 0 (0.0%) | 0 (0.0%) |
| Total | 91 (100.0%) | 35 (100.0%) |
Physical Housing Characteristics in East Duke
Housing Structures in East Duke
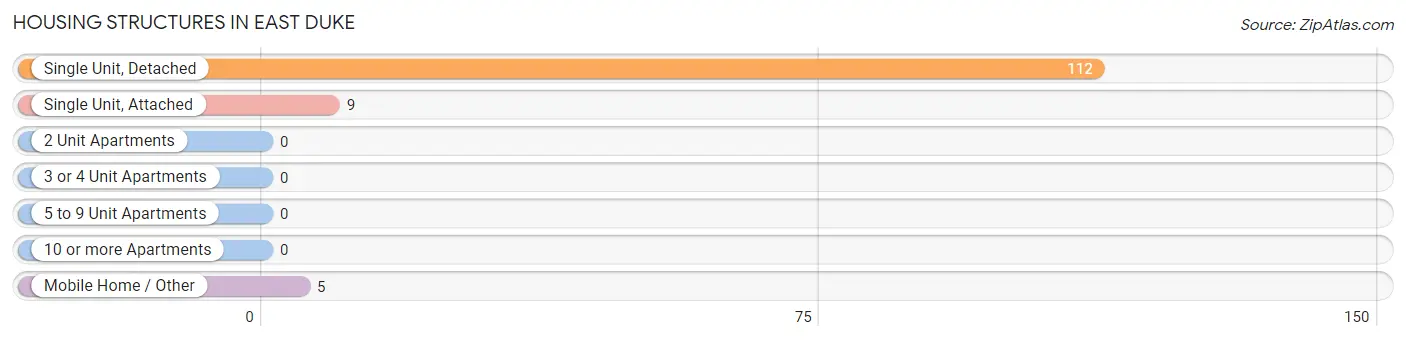
| Structure Type | # Housing Units | % Housing Units |
| Single Unit, Detached | 112 | 88.9% |
| Single Unit, Attached | 9 | 7.1% |
| 2 Unit Apartments | 0 | 0.0% |
| 3 or 4 Unit Apartments | 0 | 0.0% |
| 5 to 9 Unit Apartments | 0 | 0.0% |
| 10 or more Apartments | 0 | 0.0% |
| Mobile Home / Other | 5 | 4.0% |
| Total | 126 | 100.0% |
Housing Structures by Occupancy in East Duke
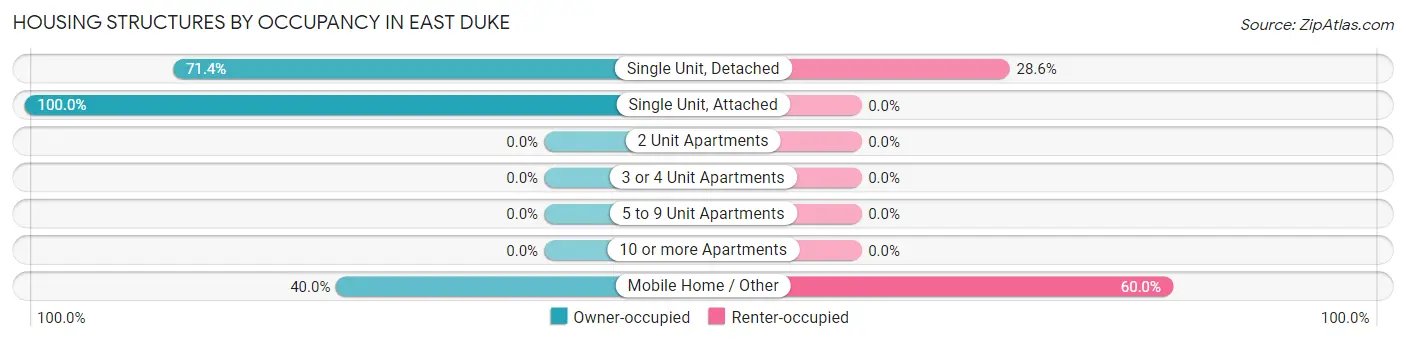
| Structure Type | Owner-occupied | Renter-occupied |
| Single Unit, Detached | 80 (71.4%) | 32 (28.6%) |
| Single Unit, Attached | 9 (100.0%) | 0 (0.0%) |
| 2 Unit Apartments | 0 (0.0%) | 0 (0.0%) |
| 3 or 4 Unit Apartments | 0 (0.0%) | 0 (0.0%) |
| 5 to 9 Unit Apartments | 0 (0.0%) | 0 (0.0%) |
| 10 or more Apartments | 0 (0.0%) | 0 (0.0%) |
| Mobile Home / Other | 2 (40.0%) | 3 (60.0%) |
| Total | 91 (72.2%) | 35 (27.8%) |
Housing Structures by Number of Rooms in East Duke
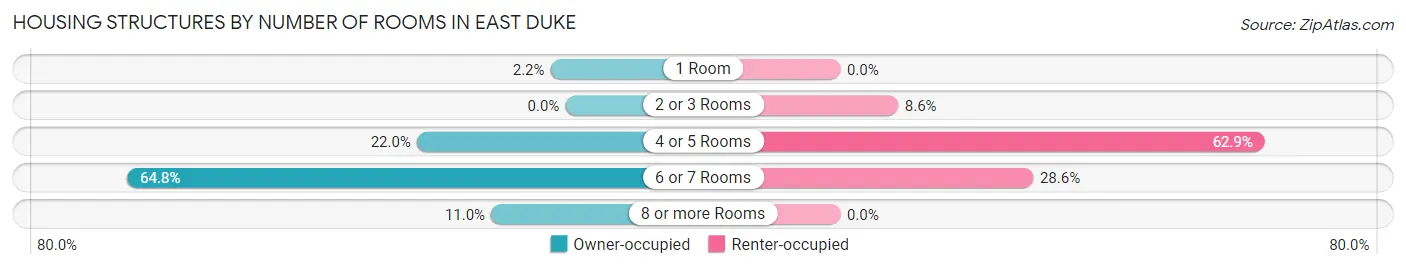
| Number of Rooms | Owner-occupied | Renter-occupied |
| 1 Room | 2 (2.2%) | 0 (0.0%) |
| 2 or 3 Rooms | 0 (0.0%) | 3 (8.6%) |
| 4 or 5 Rooms | 20 (22.0%) | 22 (62.9%) |
| 6 or 7 Rooms | 59 (64.8%) | 10 (28.6%) |
| 8 or more Rooms | 10 (11.0%) | 0 (0.0%) |
| Total | 91 (100.0%) | 35 (100.0%) |
Housing Structure by Heating Type in East Duke
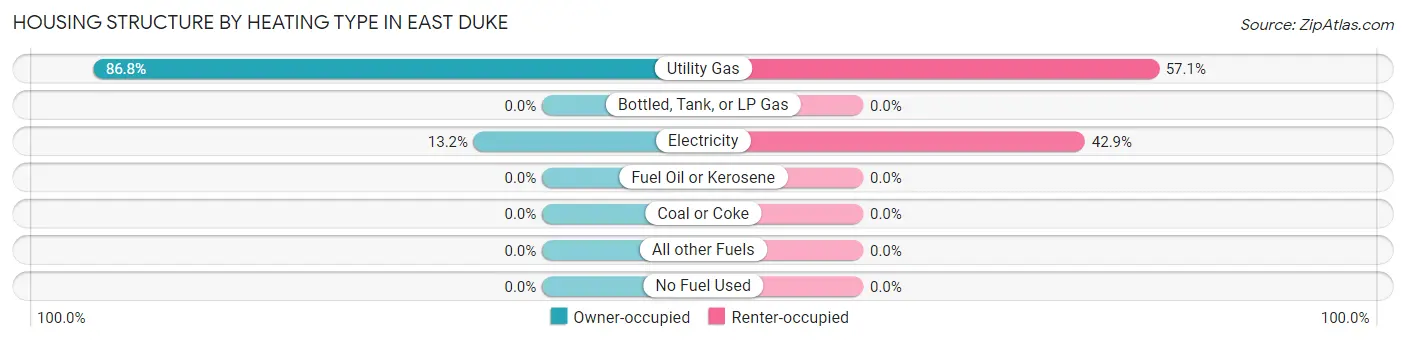
| Heating Type | Owner-occupied | Renter-occupied |
| Utility Gas | 79 (86.8%) | 20 (57.1%) |
| Bottled, Tank, or LP Gas | 0 (0.0%) | 0 (0.0%) |
| Electricity | 12 (13.2%) | 15 (42.9%) |
| Fuel Oil or Kerosene | 0 (0.0%) | 0 (0.0%) |
| Coal or Coke | 0 (0.0%) | 0 (0.0%) |
| All other Fuels | 0 (0.0%) | 0 (0.0%) |
| No Fuel Used | 0 (0.0%) | 0 (0.0%) |
| Total | 91 (100.0%) | 35 (100.0%) |
Household Vehicle Usage in East Duke
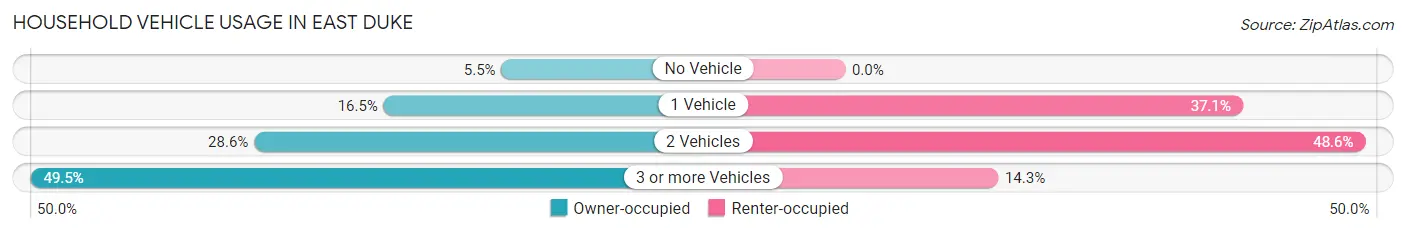
| Vehicles per Household | Owner-occupied | Renter-occupied |
| No Vehicle | 5 (5.5%) | 0 (0.0%) |
| 1 Vehicle | 15 (16.5%) | 13 (37.1%) |
| 2 Vehicles | 26 (28.6%) | 17 (48.6%) |
| 3 or more Vehicles | 45 (49.4%) | 5 (14.3%) |
| Total | 91 (100.0%) | 35 (100.0%) |
Real Estate & Mortgages in East Duke
Real Estate and Mortgage Overview in East Duke
| Characteristic | Without Mortgage | With Mortgage |
| Housing Units | 59 | 32 |
| Median Property Value | $93,600 | $145,000 |
| Median Household Income | $56,875 | $4 |
| Monthly Housing Costs | $465 | $0 |
| Real Estate Taxes | $525 | $0 |
Property Value by Mortgage Status in East Duke
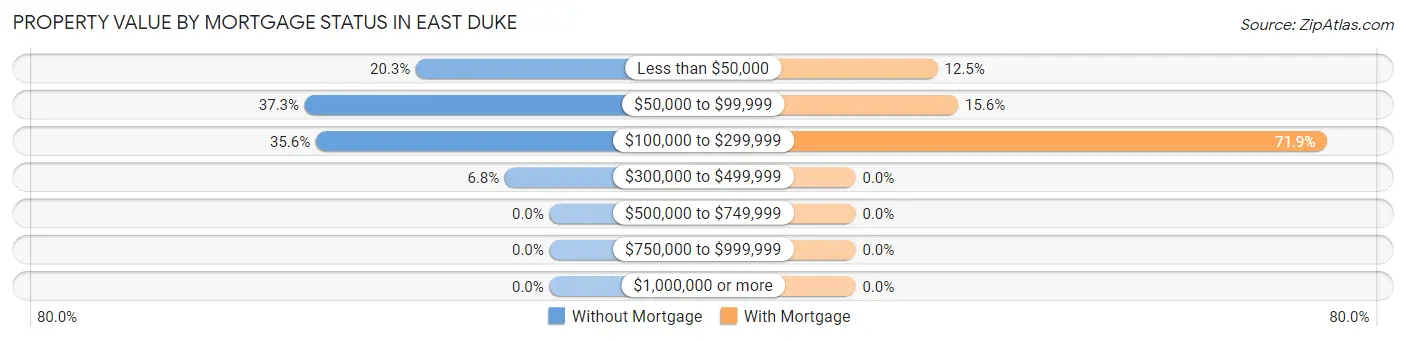
| Property Value | Without Mortgage | With Mortgage |
| Less than $50,000 | 12 (20.3%) | 4 (12.5%) |
| $50,000 to $99,999 | 22 (37.3%) | 5 (15.6%) |
| $100,000 to $299,999 | 21 (35.6%) | 23 (71.9%) |
| $300,000 to $499,999 | 4 (6.8%) | 0 (0.0%) |
| $500,000 to $749,999 | 0 (0.0%) | 0 (0.0%) |
| $750,000 to $999,999 | 0 (0.0%) | 0 (0.0%) |
| $1,000,000 or more | 0 (0.0%) | 0 (0.0%) |
| Total | 59 (100.0%) | 32 (100.0%) |
Household Income by Mortgage Status in East Duke
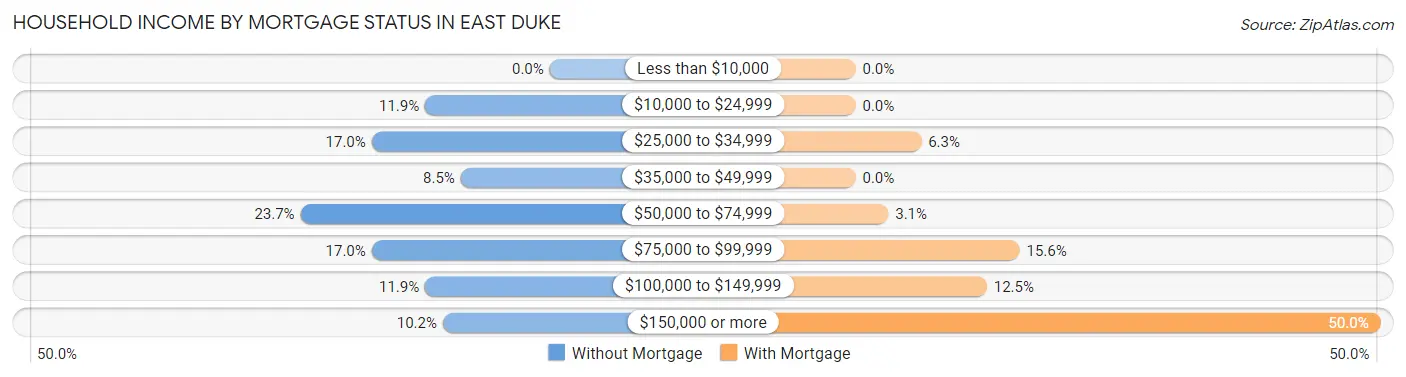
| Household Income | Without Mortgage | With Mortgage |
| Less than $10,000 | 0 (0.0%) | 0 (0.0%) |
| $10,000 to $24,999 | 7 (11.9%) | 0 (0.0%) |
| $25,000 to $34,999 | 10 (17.0%) | 2 (6.2%) |
| $35,000 to $49,999 | 5 (8.5%) | 0 (0.0%) |
| $50,000 to $74,999 | 14 (23.7%) | 1 (3.1%) |
| $75,000 to $99,999 | 10 (17.0%) | 5 (15.6%) |
| $100,000 to $149,999 | 7 (11.9%) | 4 (12.5%) |
| $150,000 or more | 6 (10.2%) | 16 (50.0%) |
| Total | 59 (100.0%) | 32 (100.0%) |
Property Value to Household Income Ratio in East Duke
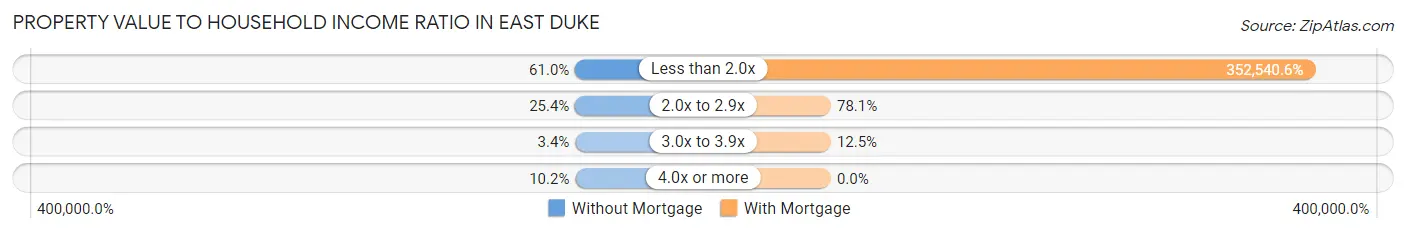
| Value-to-Income Ratio | Without Mortgage | With Mortgage |
| Less than 2.0x | 36 (61.0%) | 112,813 (352,540.6%) |
| 2.0x to 2.9x | 15 (25.4%) | 25 (78.1%) |
| 3.0x to 3.9x | 2 (3.4%) | 4 (12.5%) |
| 4.0x or more | 6 (10.2%) | 0 (0.0%) |
| Total | 59 (100.0%) | 32 (100.0%) |
Real Estate Taxes by Mortgage Status in East Duke
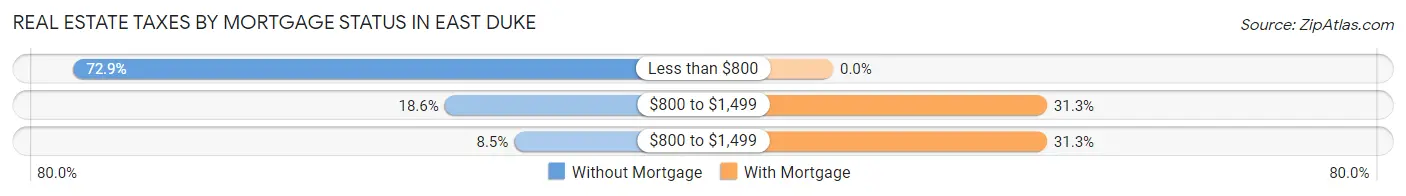
| Property Taxes | Without Mortgage | With Mortgage |
| Less than $800 | 43 (72.9%) | 0 (0.0%) |
| $800 to $1,499 | 11 (18.6%) | 10 (31.2%) |
| $800 to $1,499 | 5 (8.5%) | 10 (31.2%) |
| Total | 59 (100.0%) | 32 (100.0%) |
Health & Disability in East Duke
Health Insurance Coverage by Age in East Duke
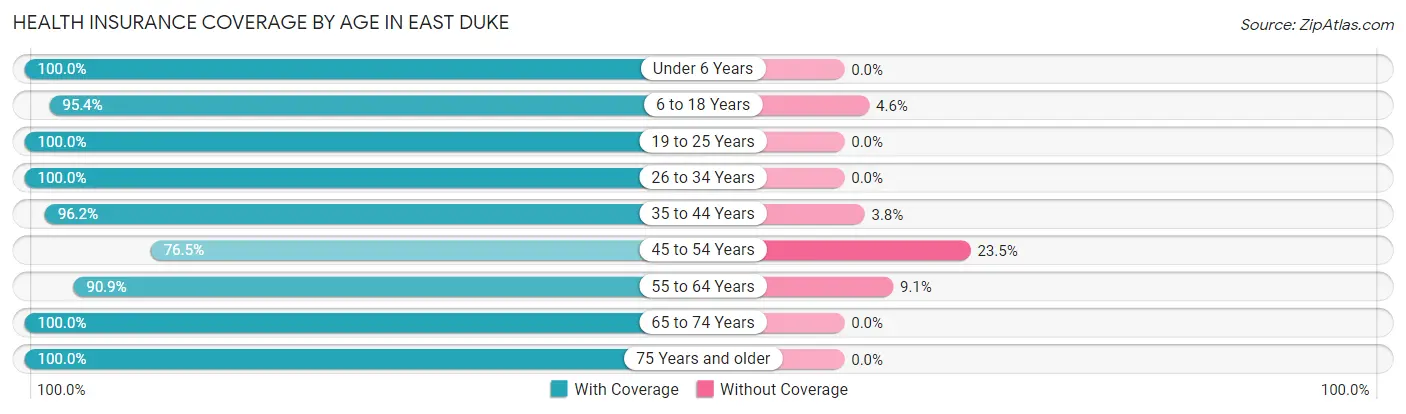
| Age Bracket | With Coverage | Without Coverage |
| Under 6 Years | 44 (100.0%) | 0 (0.0%) |
| 6 to 18 Years | 62 (95.4%) | 3 (4.6%) |
| 19 to 25 Years | 22 (100.0%) | 0 (0.0%) |
| 26 to 34 Years | 26 (100.0%) | 0 (0.0%) |
| 35 to 44 Years | 51 (96.2%) | 2 (3.8%) |
| 45 to 54 Years | 13 (76.5%) | 4 (23.5%) |
| 55 to 64 Years | 40 (90.9%) | 4 (9.1%) |
| 65 to 74 Years | 34 (100.0%) | 0 (0.0%) |
| 75 Years and older | 37 (100.0%) | 0 (0.0%) |
| Total | 329 (96.2%) | 13 (3.8%) |
Health Insurance Coverage by Citizenship Status in East Duke
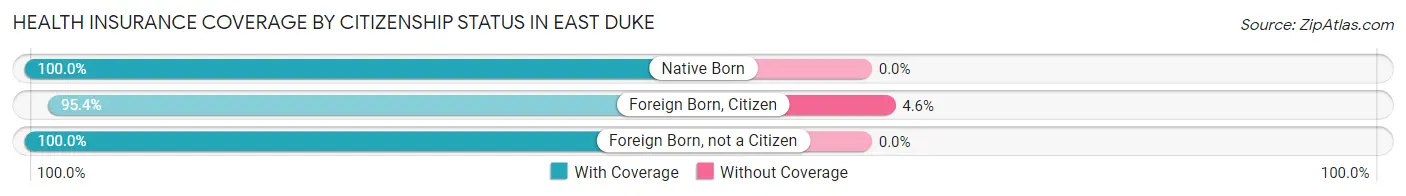
| Citizenship Status | With Coverage | Without Coverage |
| Native Born | 44 (100.0%) | 0 (0.0%) |
| Foreign Born, Citizen | 62 (95.4%) | 3 (4.6%) |
| Foreign Born, not a Citizen | 22 (100.0%) | 0 (0.0%) |
Health Insurance Coverage by Household Income in East Duke
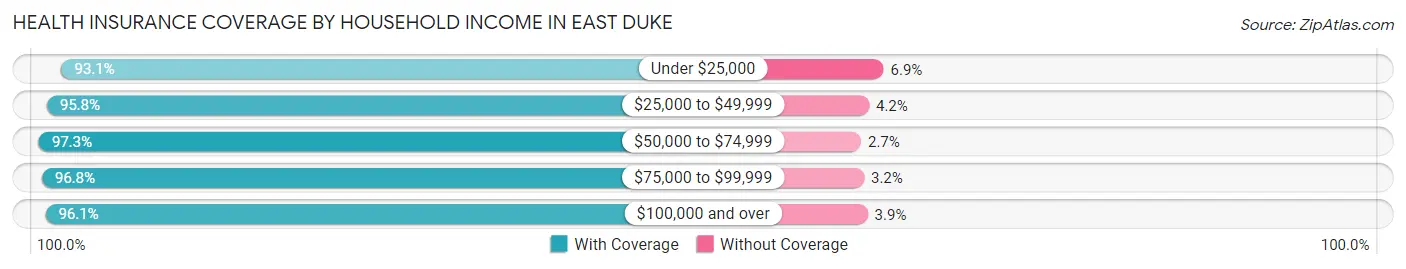
| Household Income | With Coverage | Without Coverage |
| Under $25,000 | 27 (93.1%) | 2 (6.9%) |
| $25,000 to $49,999 | 46 (95.8%) | 2 (4.2%) |
| $50,000 to $74,999 | 73 (97.3%) | 2 (2.7%) |
| $75,000 to $99,999 | 60 (96.8%) | 2 (3.2%) |
| $100,000 and over | 123 (96.1%) | 5 (3.9%) |
Public vs Private Health Insurance Coverage by Age in East Duke
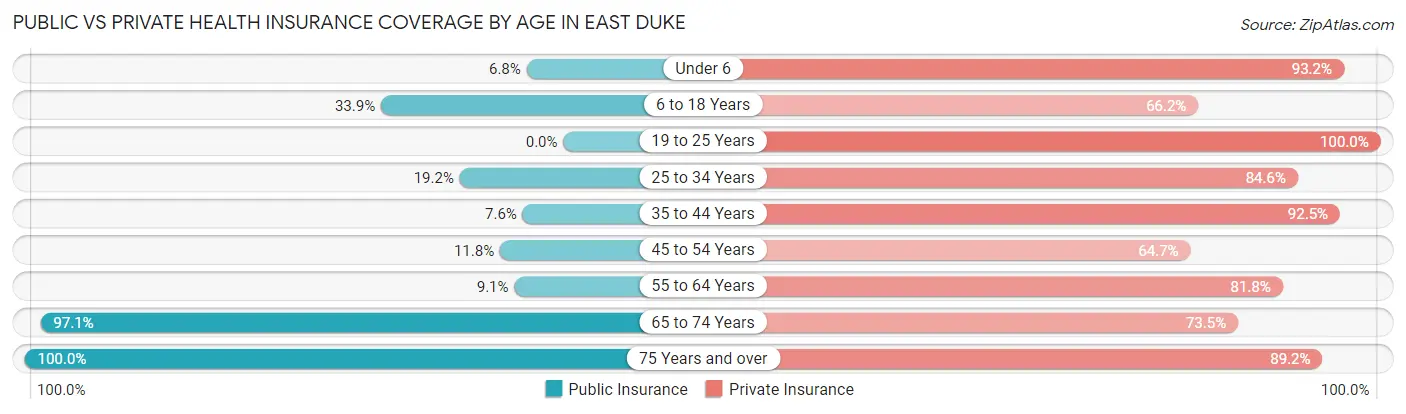
| Age Bracket | Public Insurance | Private Insurance |
| Under 6 | 3 (6.8%) | 41 (93.2%) |
| 6 to 18 Years | 22 (33.9%) | 43 (66.1%) |
| 19 to 25 Years | 0 (0.0%) | 22 (100.0%) |
| 25 to 34 Years | 5 (19.2%) | 22 (84.6%) |
| 35 to 44 Years | 4 (7.5%) | 49 (92.4%) |
| 45 to 54 Years | 2 (11.8%) | 11 (64.7%) |
| 55 to 64 Years | 4 (9.1%) | 36 (81.8%) |
| 65 to 74 Years | 33 (97.1%) | 25 (73.5%) |
| 75 Years and over | 37 (100.0%) | 33 (89.2%) |
| Total | 110 (32.2%) | 282 (82.5%) |
Disability Status by Sex by Age in East Duke
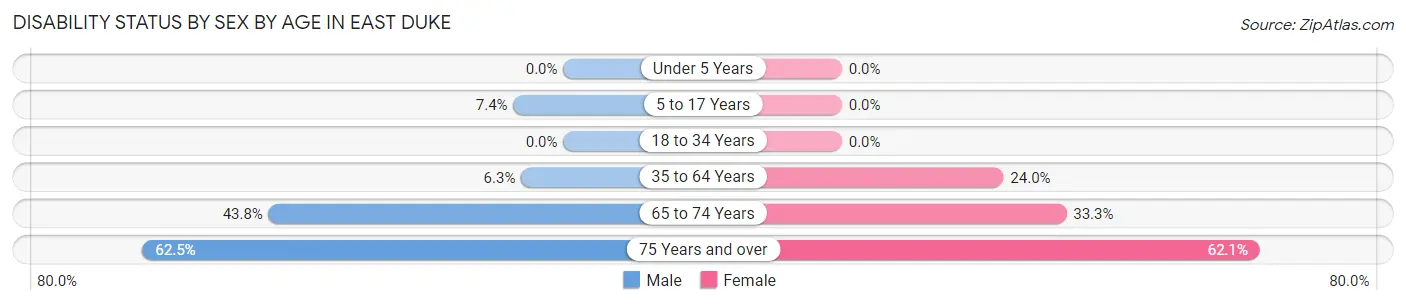
| Age Bracket | Male | Female |
| Under 5 Years | 0 (0.0%) | 0 (0.0%) |
| 5 to 17 Years | 2 (7.4%) | 0 (0.0%) |
| 18 to 34 Years | 0 (0.0%) | 0 (0.0%) |
| 35 to 64 Years | 4 (6.2%) | 12 (24.0%) |
| 65 to 74 Years | 7 (43.8%) | 6 (33.3%) |
| 75 Years and over | 5 (62.5%) | 18 (62.1%) |
Disability Class by Sex by Age in East Duke
Disability Class: Hearing Difficulty
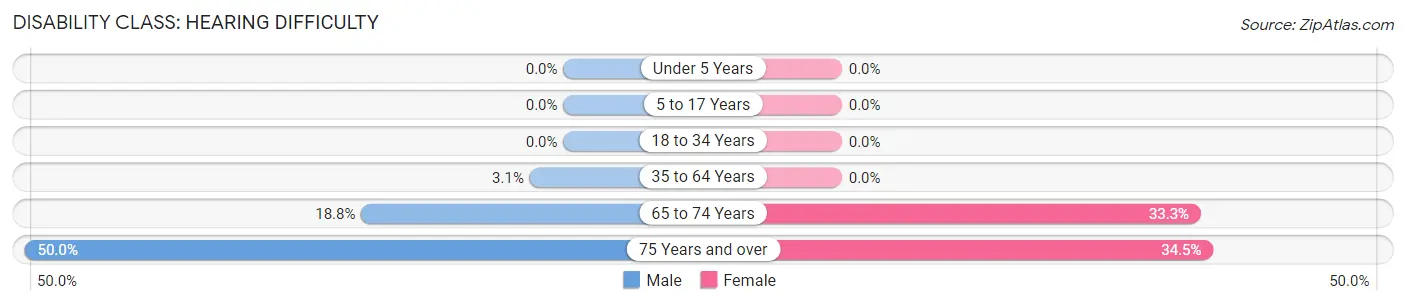
| Age Bracket | Male | Female |
| Under 5 Years | 0 (0.0%) | 0 (0.0%) |
| 5 to 17 Years | 0 (0.0%) | 0 (0.0%) |
| 18 to 34 Years | 0 (0.0%) | 0 (0.0%) |
| 35 to 64 Years | 2 (3.1%) | 0 (0.0%) |
| 65 to 74 Years | 3 (18.8%) | 6 (33.3%) |
| 75 Years and over | 4 (50.0%) | 10 (34.5%) |
Disability Class: Vision Difficulty
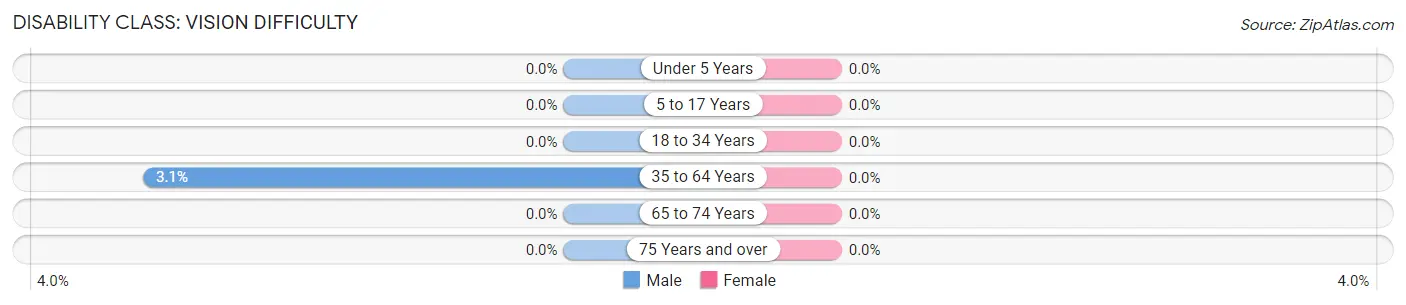
| Age Bracket | Male | Female |
| Under 5 Years | 0 (0.0%) | 0 (0.0%) |
| 5 to 17 Years | 0 (0.0%) | 0 (0.0%) |
| 18 to 34 Years | 0 (0.0%) | 0 (0.0%) |
| 35 to 64 Years | 2 (3.1%) | 0 (0.0%) |
| 65 to 74 Years | 0 (0.0%) | 0 (0.0%) |
| 75 Years and over | 0 (0.0%) | 0 (0.0%) |
Disability Class: Cognitive Difficulty
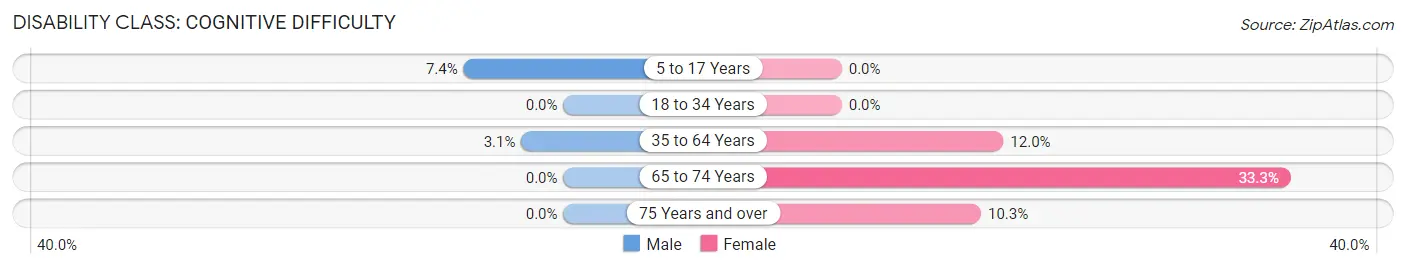
| Age Bracket | Male | Female |
| 5 to 17 Years | 2 (7.4%) | 0 (0.0%) |
| 18 to 34 Years | 0 (0.0%) | 0 (0.0%) |
| 35 to 64 Years | 2 (3.1%) | 6 (12.0%) |
| 65 to 74 Years | 0 (0.0%) | 6 (33.3%) |
| 75 Years and over | 0 (0.0%) | 3 (10.3%) |
Disability Class: Ambulatory Difficulty
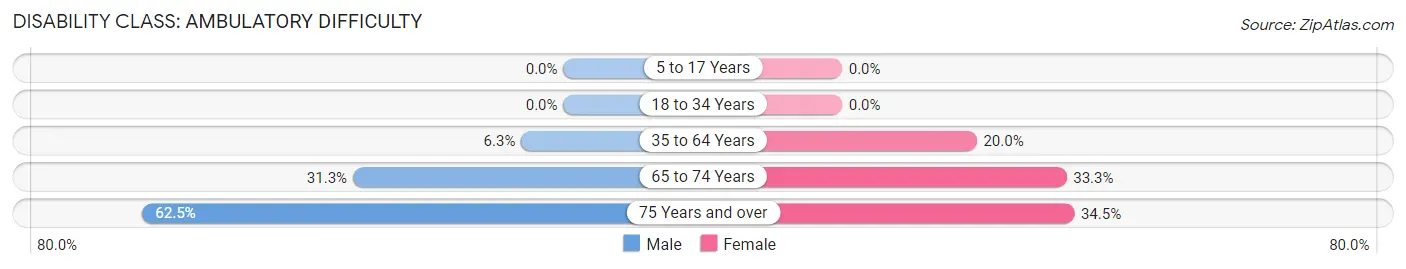
| Age Bracket | Male | Female |
| 5 to 17 Years | 0 (0.0%) | 0 (0.0%) |
| 18 to 34 Years | 0 (0.0%) | 0 (0.0%) |
| 35 to 64 Years | 4 (6.2%) | 10 (20.0%) |
| 65 to 74 Years | 5 (31.2%) | 6 (33.3%) |
| 75 Years and over | 5 (62.5%) | 10 (34.5%) |
Disability Class: Self-Care Difficulty
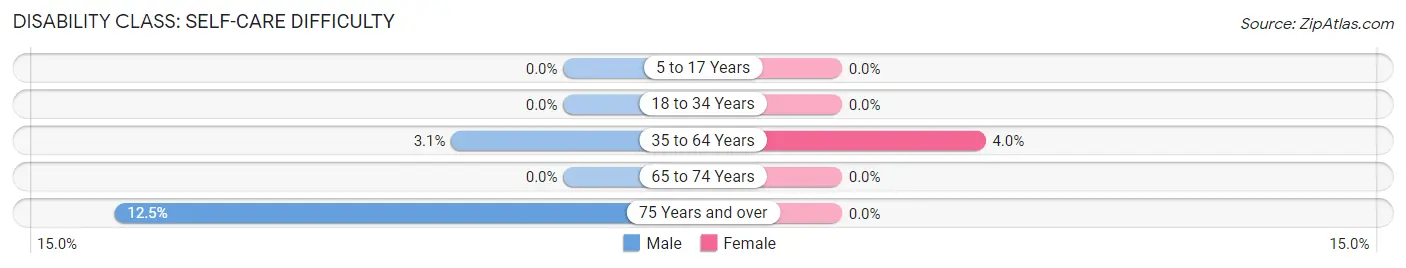
| Age Bracket | Male | Female |
| 5 to 17 Years | 0 (0.0%) | 0 (0.0%) |
| 18 to 34 Years | 0 (0.0%) | 0 (0.0%) |
| 35 to 64 Years | 2 (3.1%) | 2 (4.0%) |
| 65 to 74 Years | 0 (0.0%) | 0 (0.0%) |
| 75 Years and over | 1 (12.5%) | 0 (0.0%) |
Technology Access in East Duke
Computing Device Access in East Duke
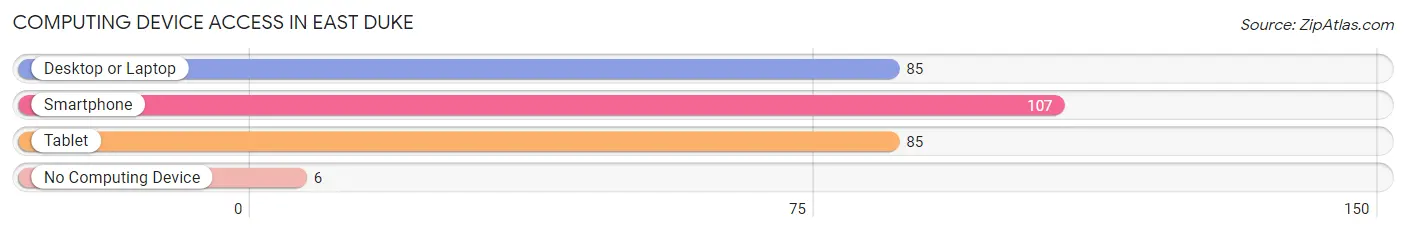
| Device Type | # Households | % Households |
| Desktop or Laptop | 85 | 67.5% |
| Smartphone | 107 | 84.9% |
| Tablet | 85 | 67.5% |
| No Computing Device | 6 | 4.8% |
| Total | 126 | 100.0% |
Internet Access in East Duke
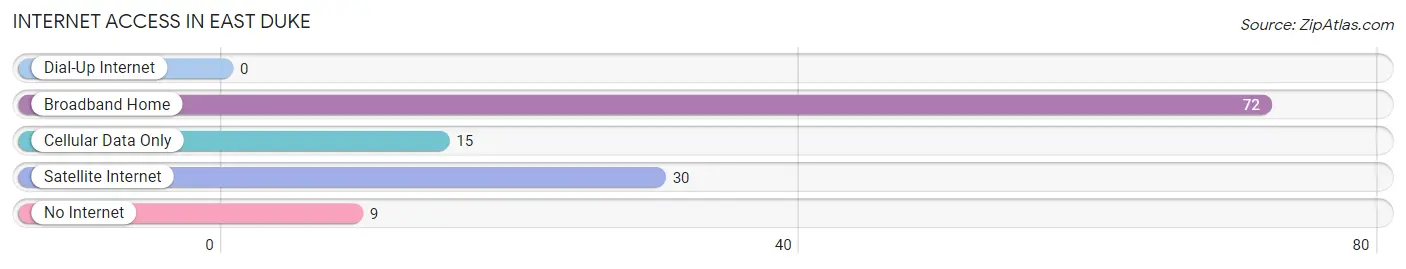
| Internet Type | # Households | % Households |
| Dial-Up Internet | 0 | 0.0% |
| Broadband Home | 72 | 57.1% |
| Cellular Data Only | 15 | 11.9% |
| Satellite Internet | 30 | 23.8% |
| No Internet | 9 | 7.1% |
| Total | 126 | 100.0% |
East Duke Summary
Duke, Oklahoma is a small town located in the southwestern corner of Oklahoma, in Jackson County. It is situated on the banks of the Red River, and is part of the Texoma region. Duke is a rural community with a population of just over 500 people, and is known for its small-town charm and friendly atmosphere.
History
Duke was founded in 1891 by a group of settlers from Texas. The town was named after the Duke family, who were among the first settlers. The Duke family had previously lived in Texas, and had moved to Oklahoma in search of a better life. The town was originally known as “Duke’s Crossing”, and was located on the Red River.
The town grew slowly, but steadily, and by the early 1900s, Duke had become a thriving community. The town was home to several businesses, including a general store, a blacksmith shop, a livery stable, and a hotel. The town also had a school, a post office, and a church.
In the early 1900s, Duke was a popular destination for tourists, who came to enjoy the area’s natural beauty and to fish in the Red River. The town was also known for its rodeos, which were held in the summer months.
Geography
Duke is located in the southwestern corner of Oklahoma, in Jackson County. It is situated on the banks of the Red River, and is part of the Texoma region. The town is located approximately 30 miles south of Altus, Oklahoma, and is about 90 miles north of Dallas, Texas.
The town is situated in a flat, open area, with rolling hills in the distance. The area is mostly rural, with a few small towns and villages scattered throughout. The town is surrounded by farmland, and is home to several small lakes and rivers.
Economy
Duke’s economy is largely based on agriculture. The town is home to several farms, which produce a variety of crops, including wheat, corn, soybeans, and cotton. The town is also home to several small businesses, including a general store, a hardware store, and a restaurant.
The town is also home to several oil and gas companies, which are responsible for much of the town’s economic activity. The town is also home to several manufacturing companies, which produce a variety of products, including furniture, clothing, and automotive parts.
Demographics
As of the 2010 census, Duke had a population of 517 people. The town is predominantly white, with a small Hispanic population. The median household income in Duke is $35,000, and the median home value is $90,000. The town has a low unemployment rate, and a high rate of homeownership.
Conclusion
Duke, Oklahoma is a small town located in the southwestern corner of Oklahoma, in Jackson County. It is situated on the banks of the Red River, and is part of the Texoma region. Duke is a rural community with a population of just over 500 people, and is known for its small-town charm and friendly atmosphere. The town’s economy is largely based on agriculture, and it is also home to several oil and gas companies, as well as several manufacturing companies. The town is predominantly white, with a small Hispanic population, and has a median household income of $35,000 and a median home value of $90,000.
Common Questions
What is the Total Population of East Duke?
Total Population of East Duke is 346.
What is the Total Male Population of East Duke?
Total Male Population of East Duke is 182.
What is the Total Female Population of East Duke?
Total Female Population of East Duke is 164.
What is the Ratio of Males per 100 Females in East Duke?
There are 110.98 Males per 100 Females in East Duke.
What is the Ratio of Females per 100 Males in East Duke?
There are 90.11 Females per 100 Males in East Duke.
What is the Median Population Age in East Duke?
Median Population Age in East Duke is 37.4 Years.
What is the Average Family Size in East Duke
Average Family Size in East Duke is 3.6 People.
What is the Average Household Size in East Duke
Average Household Size in East Duke is 2.8 People.
What is Per Capita Income in East Duke?
Per Capita income in East Duke is $34,283.
What is the Median Family Income in East Duke?
Median Family Income in East Duke is $84,375.
What is the Median Household income in East Duke?
Median Household Income in East Duke is $60,000.
What is Income or Wage Gap in East Duke?
Income or Wage Gap in East Duke is 35.5%.
Women in East Duke earn 64.5 cents for every dollar earned by a man.
What is Inequality or Gini Index in East Duke?
Inequality or Gini Index in East Duke is 0.48.
How Large is the Labor Force in East Duke?
There are 169 People in the Labor Forcein in East Duke.
What is the Percentage of People in the Labor Force in East Duke?
66.0% of People are in the Labor Force in East Duke.