Dwight Mission, OK
Dwight Mission Map
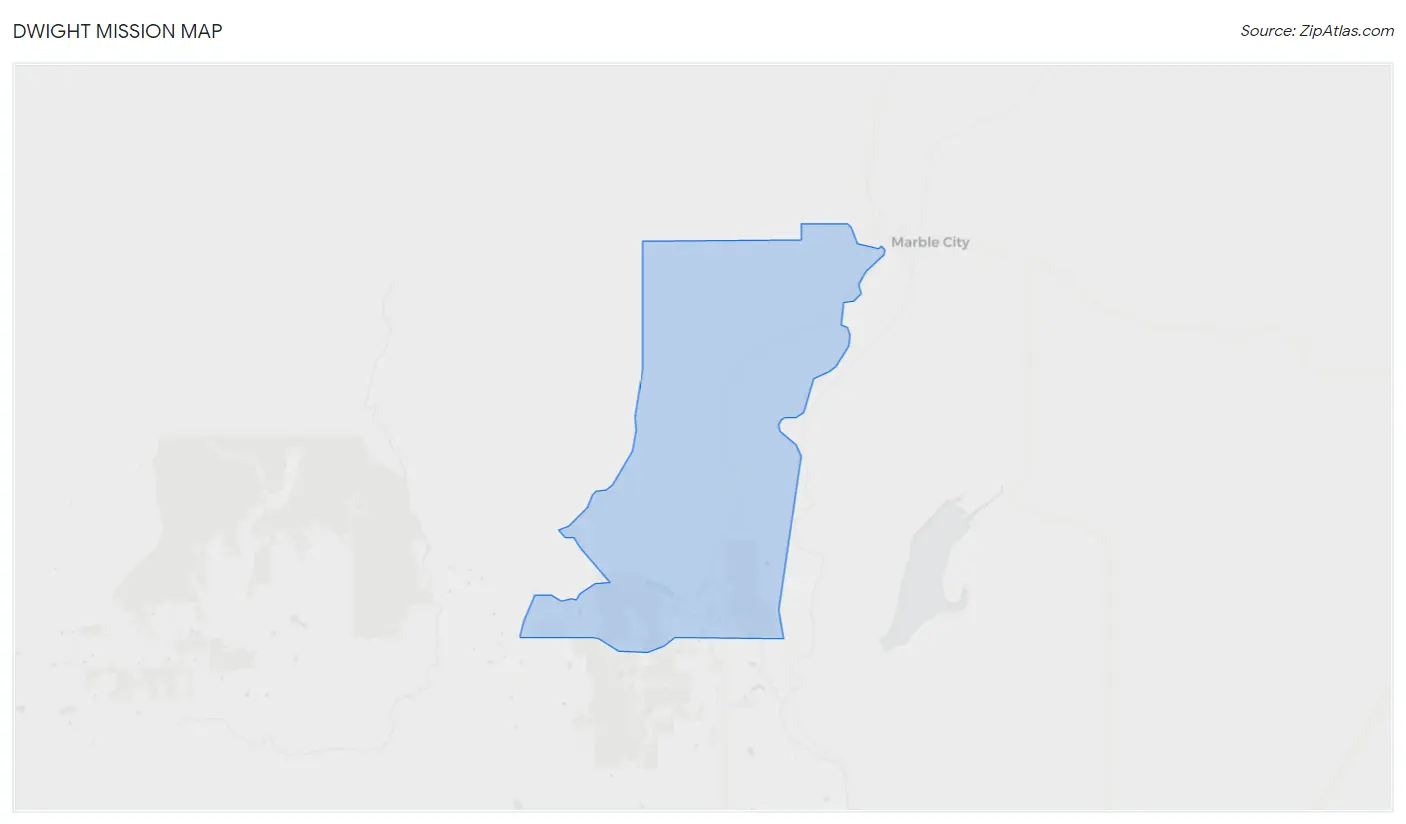
Dwight Mission Overview
35
TOTAL POPULATION
15
MALE POPULATION
20
FEMALE POPULATION
75.00
MALES / 100 FEMALES
133.33
FEMALES / 100 MALES
65.7
MEDIAN AGE
2.6
AVG FAMILY SIZE
2.1
AVG HOUSEHOLD SIZE
$25,171
PER CAPITA INCOME
$48,906
AVG FAMILY INCOME
$48,594
AVG HOUSEHOLD INCOME
0.15
INEQUALITY / GINI INDEX
6
LABOR FORCE [ PEOPLE ]
20.0%
PERCENT IN LABOR FORCE
Race in Dwight Mission
The most populous races in Dwight Mission are White / Caucasian (19 | 54.3%), Native / Alaskan (13 | 37.1%), and Two or more Races (3 | 8.6%).
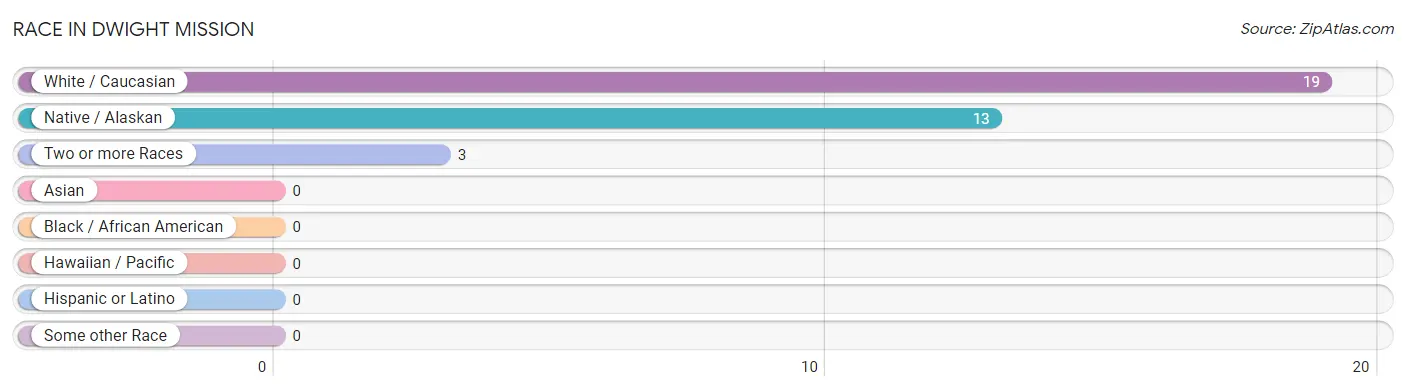
| Race | # Population | % Population |
| Asian | 0 | 0.0% |
| Black / African American | 0 | 0.0% |
| Hawaiian / Pacific | 0 | 0.0% |
| Hispanic or Latino | 0 | 0.0% |
| Native / Alaskan | 13 | 37.1% |
| White / Caucasian | 19 | 54.3% |
| Two or more Races | 3 | 8.6% |
| Some other Race | 0 | 0.0% |
| Total | 35 | 100.0% |
Ancestry in Dwight Mission
The most populous ancestries reported in Dwight Mission are Cherokee (15 | 42.9%), Irish (12 | 34.3%), American (10 | 28.6%), and French (1 | 2.9%), together accounting for 108.6% of all Dwight Mission residents.
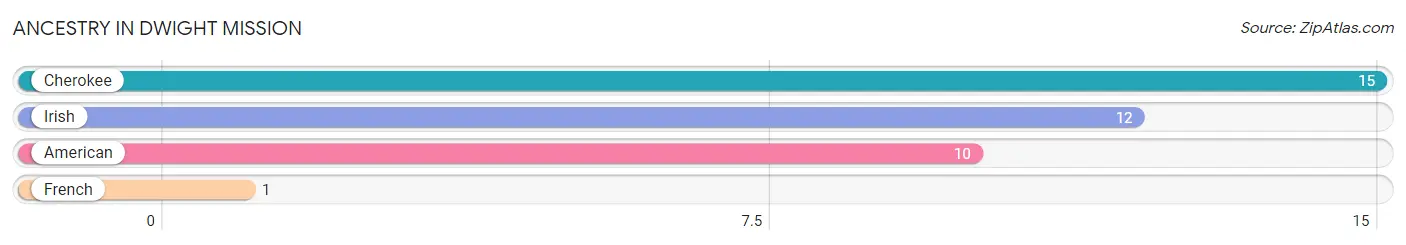
| Ancestry | # Population | % Population |
| American | 10 | 28.6% |
| Cherokee | 15 | 42.9% |
| French | 1 | 2.9% |
| Irish | 12 | 34.3% | View All 4 Rows |
Immigrants in Dwight Mission

| Immigration Origin | # Population | % Population | View All 0 Rows |
Sex and Age in Dwight Mission
Sex and Age in Dwight Mission
The most populous age groups in Dwight Mission are 70 to 74 Years (8 | 53.3%) for men and 65 to 69 Years (10 | 50.0%) for women.
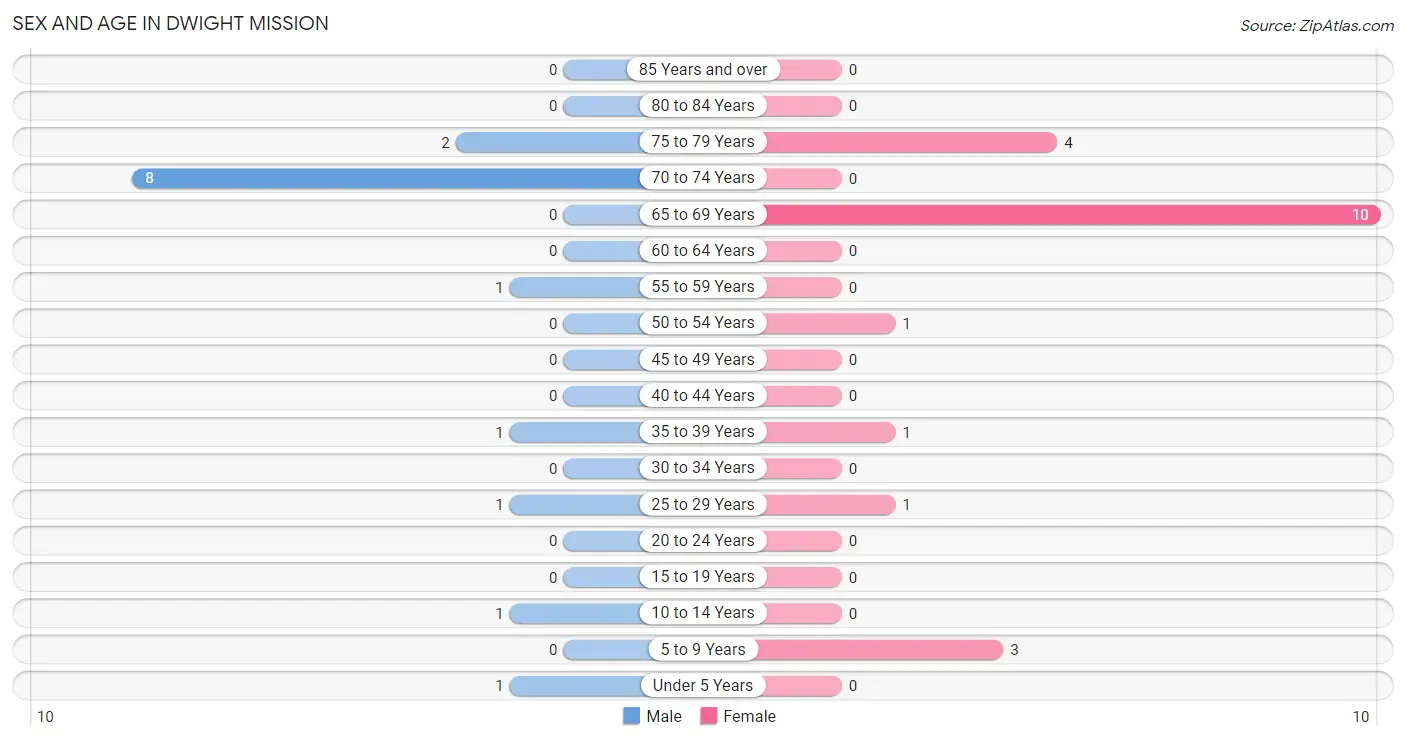
| Age Bracket | Male | Female |
| Under 5 Years | 1 (6.7%) | 0 (0.0%) |
| 5 to 9 Years | 0 (0.0%) | 3 (15.0%) |
| 10 to 14 Years | 1 (6.7%) | 0 (0.0%) |
| 15 to 19 Years | 0 (0.0%) | 0 (0.0%) |
| 20 to 24 Years | 0 (0.0%) | 0 (0.0%) |
| 25 to 29 Years | 1 (6.7%) | 1 (5.0%) |
| 30 to 34 Years | 0 (0.0%) | 0 (0.0%) |
| 35 to 39 Years | 1 (6.7%) | 1 (5.0%) |
| 40 to 44 Years | 0 (0.0%) | 0 (0.0%) |
| 45 to 49 Years | 0 (0.0%) | 0 (0.0%) |
| 50 to 54 Years | 0 (0.0%) | 1 (5.0%) |
| 55 to 59 Years | 1 (6.7%) | 0 (0.0%) |
| 60 to 64 Years | 0 (0.0%) | 0 (0.0%) |
| 65 to 69 Years | 0 (0.0%) | 10 (50.0%) |
| 70 to 74 Years | 8 (53.3%) | 0 (0.0%) |
| 75 to 79 Years | 2 (13.3%) | 4 (20.0%) |
| 80 to 84 Years | 0 (0.0%) | 0 (0.0%) |
| 85 Years and over | 0 (0.0%) | 0 (0.0%) |
| Total | 15 (100.0%) | 20 (100.0%) |
Families and Households in Dwight Mission
Median Family Size in Dwight Mission
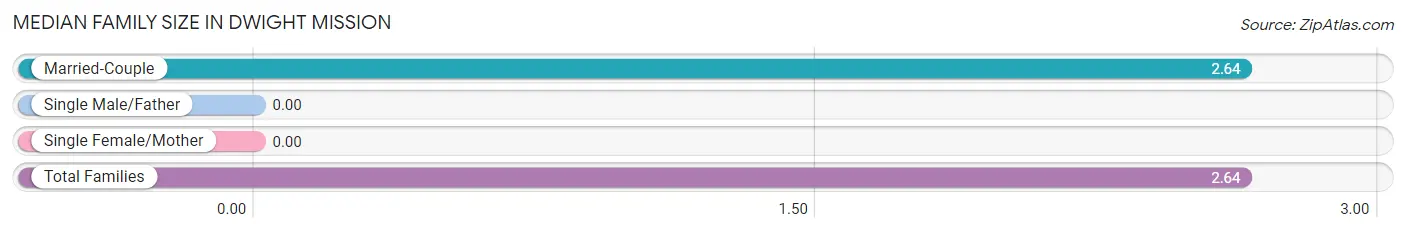
| Family Type | # Families | Family Size |
| Married-Couple | 11 (100.0%) | 2.64 |
| Single Male/Father | 0 (0.0%) | - |
| Single Female/Mother | 0 (0.0%) | - |
| Total Families | 11 (100.0%) | 2.64 |
Median Household Size in Dwight Mission
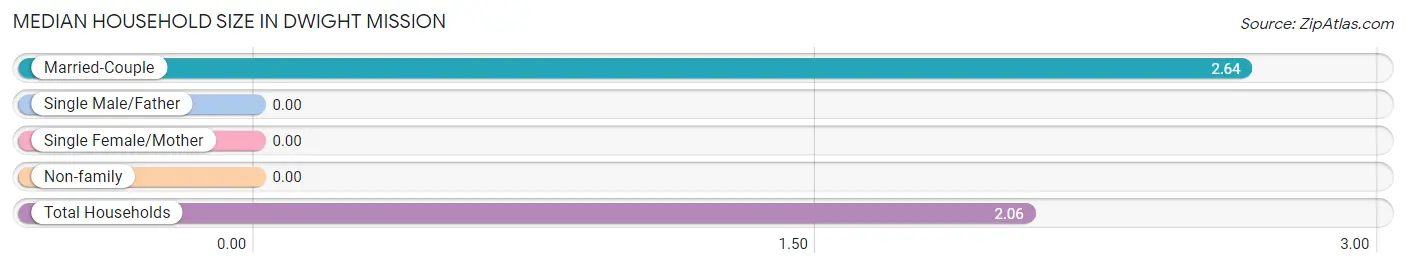
| Household Type | # Households | Household Size |
| Married-Couple | 11 (64.7%) | 2.64 |
| Single Male/Father | 0 (0.0%) | - |
| Single Female/Mother | 0 (0.0%) | - |
| Non-family | 6 (35.3%) | - |
| Total Households | 17 (100.0%) | 2.06 |
Household Size by Marriage Status in Dwight Mission
Out of a total of 17 households in Dwight Mission, 11 (64.7%) are family households, while 6 (35.3%) are nonfamily households. The most numerous type of family households are 2-person households, comprising 9, and the most common type of nonfamily households are 1-person households, comprising 6.
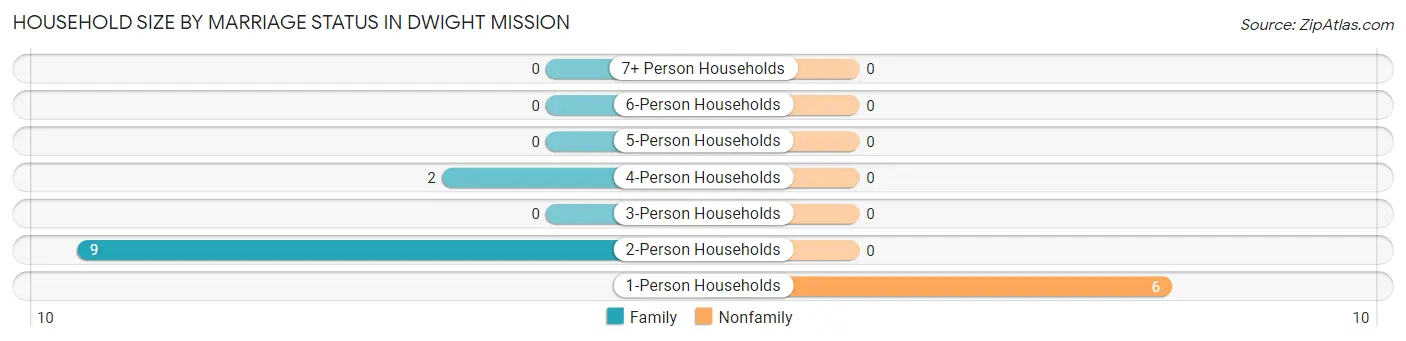
| Household Size | Family Households | Nonfamily Households |
| 1-Person Households | - | 6 (35.3%) |
| 2-Person Households | 9 (52.9%) | 0 (0.0%) |
| 3-Person Households | 0 (0.0%) | 0 (0.0%) |
| 4-Person Households | 2 (11.8%) | 0 (0.0%) |
| 5-Person Households | 0 (0.0%) | 0 (0.0%) |
| 6-Person Households | 0 (0.0%) | 0 (0.0%) |
| 7+ Person Households | 0 (0.0%) | 0 (0.0%) |
| Total | 11 (64.7%) | 6 (35.3%) |
Female Fertility in Dwight Mission
Fertility by Age in Dwight Mission
Average fertility rate in Dwight Mission is 500.0 births per 1,000 women. Women in the age bracket of 20 to 34 years have the highest fertility rate with 1,000.0 births per 1,000 women. Women in the age bracket of 20 to 34 years acount for 100.0% of all women with births.
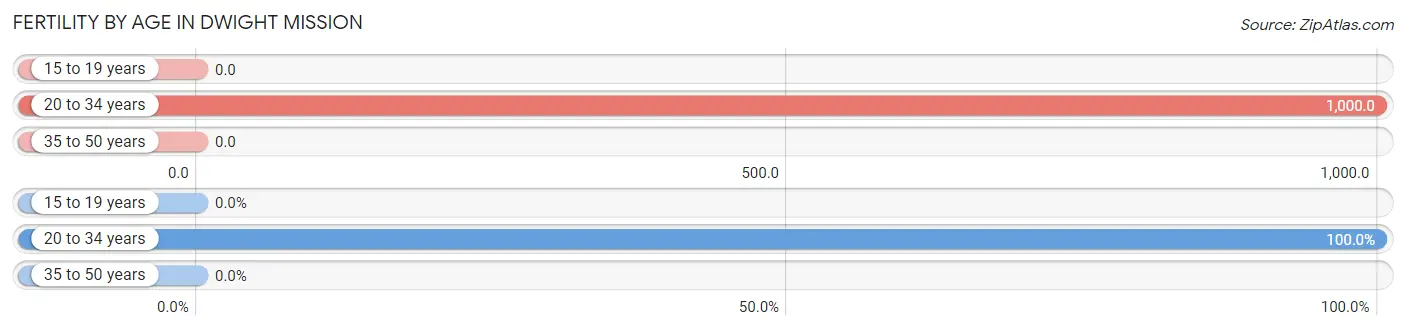
| Age Bracket | Women with Births | Births / 1,000 Women |
| 15 to 19 years | 0 (0.0%) | 0.0 |
| 20 to 34 years | 1 (100.0%) | 1,000.0 |
| 35 to 50 years | 0 (0.0%) | 0.0 |
| Total | 1 (100.0%) | 500.0 |
Fertility by Age by Marriage Status in Dwight Mission
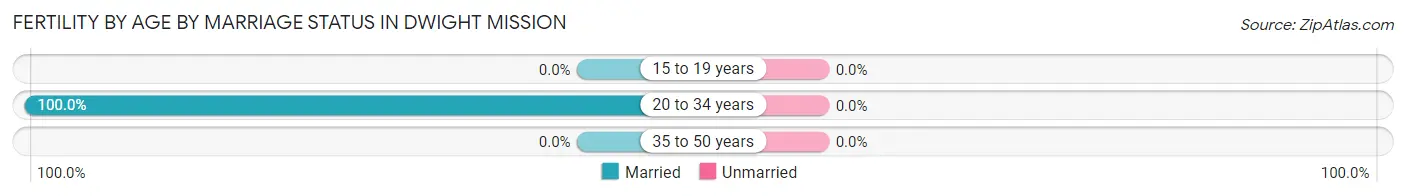
| Age Bracket | Married | Unmarried |
| 15 to 19 years | 0 (0.0%) | 0 (0.0%) |
| 20 to 34 years | 1 (100.0%) | 0 (0.0%) |
| 35 to 50 years | 0 (0.0%) | 0 (0.0%) |
| Total | 1 (100.0%) | 0 (0.0%) |
Fertility by Education in Dwight Mission
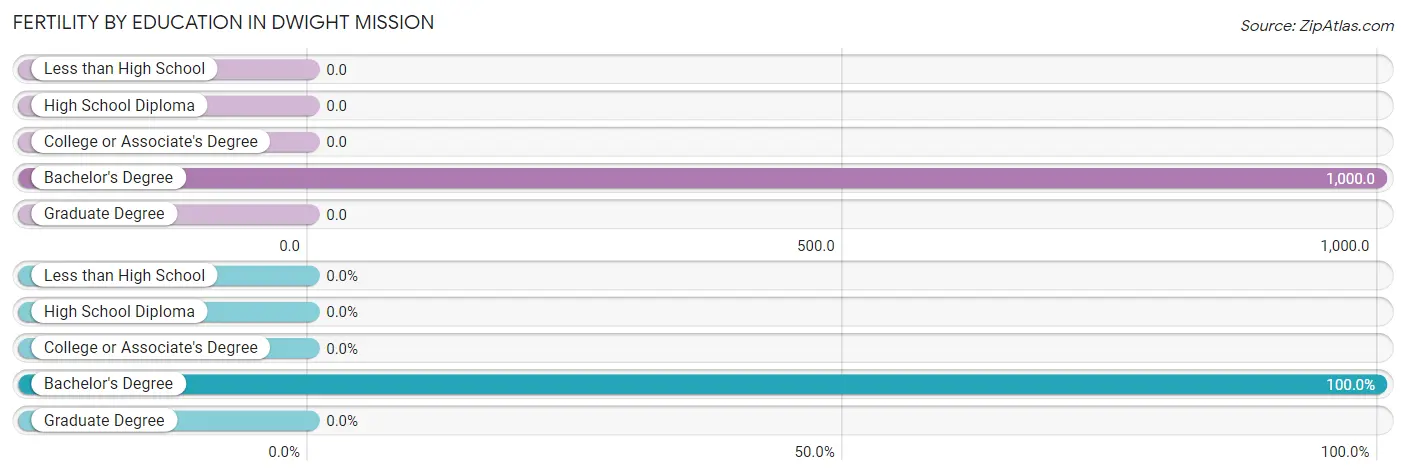
| Educational Attainment | Women with Births | Births / 1,000 Women |
| Less than High School | 0 (0.0%) | 0.0 |
| High School Diploma | 0 (0.0%) | 0.0 |
| College or Associate's Degree | 0 (0.0%) | 0.0 |
| Bachelor's Degree | 1 (100.0%) | 1,000.0 |
| Graduate Degree | 0 (0.0%) | 0.0 |
| Total | 1 (100.0%) | 500.0 |
Fertility by Education by Marriage Status in Dwight Mission
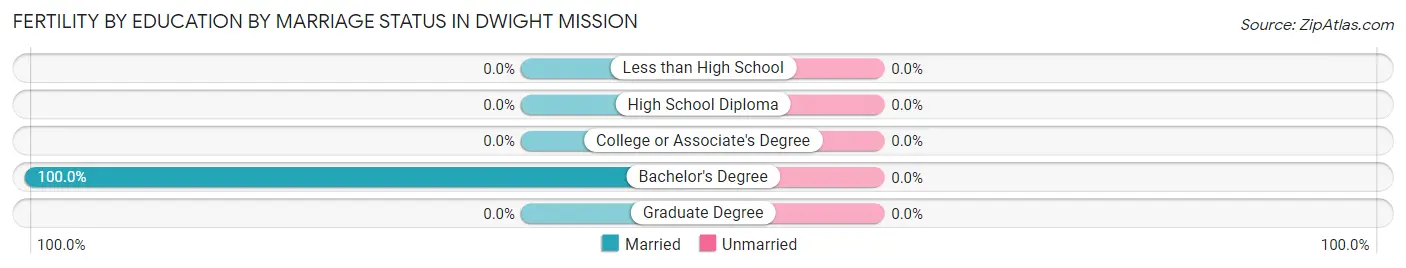
| Educational Attainment | Married | Unmarried |
| Less than High School | 0 (0.0%) | 0 (0.0%) |
| High School Diploma | 0 (0.0%) | 0 (0.0%) |
| College or Associate's Degree | 0 (0.0%) | 0 (0.0%) |
| Bachelor's Degree | 1 (100.0%) | 0 (0.0%) |
| Graduate Degree | 0 (0.0%) | 0 (0.0%) |
| Total | 1 (100.0%) | 0 (0.0%) |
Income in Dwight Mission
Income Overview in Dwight Mission
Per Capita Income in Dwight Mission is $25,171, while median incomes of families and households are $48,906 and $48,594 respectively.
| Characteristic | Number | Measure |
| Per Capita Income | 35 | $25,171 |
| Median Family Income | 11 | $48,906 |
| Mean Family Income | 11 | $54,682 |
| Median Household Income | 17 | $48,594 |
| Mean Household Income | 17 | $49,294 |
| Income Deficit | 11 | $0 |
| Wage / Income Gap (%) | 35 | 0.00% |
| Wage / Income Gap ($) | 35 | 100.00¢ per $1 |
| Gini / Inequality Index | 35 | 0.15 |
Earnings by Sex in Dwight Mission
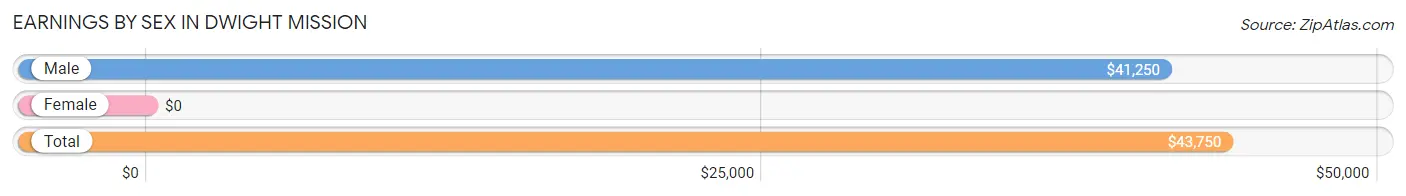
| Sex | Number | Average Earnings |
| Male | 5 (83.3%) | $41,250 |
| Female | 1 (16.7%) | $0 |
| Total | 6 (100.0%) | $43,750 |
Earnings by Sex by Income Bracket in Dwight Mission
The most common earnings brackets in Dwight Mission are $35,000 to $39,999 for men (2 | 40.0%) and $45,000 to $49,999 for women (1 | 100.0%).
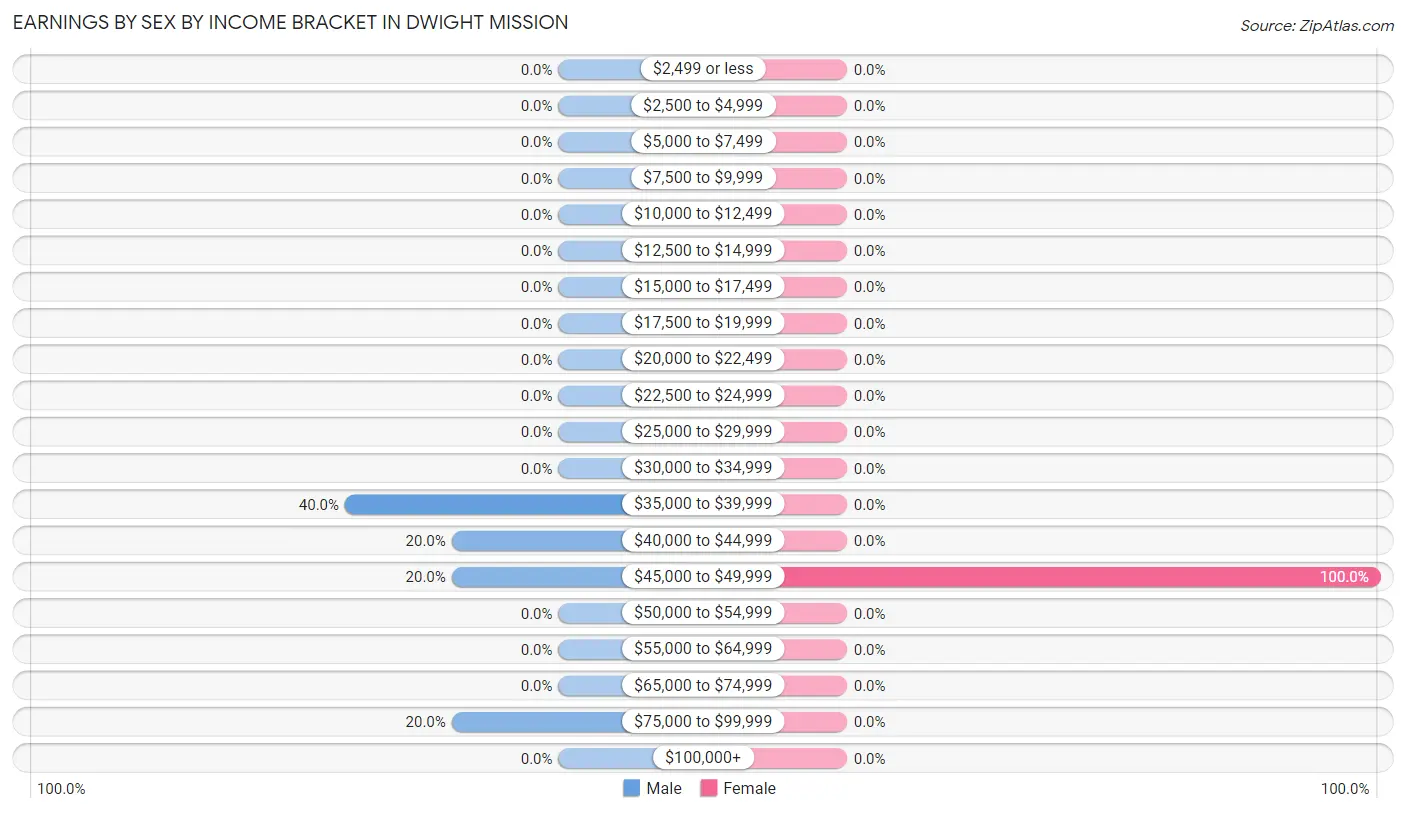
| Income | Male | Female |
| $2,499 or less | 0 (0.0%) | 0 (0.0%) |
| $2,500 to $4,999 | 0 (0.0%) | 0 (0.0%) |
| $5,000 to $7,499 | 0 (0.0%) | 0 (0.0%) |
| $7,500 to $9,999 | 0 (0.0%) | 0 (0.0%) |
| $10,000 to $12,499 | 0 (0.0%) | 0 (0.0%) |
| $12,500 to $14,999 | 0 (0.0%) | 0 (0.0%) |
| $15,000 to $17,499 | 0 (0.0%) | 0 (0.0%) |
| $17,500 to $19,999 | 0 (0.0%) | 0 (0.0%) |
| $20,000 to $22,499 | 0 (0.0%) | 0 (0.0%) |
| $22,500 to $24,999 | 0 (0.0%) | 0 (0.0%) |
| $25,000 to $29,999 | 0 (0.0%) | 0 (0.0%) |
| $30,000 to $34,999 | 0 (0.0%) | 0 (0.0%) |
| $35,000 to $39,999 | 2 (40.0%) | 0 (0.0%) |
| $40,000 to $44,999 | 1 (20.0%) | 0 (0.0%) |
| $45,000 to $49,999 | 1 (20.0%) | 1 (100.0%) |
| $50,000 to $54,999 | 0 (0.0%) | 0 (0.0%) |
| $55,000 to $64,999 | 0 (0.0%) | 0 (0.0%) |
| $65,000 to $74,999 | 0 (0.0%) | 0 (0.0%) |
| $75,000 to $99,999 | 1 (20.0%) | 0 (0.0%) |
| $100,000+ | 0 (0.0%) | 0 (0.0%) |
| Total | 5 (100.0%) | 1 (100.0%) |
Earnings by Sex by Educational Attainment in Dwight Mission
| Educational Attainment | Male Income | Female Income |
| Less than High School | - | - |
| High School Diploma | - | - |
| College or Associate's Degree | - | - |
| Bachelor's Degree | - | - |
| Graduate Degree | - | - |
| Total | $41,250 | $0 |
Family Income in Dwight Mission
Family Income Brackets in Dwight Mission
According to the Dwight Mission family income data, there are 9 families falling into the $35,000 to $49,999 income range, which is the most common income bracket and makes up 81.8% of all families.
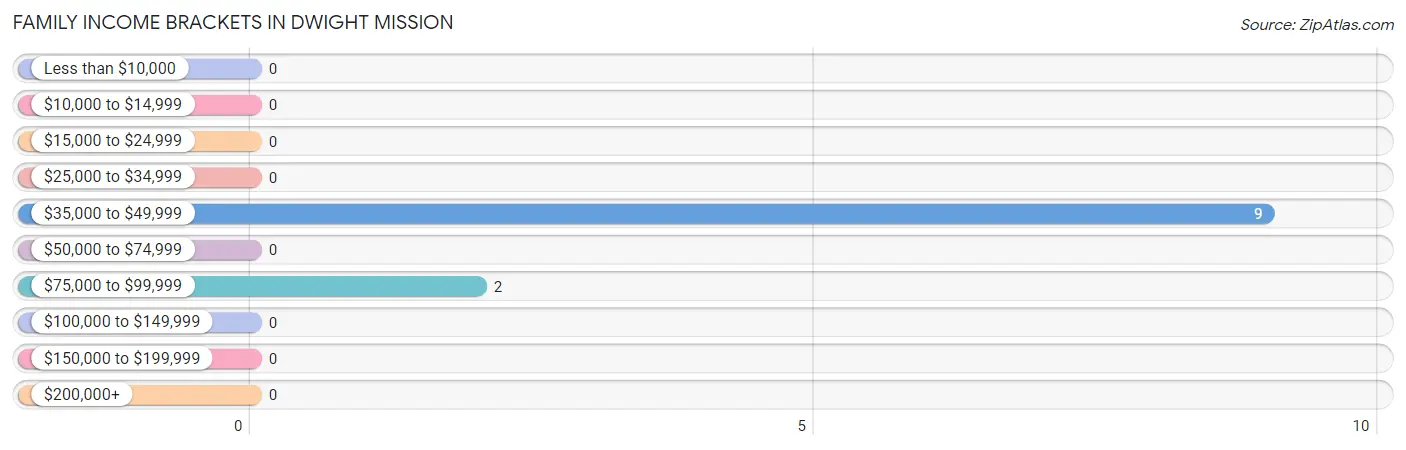
| Income Bracket | # Families | % Families |
| Less than $10,000 | 0 | 0.0% |
| $10,000 to $14,999 | 0 | 0.0% |
| $15,000 to $24,999 | 0 | 0.0% |
| $25,000 to $34,999 | 0 | 0.0% |
| $35,000 to $49,999 | 9 | 81.8% |
| $50,000 to $74,999 | 0 | 0.0% |
| $75,000 to $99,999 | 2 | 18.2% |
| $100,000 to $149,999 | 0 | 0.0% |
| $150,000 to $199,999 | 0 | 0.0% |
| $200,000+ | 0 | 0.0% |
Family Income by Famaliy Size in Dwight Mission
| Income Bracket | # Families | Median Income |
| 2-Person Families | 9 (81.8%) | $0 |
| 3-Person Families | 0 (0.0%) | $0 |
| 4-Person Families | 2 (18.2%) | $0 |
| 5-Person Families | 0 (0.0%) | $0 |
| 6-Person Families | 0 (0.0%) | $0 |
| 7+ Person Families | 0 (0.0%) | $0 |
| Total | 11 (100.0%) | $48,906 |
Family Income by Number of Earners in Dwight Mission
| Number of Earners | # Families | Median Income |
| No Earners | 8 (72.7%) | $0 |
| 1 Earner | 2 (18.2%) | $0 |
| 2 Earners | 1 (9.1%) | $0 |
| 3+ Earners | 0 (0.0%) | $0 |
| Total | 11 (100.0%) | $48,906 |
Household Income in Dwight Mission
Household Income Brackets in Dwight Mission
With 12 households falling in the category, the $35,000 to $49,999 income range is the most frequent in Dwight Mission, accounting for 70.6% of all households.
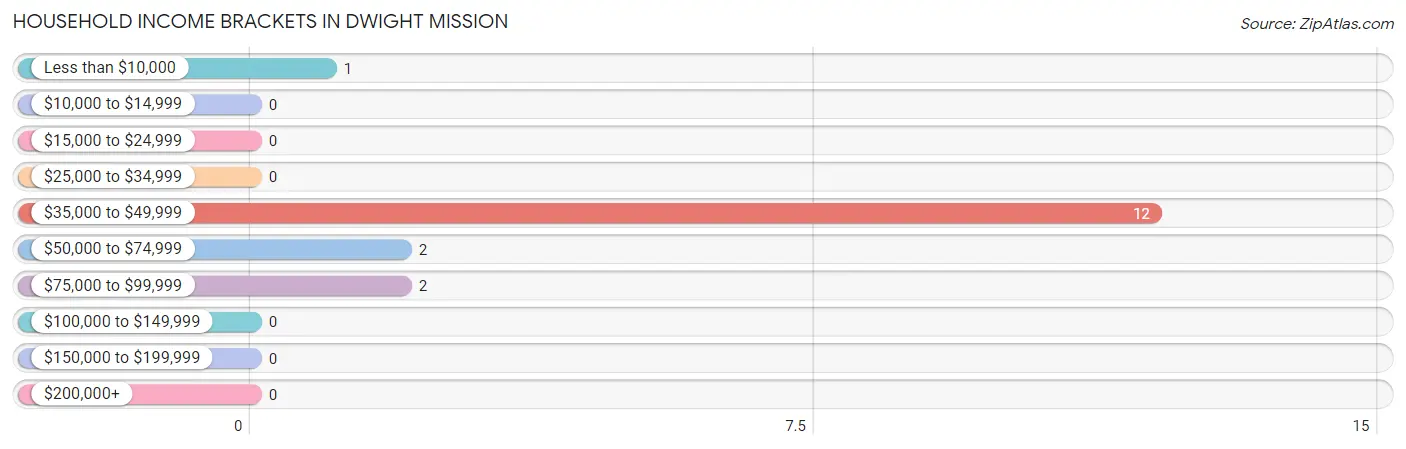
| Income Bracket | # Households | % Households |
| Less than $10,000 | 1 | 5.9% |
| $10,000 to $14,999 | 0 | 0.0% |
| $15,000 to $24,999 | 0 | 0.0% |
| $25,000 to $34,999 | 0 | 0.0% |
| $35,000 to $49,999 | 12 | 70.6% |
| $50,000 to $74,999 | 2 | 11.8% |
| $75,000 to $99,999 | 2 | 11.8% |
| $100,000 to $149,999 | 0 | 0.0% |
| $150,000 to $199,999 | 0 | 0.0% |
| $200,000+ | 0 | 0.0% |
Household Income by Householder Age in Dwight Mission
The median household income in Dwight Mission is $48,594, with the highest median household income of $48,438 found in the 65+ years age bracket for the primary householder. A total of 14 households (82.4%) fall into this category.
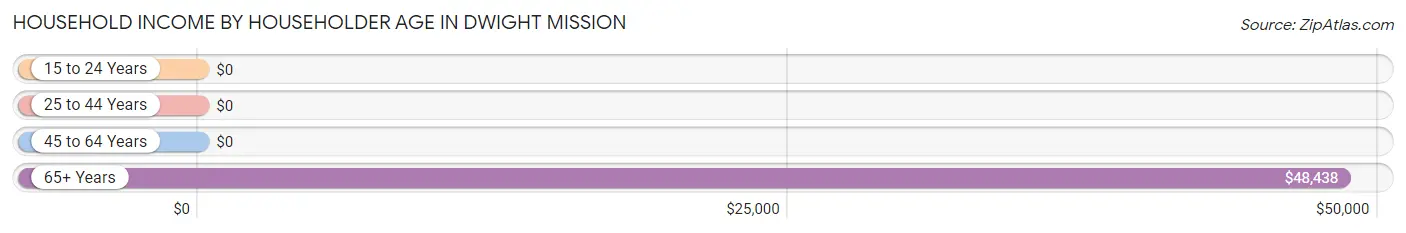
| Income Bracket | # Households | Median Income |
| 15 to 24 Years | 0 (0.0%) | $0 |
| 25 to 44 Years | 2 (11.8%) | $0 |
| 45 to 64 Years | 1 (5.9%) | $0 |
| 65+ Years | 14 (82.4%) | $48,438 |
| Total | 17 (100.0%) | $48,594 |
Poverty in Dwight Mission
Income Below Poverty by Sex and Age in Dwight Mission
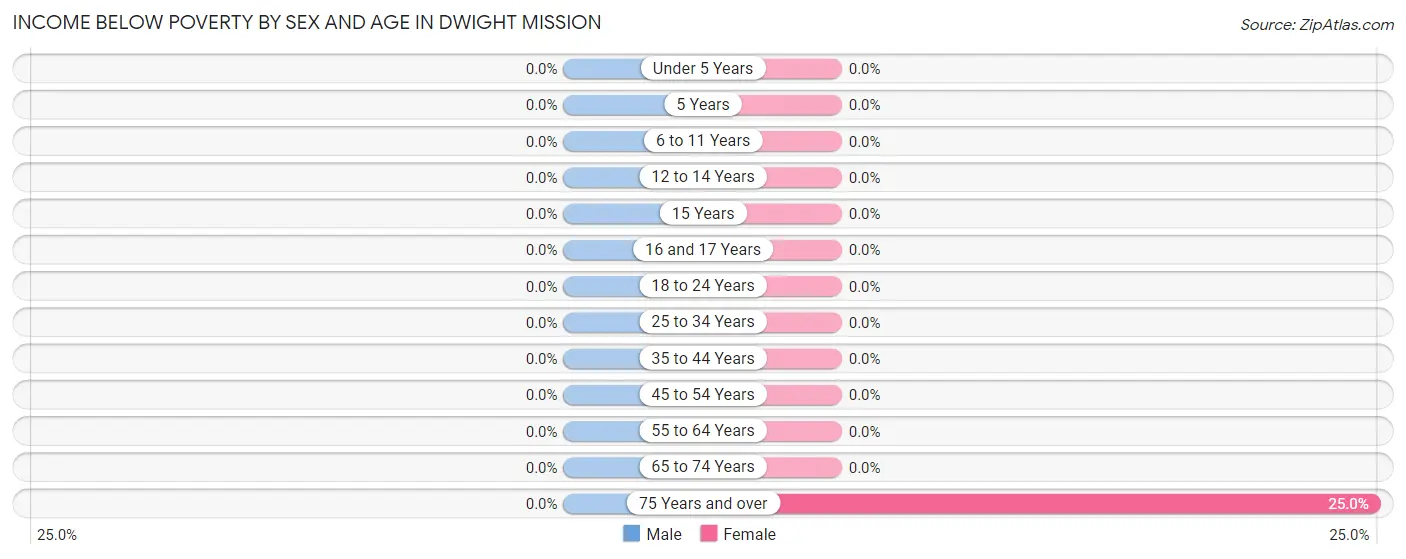
| Age Bracket | Male | Female |
| Under 5 Years | 0 (0.0%) | 0 (0.0%) |
| 5 Years | 0 (0.0%) | 0 (0.0%) |
| 6 to 11 Years | 0 (0.0%) | 0 (0.0%) |
| 12 to 14 Years | 0 (0.0%) | 0 (0.0%) |
| 15 Years | 0 (0.0%) | 0 (0.0%) |
| 16 and 17 Years | 0 (0.0%) | 0 (0.0%) |
| 18 to 24 Years | 0 (0.0%) | 0 (0.0%) |
| 25 to 34 Years | 0 (0.0%) | 0 (0.0%) |
| 35 to 44 Years | 0 (0.0%) | 0 (0.0%) |
| 45 to 54 Years | 0 (0.0%) | 0 (0.0%) |
| 55 to 64 Years | 0 (0.0%) | 0 (0.0%) |
| 65 to 74 Years | 0 (0.0%) | 0 (0.0%) |
| 75 Years and over | 0 (0.0%) | 1 (25.0%) |
| Total | 0 (0.0%) | 1 (5.0%) |
Income Above Poverty by Sex and Age in Dwight Mission
According to the poverty statistics in Dwight Mission, males aged under 5 years and females aged 5 years are the age groups that are most secure financially, with 100.0% of males and 100.0% of females in these age groups living above the poverty line.
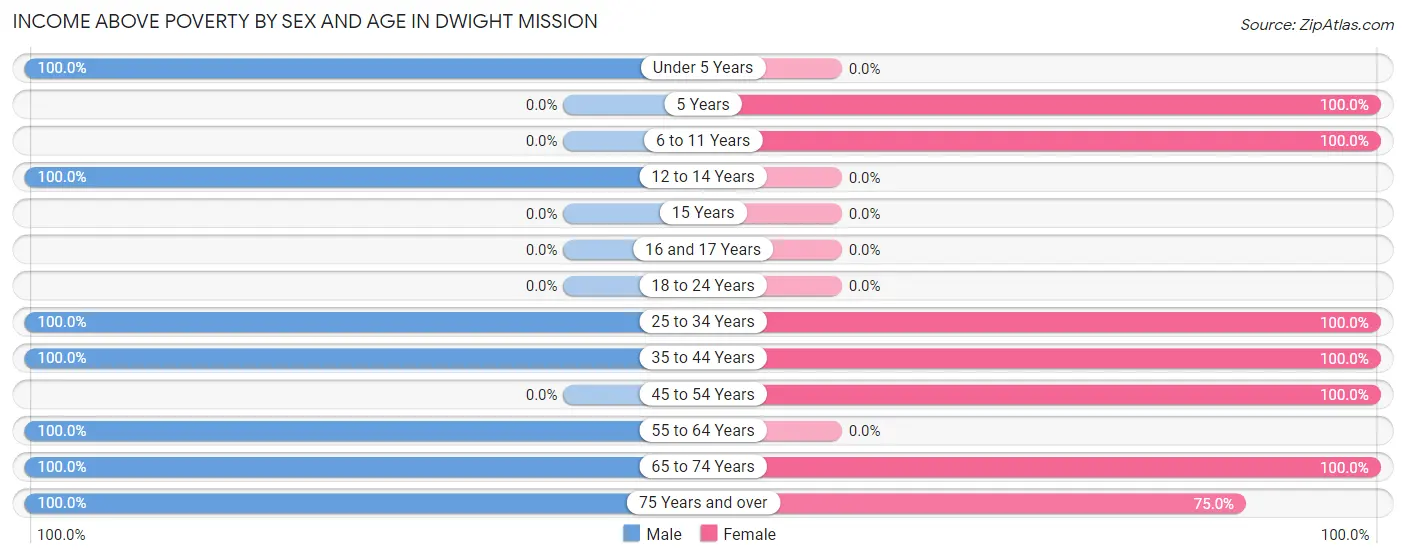
| Age Bracket | Male | Female |
| Under 5 Years | 1 (100.0%) | 0 (0.0%) |
| 5 Years | 0 (0.0%) | 1 (100.0%) |
| 6 to 11 Years | 0 (0.0%) | 2 (100.0%) |
| 12 to 14 Years | 1 (100.0%) | 0 (0.0%) |
| 15 Years | 0 (0.0%) | 0 (0.0%) |
| 16 and 17 Years | 0 (0.0%) | 0 (0.0%) |
| 18 to 24 Years | 0 (0.0%) | 0 (0.0%) |
| 25 to 34 Years | 1 (100.0%) | 1 (100.0%) |
| 35 to 44 Years | 1 (100.0%) | 1 (100.0%) |
| 45 to 54 Years | 0 (0.0%) | 1 (100.0%) |
| 55 to 64 Years | 1 (100.0%) | 0 (0.0%) |
| 65 to 74 Years | 8 (100.0%) | 10 (100.0%) |
| 75 Years and over | 2 (100.0%) | 3 (75.0%) |
| Total | 15 (100.0%) | 19 (95.0%) |
Income Below Poverty Among Married-Couple Families in Dwight Mission
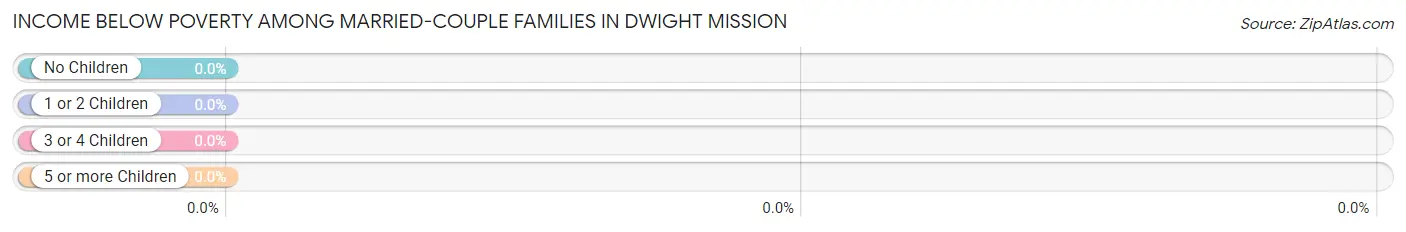
| Children | Above Poverty | Below Poverty |
| No Children | 9 (100.0%) | 0 (0.0%) |
| 1 or 2 Children | 2 (100.0%) | 0 (0.0%) |
| 3 or 4 Children | 0 (0.0%) | 0 (0.0%) |
| 5 or more Children | 0 (0.0%) | 0 (0.0%) |
| Total | 11 (100.0%) | 0 (0.0%) |
Income Below Poverty Among Single-Parent Households in Dwight Mission
| Children | Single Father | Single Mother |
| No Children | 0 (0.0%) | 0 (0.0%) |
| 1 or 2 Children | 0 (0.0%) | 0 (0.0%) |
| 3 or 4 Children | 0 (0.0%) | 0 (0.0%) |
| 5 or more Children | 0 (0.0%) | 0 (0.0%) |
| Total | 0 (0.0%) | 0 (0.0%) |
Income Below Poverty Among Married-Couple vs Single-Parent Households in Dwight Mission
| Children | Married-Couple Families | Single-Parent Households |
| No Children | 0 (0.0%) | 0 (0.0%) |
| 1 or 2 Children | 0 (0.0%) | 0 (0.0%) |
| 3 or 4 Children | 0 (0.0%) | 0 (0.0%) |
| 5 or more Children | 0 (0.0%) | 0 (0.0%) |
| Total | 0 (0.0%) | 0 (0.0%) |
Employment Characteristics in Dwight Mission
Employment by Class of Employer in Dwight Mission
Among the 6 employed individuals in Dwight Mission, private company employees (2 | 33.3%), state government employees (2 | 33.3%), and self-employed (not incorporated) (1 | 16.7%) make up the most common classes of employment.
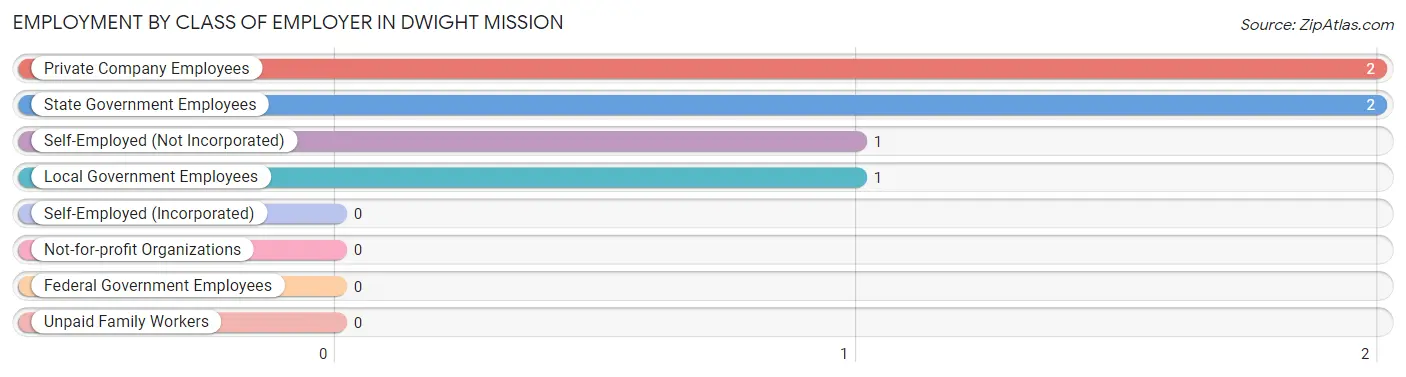
| Employer Class | # Employees | % Employees |
| Private Company Employees | 2 | 33.3% |
| Self-Employed (Incorporated) | 0 | 0.0% |
| Self-Employed (Not Incorporated) | 1 | 16.7% |
| Not-for-profit Organizations | 0 | 0.0% |
| Local Government Employees | 1 | 16.7% |
| State Government Employees | 2 | 33.3% |
| Federal Government Employees | 0 | 0.0% |
| Unpaid Family Workers | 0 | 0.0% |
| Total | 6 | 100.0% |
Employment Status by Age in Dwight Mission
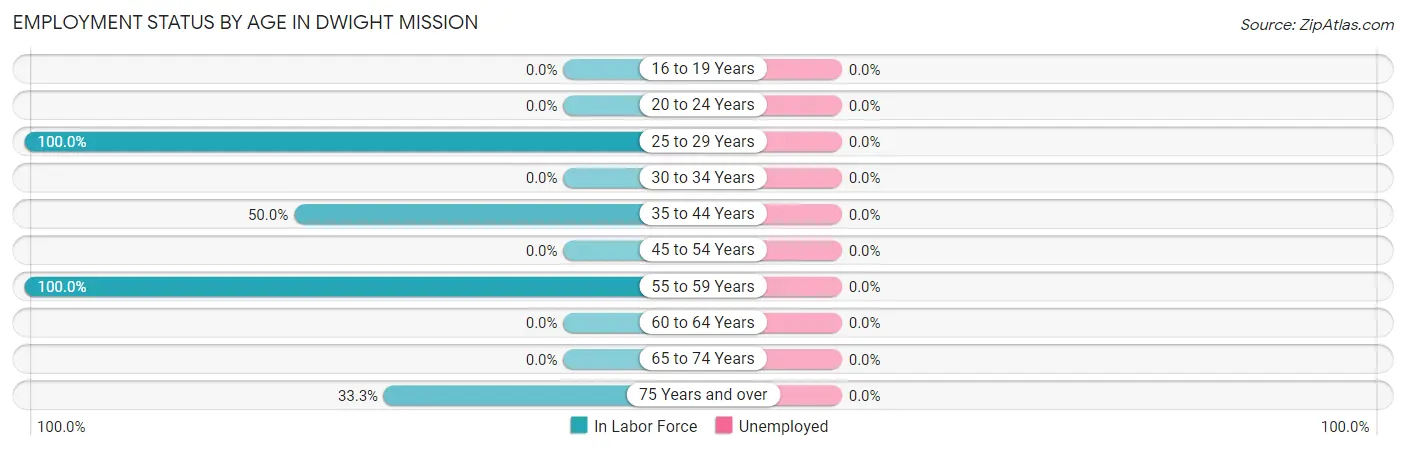
| Age Bracket | In Labor Force | Unemployed |
| 16 to 19 Years | 0 (0.0%) | 0 (0.0%) |
| 20 to 24 Years | 0 (0.0%) | 0 (0.0%) |
| 25 to 29 Years | 2 (100.0%) | 0 (0.0%) |
| 30 to 34 Years | 0 (0.0%) | 0 (0.0%) |
| 35 to 44 Years | 1 (50.0%) | 0 (0.0%) |
| 45 to 54 Years | 0 (0.0%) | 0 (0.0%) |
| 55 to 59 Years | 1 (100.0%) | 0 (0.0%) |
| 60 to 64 Years | 0 (0.0%) | 0 (0.0%) |
| 65 to 74 Years | 0 (0.0%) | 0 (0.0%) |
| 75 Years and over | 2 (33.3%) | 0 (0.0%) |
| Total | 6 (20.0%) | 0 (0.0%) |
Employment Status by Educational Attainment in Dwight Mission
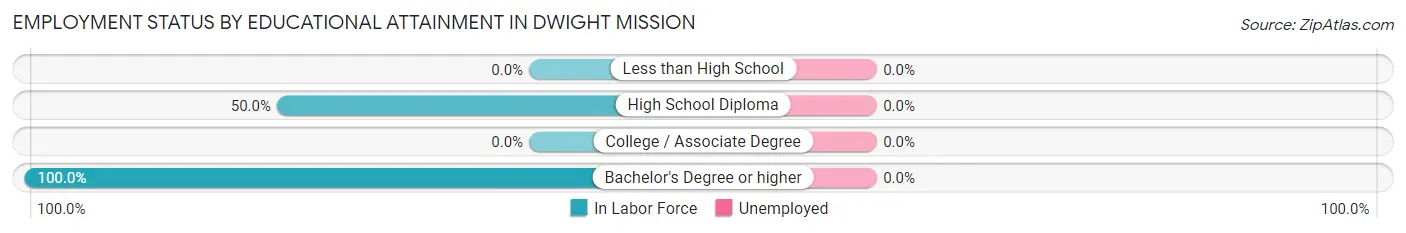
| Educational Attainment | In Labor Force | Unemployed |
| Less than High School | 0 (0.0%) | 0 (0.0%) |
| High School Diploma | 2 (50.0%) | 0 (0.0%) |
| College / Associate Degree | 0 (0.0%) | 0 (0.0%) |
| Bachelor's Degree or higher | 2 (100.0%) | 0 (0.0%) |
| Total | 4 (66.7%) | 0 (0.0%) |
Employment Occupations by Sex in Dwight Mission
Management, Business, Science and Arts Occupations
The most common Management, Business, Science and Arts occupations in Dwight Mission are Community & Social Service (2 | 33.3%), and Education Instruction & Library (2 | 33.3%).
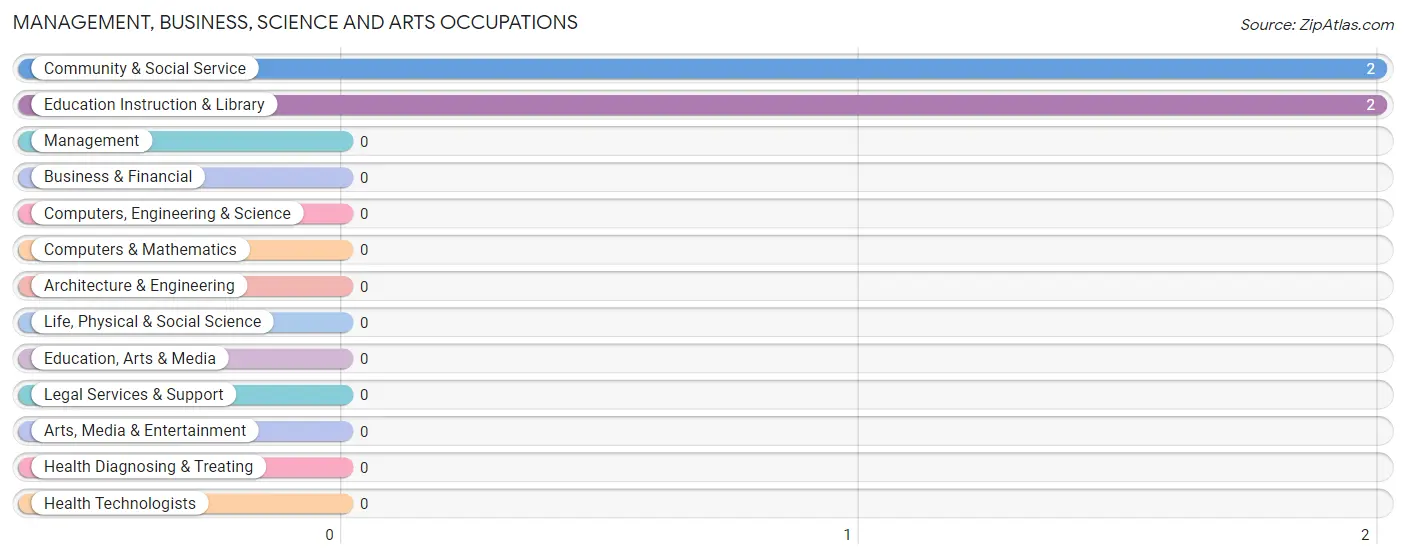
Management, Business, Science and Arts Occupations by Sex
Within the Management, Business, Science and Arts occupations in Dwight Mission, the most male-oriented occupations are Community & Social Service (50.0%), and Education Instruction & Library (50.0%), while the most female-oriented occupations are Community & Social Service (50.0%), and Education Instruction & Library (50.0%).
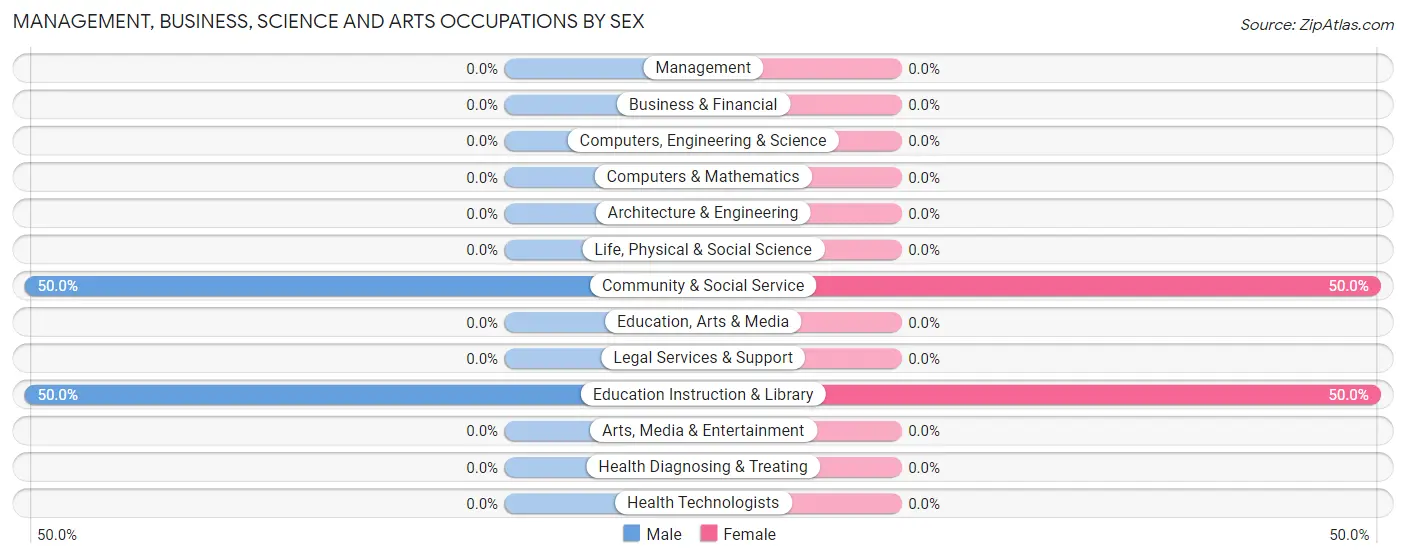
| Occupation | Male | Female |
| Management | 0 (0.0%) | 0 (0.0%) |
| Business & Financial | 0 (0.0%) | 0 (0.0%) |
| Computers, Engineering & Science | 0 (0.0%) | 0 (0.0%) |
| Computers & Mathematics | 0 (0.0%) | 0 (0.0%) |
| Architecture & Engineering | 0 (0.0%) | 0 (0.0%) |
| Life, Physical & Social Science | 0 (0.0%) | 0 (0.0%) |
| Community & Social Service | 1 (50.0%) | 1 (50.0%) |
| Education, Arts & Media | 0 (0.0%) | 0 (0.0%) |
| Legal Services & Support | 0 (0.0%) | 0 (0.0%) |
| Education Instruction & Library | 1 (50.0%) | 1 (50.0%) |
| Arts, Media & Entertainment | 0 (0.0%) | 0 (0.0%) |
| Health Diagnosing & Treating | 0 (0.0%) | 0 (0.0%) |
| Health Technologists | 0 (0.0%) | 0 (0.0%) |
| Total (Category) | 1 (50.0%) | 1 (50.0%) |
| Total (Overall) | 5 (83.3%) | 1 (16.7%) |
Services Occupations
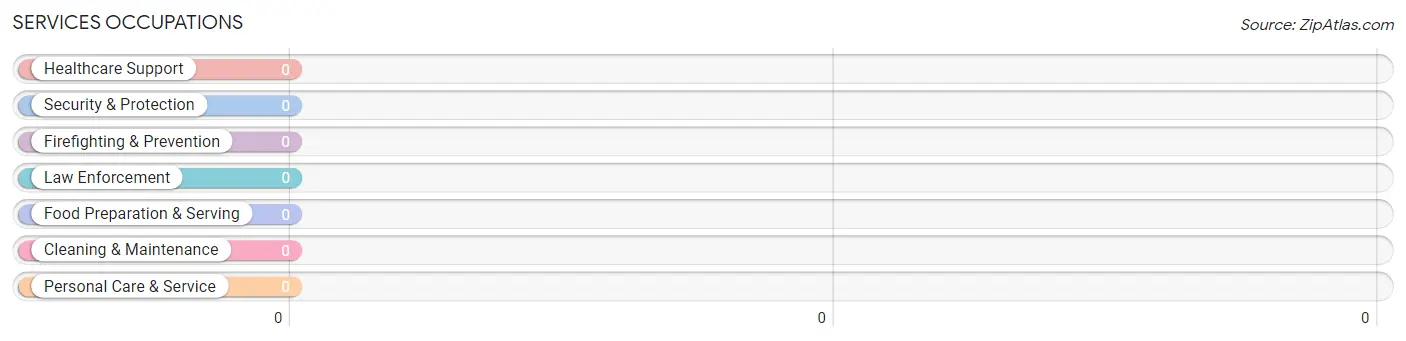
Services Occupations by Sex
| Occupation | Male | Female |
| Healthcare Support | 0 (0.0%) | 0 (0.0%) |
| Security & Protection | 0 (0.0%) | 0 (0.0%) |
| Firefighting & Prevention | 0 (0.0%) | 0 (0.0%) |
| Law Enforcement | 0 (0.0%) | 0 (0.0%) |
| Food Preparation & Serving | 0 (0.0%) | 0 (0.0%) |
| Cleaning & Maintenance | 0 (0.0%) | 0 (0.0%) |
| Personal Care & Service | 0 (0.0%) | 0 (0.0%) |
| Total (Category) | 0 (0.0%) | 0 (0.0%) |
| Total (Overall) | 5 (83.3%) | 1 (16.7%) |
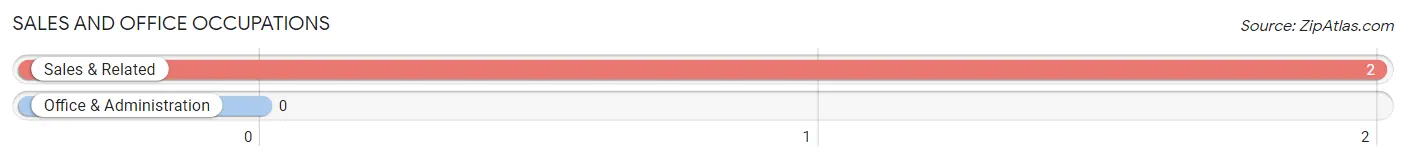
Sales and Office Occupations
The most common Sales and Office occupations in Dwight Mission are , and Sales & Related (2 | 33.3%).
Sales and Office Occupations by Sex
| Occupation | Male | Female |
| Sales & Related | 2 (100.0%) | 0 (0.0%) |
| Office & Administration | 0 (0.0%) | 0 (0.0%) |
| Total (Category) | 2 (100.0%) | 0 (0.0%) |
| Total (Overall) | 5 (83.3%) | 1 (16.7%) |
Natural Resources, Construction and Maintenance Occupations
The most common Natural Resources, Construction and Maintenance occupations in Dwight Mission are Construction & Extraction (1 | 16.7%), and Installation, Maintenance & Repair (1 | 16.7%).
Natural Resources, Construction and Maintenance Occupations by Sex
| Occupation | Male | Female |
| Farming, Fishing & Forestry | 0 (0.0%) | 0 (0.0%) |
| Construction & Extraction | 1 (100.0%) | 0 (0.0%) |
| Installation, Maintenance & Repair | 1 (100.0%) | 0 (0.0%) |
| Total (Category) | 2 (100.0%) | 0 (0.0%) |
| Total (Overall) | 5 (83.3%) | 1 (16.7%) |
Production, Transportation and Moving Occupations
Production, Transportation and Moving Occupations by Sex
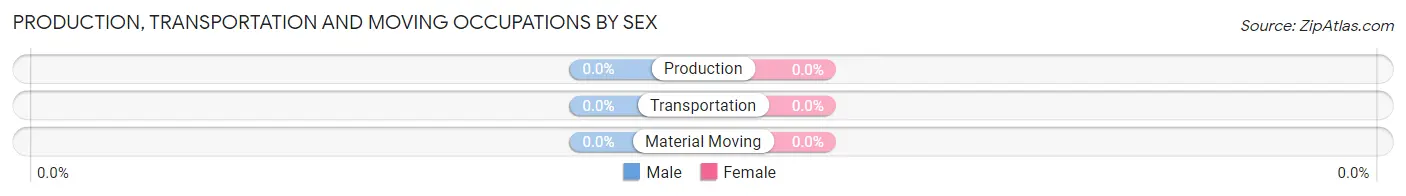
| Occupation | Male | Female |
| Production | 0 (0.0%) | 0 (0.0%) |
| Transportation | 0 (0.0%) | 0 (0.0%) |
| Material Moving | 0 (0.0%) | 0 (0.0%) |
| Total (Category) | 0 (0.0%) | 0 (0.0%) |
| Total (Overall) | 5 (83.3%) | 1 (16.7%) |
Employment Industries by Sex in Dwight Mission
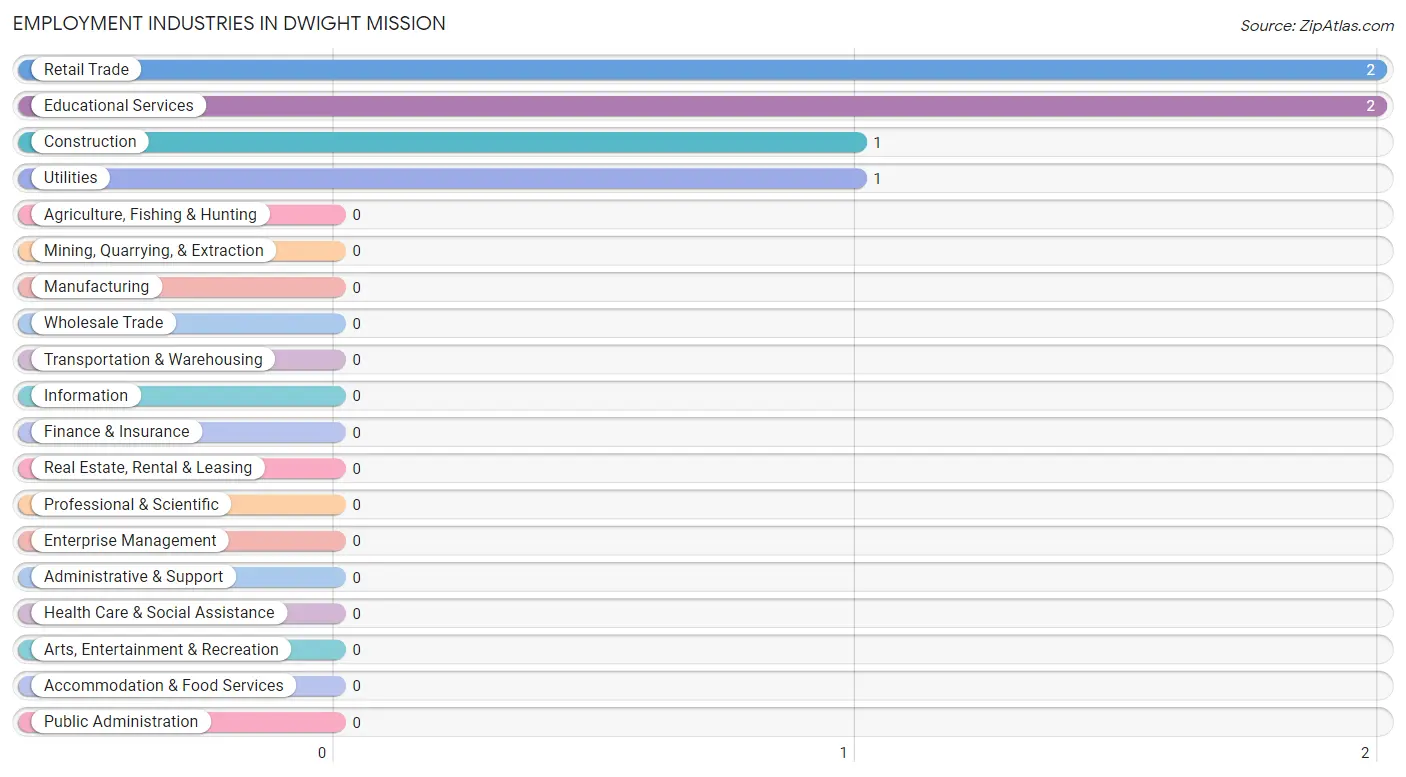
Employment Industries in Dwight Mission
The major employment industries in Dwight Mission include Retail Trade (2 | 33.3%), Educational Services (2 | 33.3%), Construction (1 | 16.7%), and Utilities (1 | 16.7%).
Employment Industries by Sex in Dwight Mission
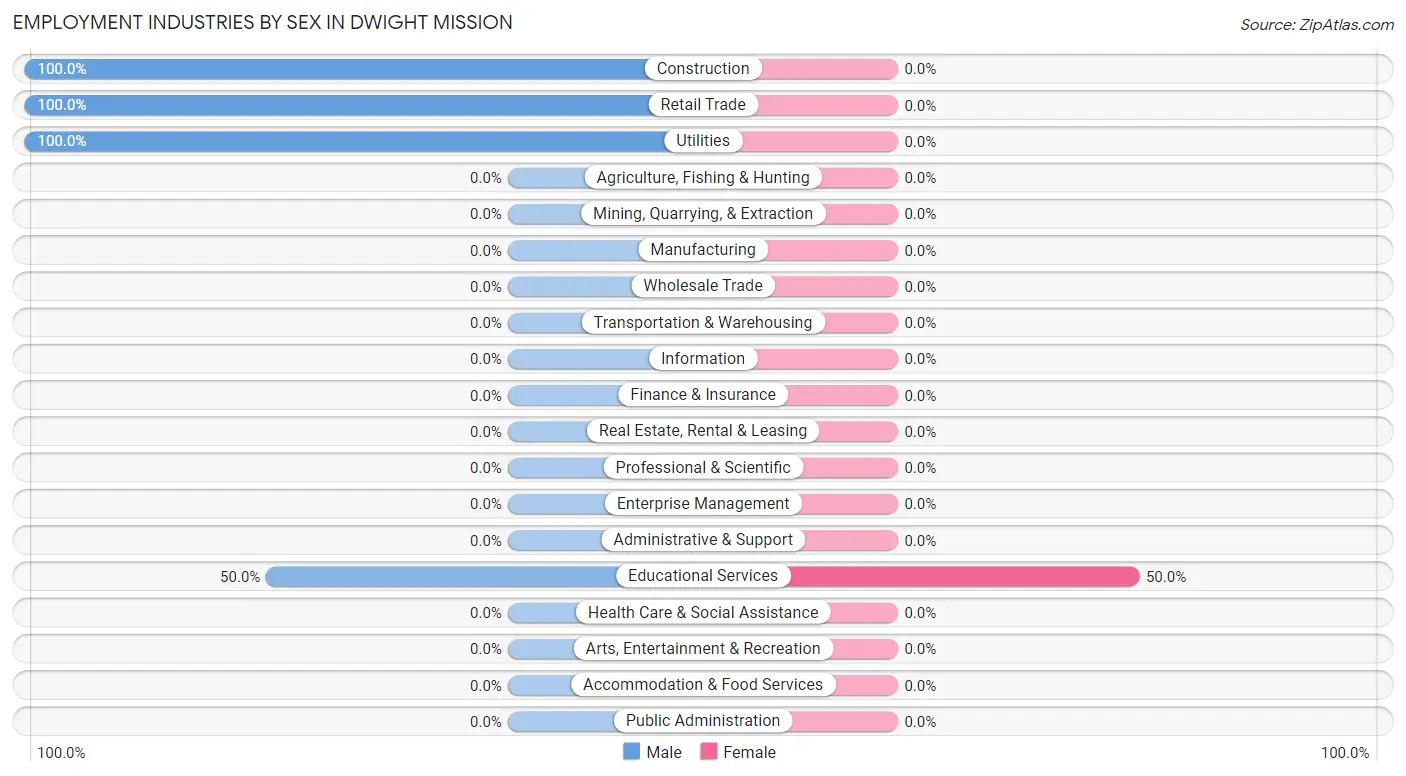
| Industry | Male | Female |
| Agriculture, Fishing & Hunting | 0 (0.0%) | 0 (0.0%) |
| Mining, Quarrying, & Extraction | 0 (0.0%) | 0 (0.0%) |
| Construction | 1 (100.0%) | 0 (0.0%) |
| Manufacturing | 0 (0.0%) | 0 (0.0%) |
| Wholesale Trade | 0 (0.0%) | 0 (0.0%) |
| Retail Trade | 2 (100.0%) | 0 (0.0%) |
| Transportation & Warehousing | 0 (0.0%) | 0 (0.0%) |
| Utilities | 1 (100.0%) | 0 (0.0%) |
| Information | 0 (0.0%) | 0 (0.0%) |
| Finance & Insurance | 0 (0.0%) | 0 (0.0%) |
| Real Estate, Rental & Leasing | 0 (0.0%) | 0 (0.0%) |
| Professional & Scientific | 0 (0.0%) | 0 (0.0%) |
| Enterprise Management | 0 (0.0%) | 0 (0.0%) |
| Administrative & Support | 0 (0.0%) | 0 (0.0%) |
| Educational Services | 1 (50.0%) | 1 (50.0%) |
| Health Care & Social Assistance | 0 (0.0%) | 0 (0.0%) |
| Arts, Entertainment & Recreation | 0 (0.0%) | 0 (0.0%) |
| Accommodation & Food Services | 0 (0.0%) | 0 (0.0%) |
| Public Administration | 0 (0.0%) | 0 (0.0%) |
| Total | 5 (83.3%) | 1 (16.7%) |
Education in Dwight Mission
School Enrollment in Dwight Mission
The most common levels of schooling among the 4 students in Dwight Mission are elementary school (2 | 50.0%), kindergarten (1 | 25.0%), and high school (1 | 25.0%).
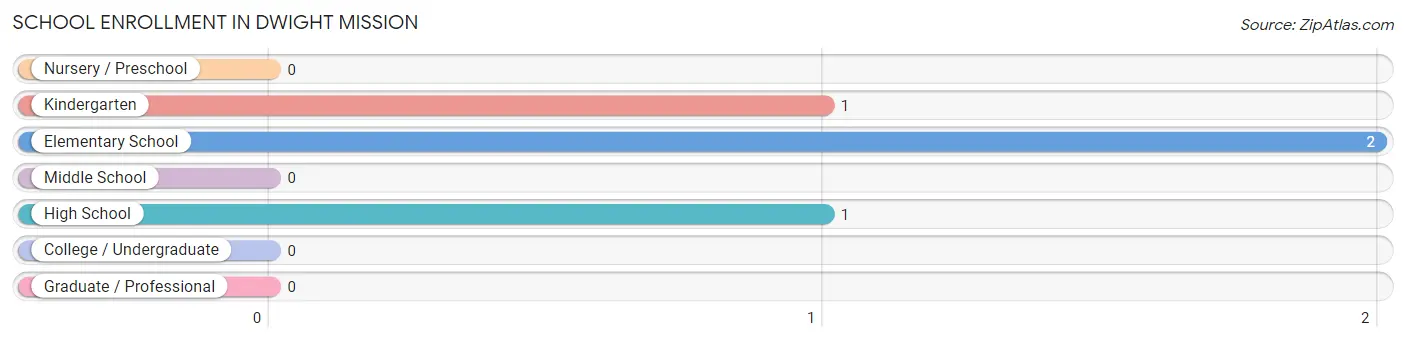
| School Level | # Students | % Students |
| Nursery / Preschool | 0 | 0.0% |
| Kindergarten | 1 | 25.0% |
| Elementary School | 2 | 50.0% |
| Middle School | 0 | 0.0% |
| High School | 1 | 25.0% |
| College / Undergraduate | 0 | 0.0% |
| Graduate / Professional | 0 | 0.0% |
| Total | 4 | 100.0% |
School Enrollment by Age by Funding Source in Dwight Mission
Out of a total of 4 students who are enrolled in schools in Dwight Mission, 3 (75.0%) attend a private institution, while the remaining 1 (25.0%) are enrolled in public schools. The age group of 10 to 14 year olds has the highest likelihood of being enrolled in private schools, with 1 (100.0% in the age bracket) enrolled. Conversely, the age group of 5 to 9 year old has the lowest likelihood of being enrolled in a private school, with 1 (33.3% in the age bracket) attending a public institution.
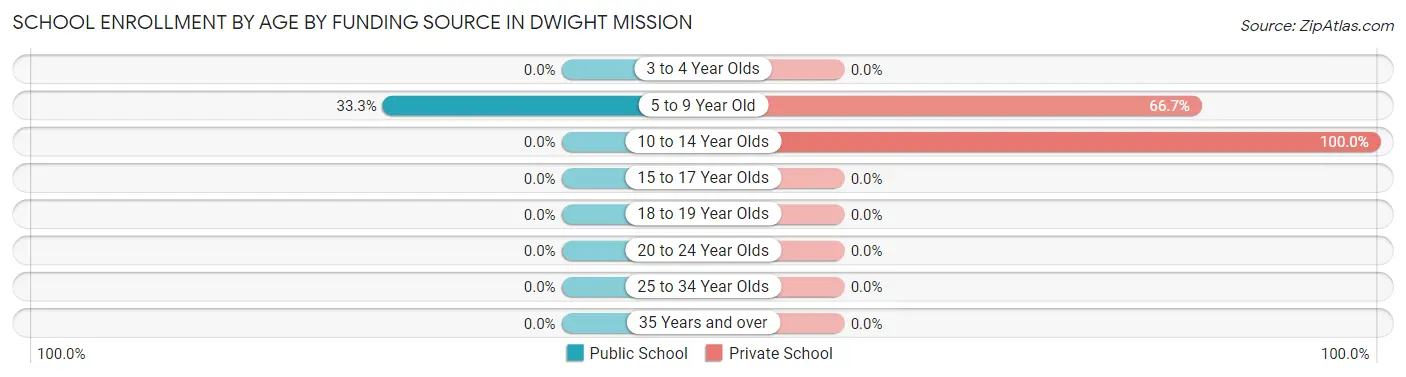
| Age Bracket | Public School | Private School |
| 3 to 4 Year Olds | 0 (0.0%) | 0 (0.0%) |
| 5 to 9 Year Old | 1 (33.3%) | 2 (66.7%) |
| 10 to 14 Year Olds | 0 (0.0%) | 1 (100.0%) |
| 15 to 17 Year Olds | 0 (0.0%) | 0 (0.0%) |
| 18 to 19 Year Olds | 0 (0.0%) | 0 (0.0%) |
| 20 to 24 Year Olds | 0 (0.0%) | 0 (0.0%) |
| 25 to 34 Year Olds | 0 (0.0%) | 0 (0.0%) |
| 35 Years and over | 0 (0.0%) | 0 (0.0%) |
| Total | 1 (25.0%) | 3 (75.0%) |
Educational Attainment by Field of Study in Dwight Mission
, and education (2 | 100.0%) are the most common fields of study among 2 individuals in Dwight Mission who have obtained a bachelor's degree or higher.
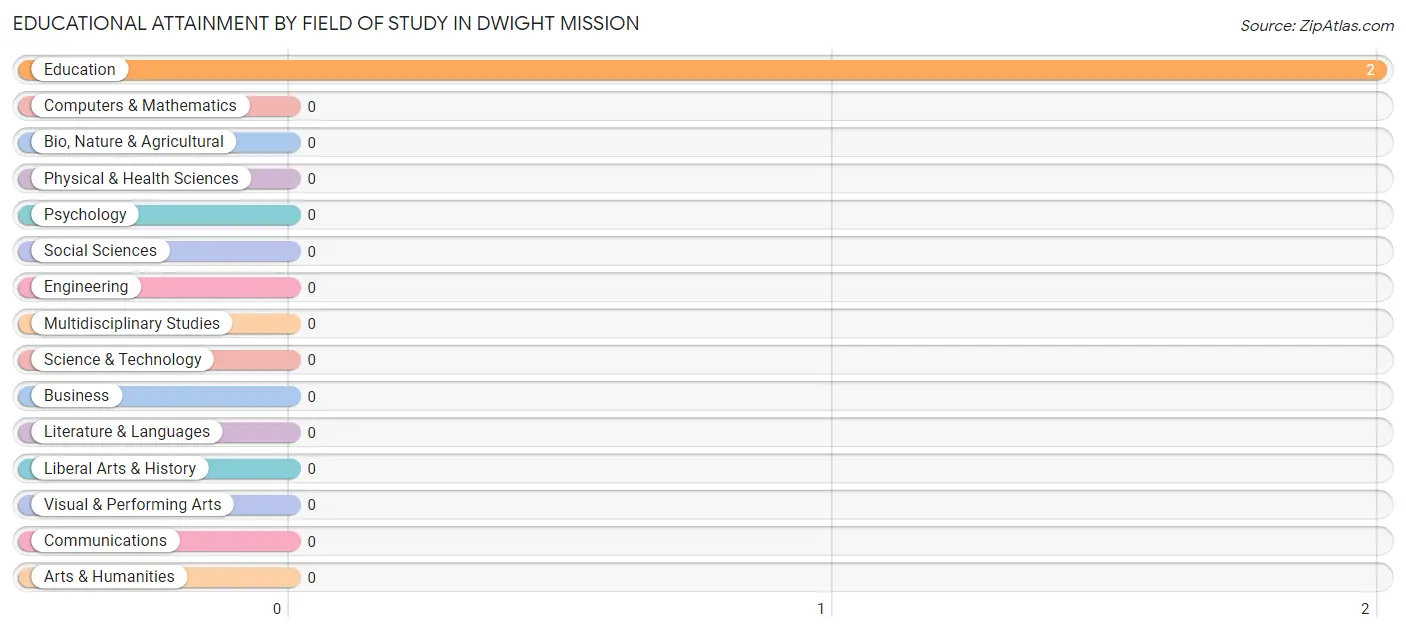
| Field of Study | # Graduates | % Graduates |
| Computers & Mathematics | 0 | 0.0% |
| Bio, Nature & Agricultural | 0 | 0.0% |
| Physical & Health Sciences | 0 | 0.0% |
| Psychology | 0 | 0.0% |
| Social Sciences | 0 | 0.0% |
| Engineering | 0 | 0.0% |
| Multidisciplinary Studies | 0 | 0.0% |
| Science & Technology | 0 | 0.0% |
| Business | 0 | 0.0% |
| Education | 2 | 100.0% |
| Literature & Languages | 0 | 0.0% |
| Liberal Arts & History | 0 | 0.0% |
| Visual & Performing Arts | 0 | 0.0% |
| Communications | 0 | 0.0% |
| Arts & Humanities | 0 | 0.0% |
| Total | 2 | 100.0% |
Transportation & Commute in Dwight Mission
Vehicle Availability by Sex in Dwight Mission
The most prevalent vehicle ownership categories in Dwight Mission are males with 1 vehicle (2, accounting for 40.0%) and females with 1 vehicle (0, making up 200.0%).
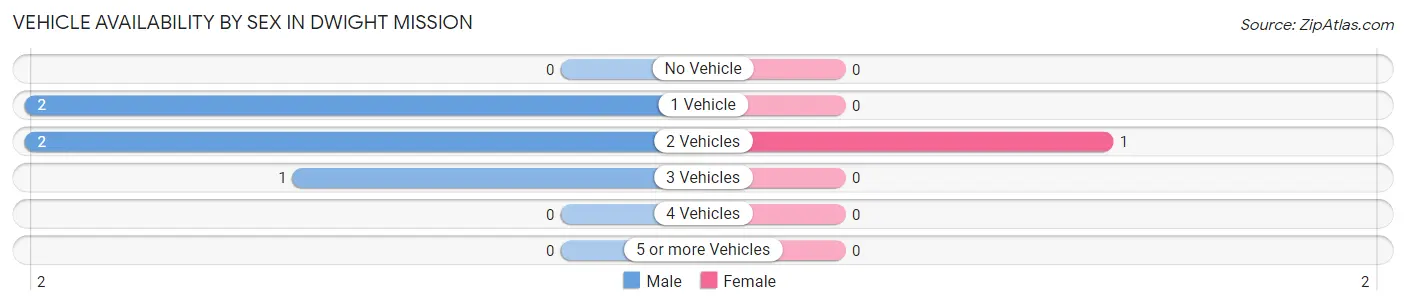
| Vehicles Available | Male | Female |
| No Vehicle | 0 (0.0%) | 0 (0.0%) |
| 1 Vehicle | 2 (40.0%) | 0 (0.0%) |
| 2 Vehicles | 2 (40.0%) | 1 (100.0%) |
| 3 Vehicles | 1 (20.0%) | 0 (0.0%) |
| 4 Vehicles | 0 (0.0%) | 0 (0.0%) |
| 5 or more Vehicles | 0 (0.0%) | 0 (0.0%) |
| Total | 5 (100.0%) | 1 (100.0%) |
Commute Time in Dwight Mission
The most frequently occuring commute durations in Dwight Mission are 20 to 24 minutes (2 commuters, 33.3%), 40 to 44 minutes (2 commuters, 33.3%), and 10 to 14 minutes (1 commuters, 16.7%).
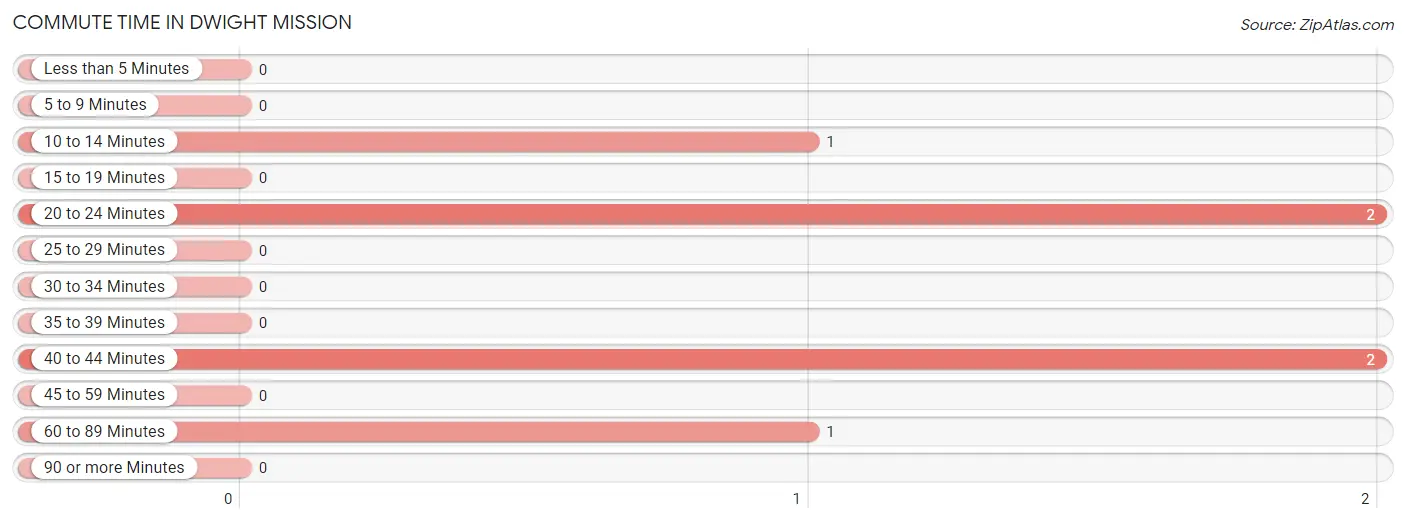
| Commute Time | # Commuters | % Commuters |
| Less than 5 Minutes | 0 | 0.0% |
| 5 to 9 Minutes | 0 | 0.0% |
| 10 to 14 Minutes | 1 | 16.7% |
| 15 to 19 Minutes | 0 | 0.0% |
| 20 to 24 Minutes | 2 | 33.3% |
| 25 to 29 Minutes | 0 | 0.0% |
| 30 to 34 Minutes | 0 | 0.0% |
| 35 to 39 Minutes | 0 | 0.0% |
| 40 to 44 Minutes | 2 | 33.3% |
| 45 to 59 Minutes | 0 | 0.0% |
| 60 to 89 Minutes | 1 | 16.7% |
| 90 or more Minutes | 0 | 0.0% |
Commute Time by Sex in Dwight Mission
The most common commute times in Dwight Mission are 40 to 44 minutes (2 commuters, 40.0%) for males and 20 to 24 minutes (1 commuters, 100.0%) for females.
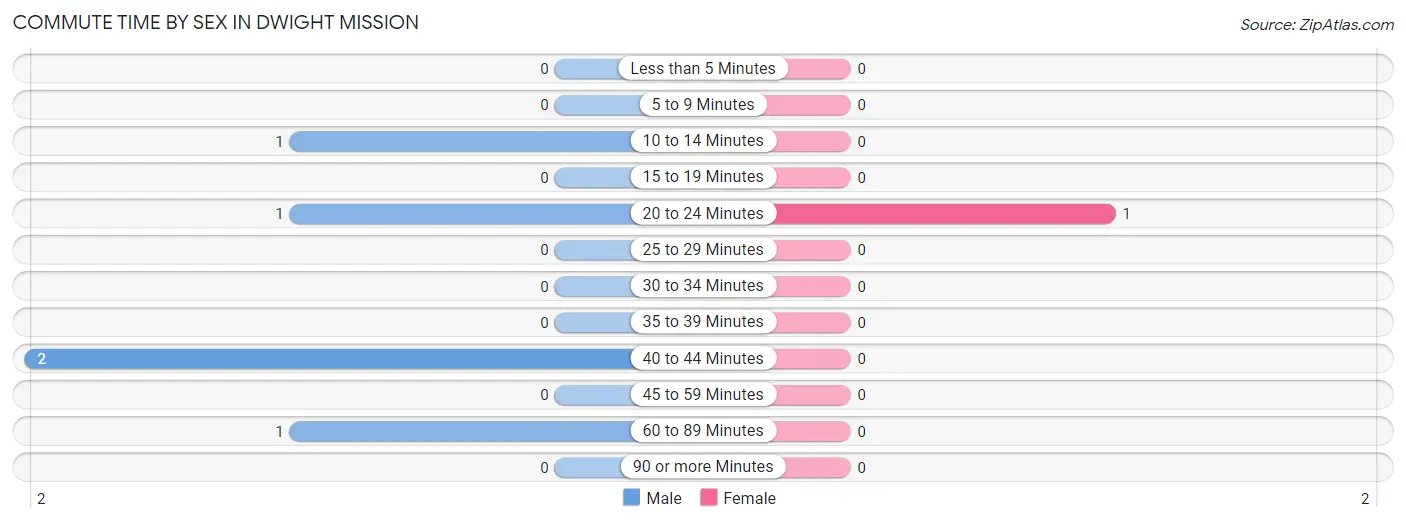
| Commute Time | Male | Female |
| Less than 5 Minutes | 0 (0.0%) | 0 (0.0%) |
| 5 to 9 Minutes | 0 (0.0%) | 0 (0.0%) |
| 10 to 14 Minutes | 1 (20.0%) | 0 (0.0%) |
| 15 to 19 Minutes | 0 (0.0%) | 0 (0.0%) |
| 20 to 24 Minutes | 1 (20.0%) | 1 (100.0%) |
| 25 to 29 Minutes | 0 (0.0%) | 0 (0.0%) |
| 30 to 34 Minutes | 0 (0.0%) | 0 (0.0%) |
| 35 to 39 Minutes | 0 (0.0%) | 0 (0.0%) |
| 40 to 44 Minutes | 2 (40.0%) | 0 (0.0%) |
| 45 to 59 Minutes | 0 (0.0%) | 0 (0.0%) |
| 60 to 89 Minutes | 1 (20.0%) | 0 (0.0%) |
| 90 or more Minutes | 0 (0.0%) | 0 (0.0%) |
Time of Departure to Work by Sex in Dwight Mission
The most frequent times of departure to work in Dwight Mission are 9:00 AM to 9:59 AM (2, 40.0%) for males and 7:00 AM to 7:29 AM (1, 100.0%) for females.
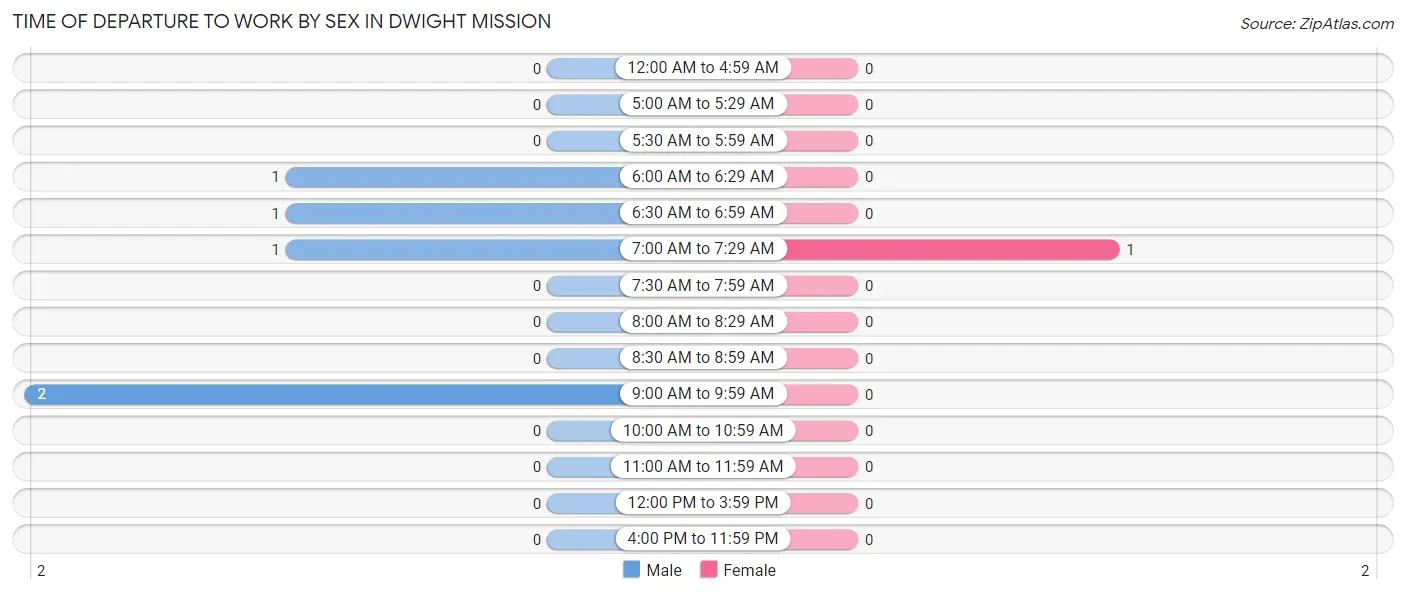
| Time of Departure | Male | Female |
| 12:00 AM to 4:59 AM | 0 (0.0%) | 0 (0.0%) |
| 5:00 AM to 5:29 AM | 0 (0.0%) | 0 (0.0%) |
| 5:30 AM to 5:59 AM | 0 (0.0%) | 0 (0.0%) |
| 6:00 AM to 6:29 AM | 1 (20.0%) | 0 (0.0%) |
| 6:30 AM to 6:59 AM | 1 (20.0%) | 0 (0.0%) |
| 7:00 AM to 7:29 AM | 1 (20.0%) | 1 (100.0%) |
| 7:30 AM to 7:59 AM | 0 (0.0%) | 0 (0.0%) |
| 8:00 AM to 8:29 AM | 0 (0.0%) | 0 (0.0%) |
| 8:30 AM to 8:59 AM | 0 (0.0%) | 0 (0.0%) |
| 9:00 AM to 9:59 AM | 2 (40.0%) | 0 (0.0%) |
| 10:00 AM to 10:59 AM | 0 (0.0%) | 0 (0.0%) |
| 11:00 AM to 11:59 AM | 0 (0.0%) | 0 (0.0%) |
| 12:00 PM to 3:59 PM | 0 (0.0%) | 0 (0.0%) |
| 4:00 PM to 11:59 PM | 0 (0.0%) | 0 (0.0%) |
| Total | 5 (100.0%) | 1 (100.0%) |
Housing Occupancy in Dwight Mission
Occupancy by Ownership in Dwight Mission
Of the total 17 dwellings in Dwight Mission, owner-occupied units account for 14 (82.4%), while renter-occupied units make up 3 (17.6%).
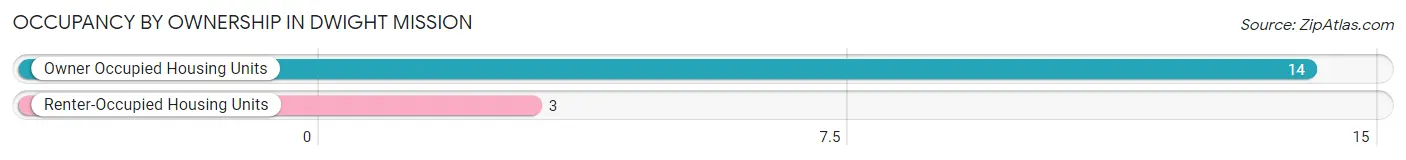
| Occupancy | # Housing Units | % Housing Units |
| Owner Occupied Housing Units | 14 | 82.4% |
| Renter-Occupied Housing Units | 3 | 17.6% |
| Total Occupied Housing Units | 17 | 100.0% |
Occupancy by Household Size in Dwight Mission
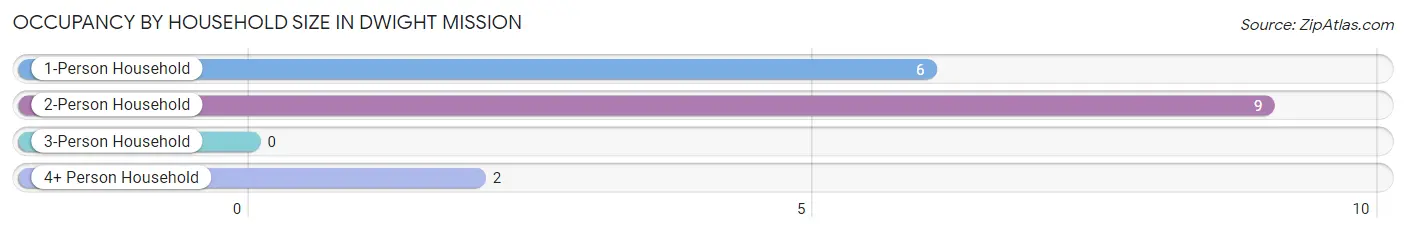
| Household Size | # Housing Units | % Housing Units |
| 1-Person Household | 6 | 35.3% |
| 2-Person Household | 9 | 52.9% |
| 3-Person Household | 0 | 0.0% |
| 4+ Person Household | 2 | 11.8% |
| Total Housing Units | 17 | 100.0% |
Occupancy by Ownership by Household Size in Dwight Mission
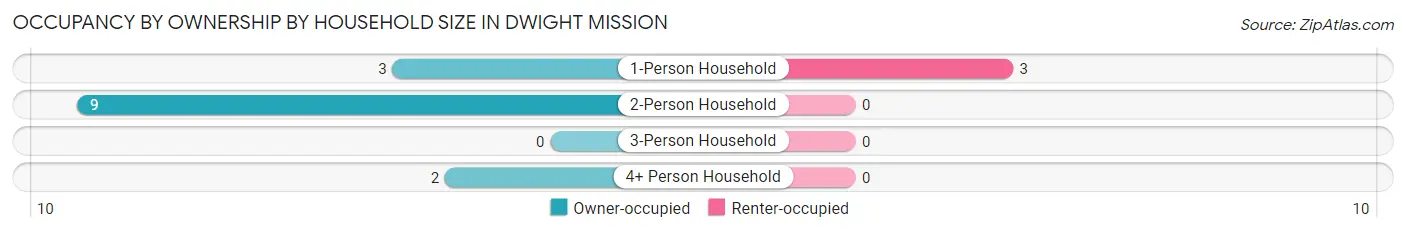
| Household Size | Owner-occupied | Renter-occupied |
| 1-Person Household | 3 (50.0%) | 3 (50.0%) |
| 2-Person Household | 9 (100.0%) | 0 (0.0%) |
| 3-Person Household | 0 (0.0%) | 0 (0.0%) |
| 4+ Person Household | 2 (100.0%) | 0 (0.0%) |
| Total Housing Units | 14 (82.4%) | 3 (17.6%) |
Occupancy by Educational Attainment in Dwight Mission
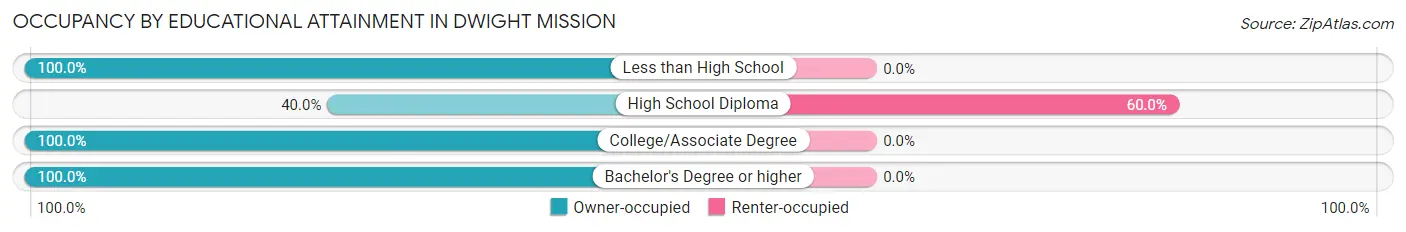
| Household Size | Owner-occupied | Renter-occupied |
| Less than High School | 9 (100.0%) | 0 (0.0%) |
| High School Diploma | 2 (40.0%) | 3 (60.0%) |
| College/Associate Degree | 2 (100.0%) | 0 (0.0%) |
| Bachelor's Degree or higher | 1 (100.0%) | 0 (0.0%) |
Occupancy by Age of Householder in Dwight Mission
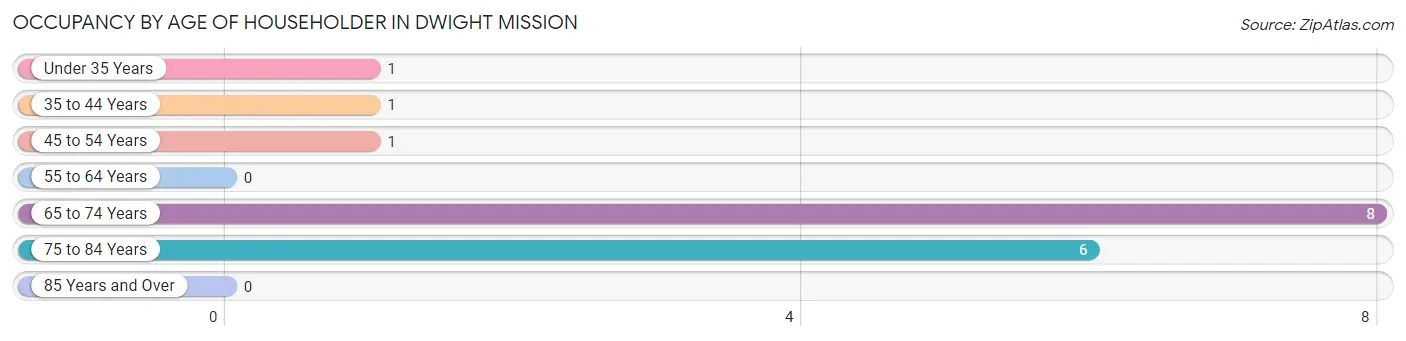
| Age Bracket | # Households | % Households |
| Under 35 Years | 1 | 5.9% |
| 35 to 44 Years | 1 | 5.9% |
| 45 to 54 Years | 1 | 5.9% |
| 55 to 64 Years | 0 | 0.0% |
| 65 to 74 Years | 8 | 47.1% |
| 75 to 84 Years | 6 | 35.3% |
| 85 Years and Over | 0 | 0.0% |
| Total | 17 | 100.0% |
Housing Finances in Dwight Mission
Median Income by Occupancy in Dwight Mission
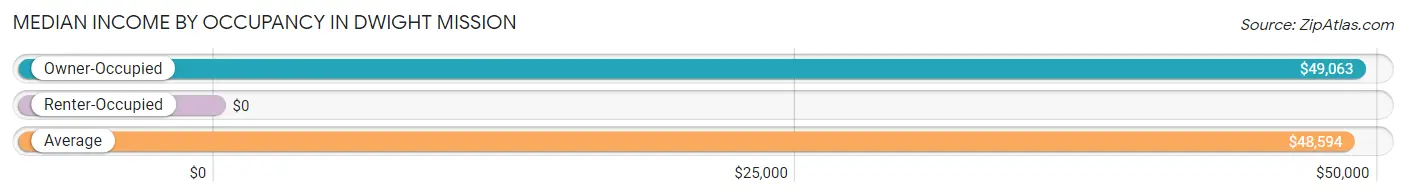
| Occupancy Type | # Households | Median Income |
| Owner-Occupied | 14 (82.4%) | $49,063 |
| Renter-Occupied | 3 (17.6%) | $0 |
| Average | 17 (100.0%) | $48,594 |
Occupancy by Householder Income Bracket in Dwight Mission
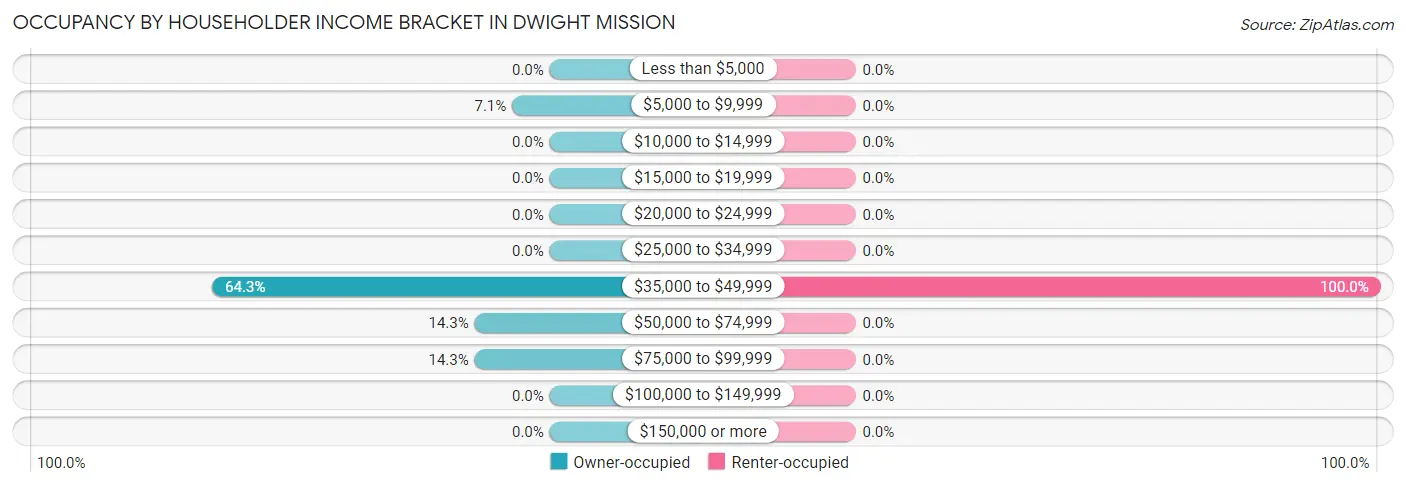
| Income Bracket | Owner-occupied | Renter-occupied |
| Less than $5,000 | 0 (0.0%) | 0 (0.0%) |
| $5,000 to $9,999 | 1 (7.1%) | 0 (0.0%) |
| $10,000 to $14,999 | 0 (0.0%) | 0 (0.0%) |
| $15,000 to $19,999 | 0 (0.0%) | 0 (0.0%) |
| $20,000 to $24,999 | 0 (0.0%) | 0 (0.0%) |
| $25,000 to $34,999 | 0 (0.0%) | 0 (0.0%) |
| $35,000 to $49,999 | 9 (64.3%) | 3 (100.0%) |
| $50,000 to $74,999 | 2 (14.3%) | 0 (0.0%) |
| $75,000 to $99,999 | 2 (14.3%) | 0 (0.0%) |
| $100,000 to $149,999 | 0 (0.0%) | 0 (0.0%) |
| $150,000 or more | 0 (0.0%) | 0 (0.0%) |
| Total | 14 (100.0%) | 3 (100.0%) |
Monthly Housing Cost Tiers in Dwight Mission
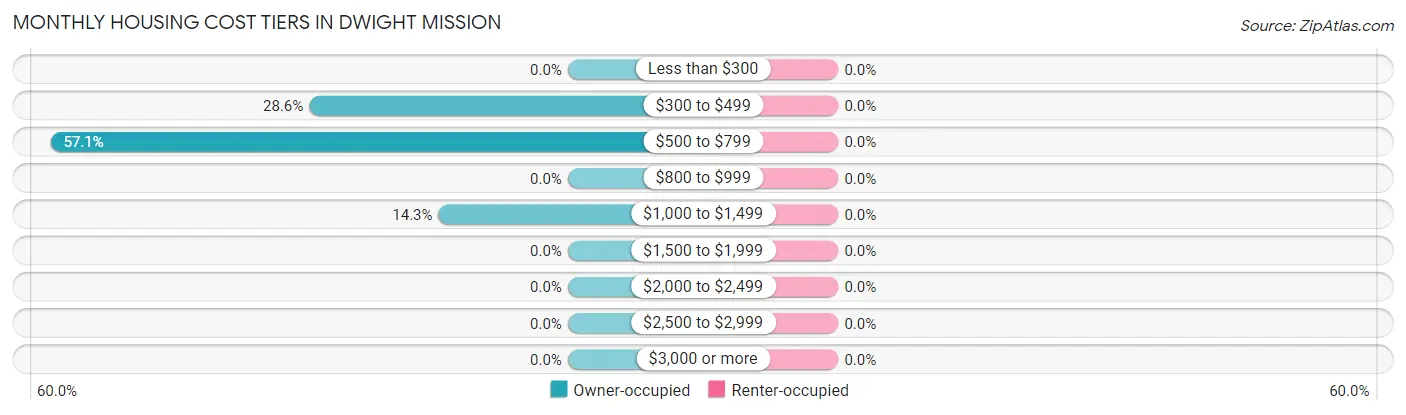
| Monthly Cost | Owner-occupied | Renter-occupied |
| Less than $300 | 0 (0.0%) | 0 (0.0%) |
| $300 to $499 | 4 (28.6%) | 0 (0.0%) |
| $500 to $799 | 8 (57.1%) | 0 (0.0%) |
| $800 to $999 | 0 (0.0%) | 0 (0.0%) |
| $1,000 to $1,499 | 2 (14.3%) | 0 (0.0%) |
| $1,500 to $1,999 | 0 (0.0%) | 0 (0.0%) |
| $2,000 to $2,499 | 0 (0.0%) | 0 (0.0%) |
| $2,500 to $2,999 | 0 (0.0%) | 0 (0.0%) |
| $3,000 or more | 0 (0.0%) | 0 (0.0%) |
| Total | 14 (100.0%) | 3 (100.0%) |
Physical Housing Characteristics in Dwight Mission
Housing Structures in Dwight Mission
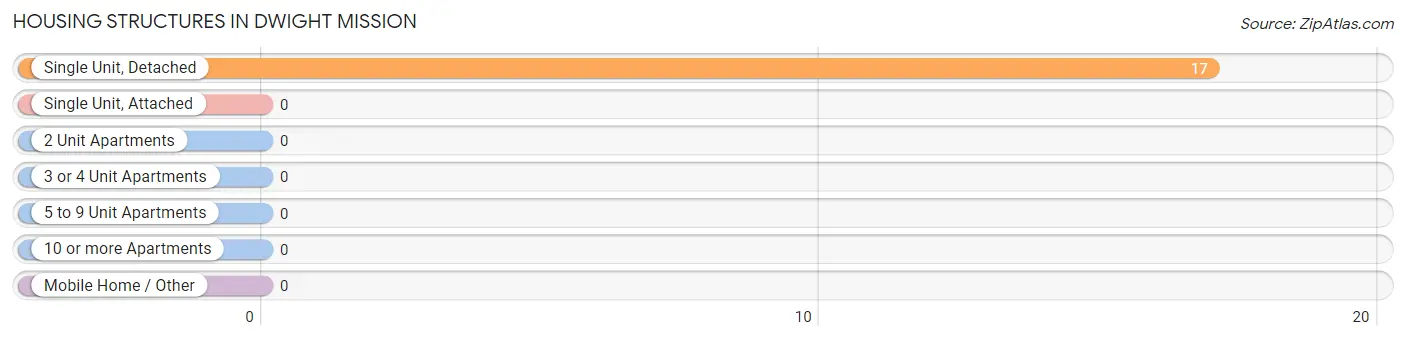
| Structure Type | # Housing Units | % Housing Units |
| Single Unit, Detached | 17 | 100.0% |
| Single Unit, Attached | 0 | 0.0% |
| 2 Unit Apartments | 0 | 0.0% |
| 3 or 4 Unit Apartments | 0 | 0.0% |
| 5 to 9 Unit Apartments | 0 | 0.0% |
| 10 or more Apartments | 0 | 0.0% |
| Mobile Home / Other | 0 | 0.0% |
| Total | 17 | 100.0% |
Housing Structures by Occupancy in Dwight Mission
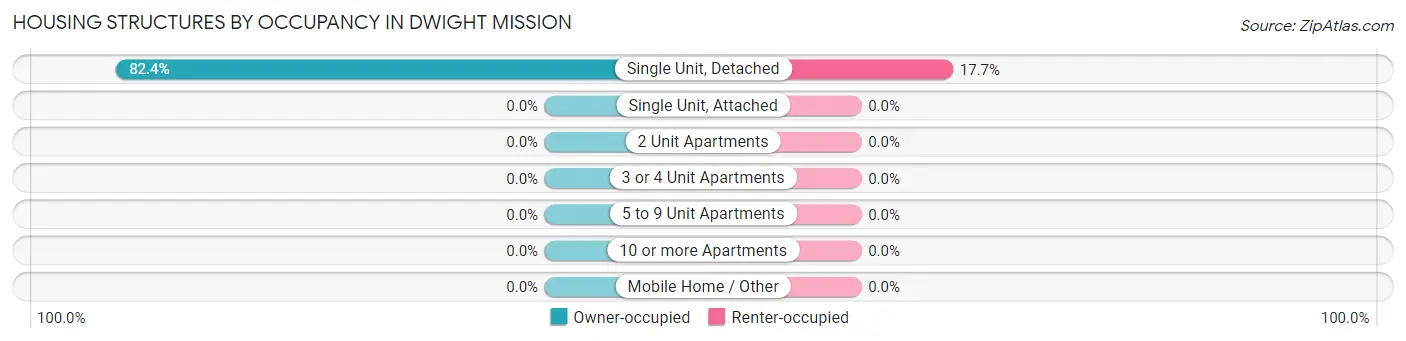
| Structure Type | Owner-occupied | Renter-occupied |
| Single Unit, Detached | 14 (82.4%) | 3 (17.6%) |
| Single Unit, Attached | 0 (0.0%) | 0 (0.0%) |
| 2 Unit Apartments | 0 (0.0%) | 0 (0.0%) |
| 3 or 4 Unit Apartments | 0 (0.0%) | 0 (0.0%) |
| 5 to 9 Unit Apartments | 0 (0.0%) | 0 (0.0%) |
| 10 or more Apartments | 0 (0.0%) | 0 (0.0%) |
| Mobile Home / Other | 0 (0.0%) | 0 (0.0%) |
| Total | 14 (82.4%) | 3 (17.6%) |
Housing Structures by Number of Rooms in Dwight Mission
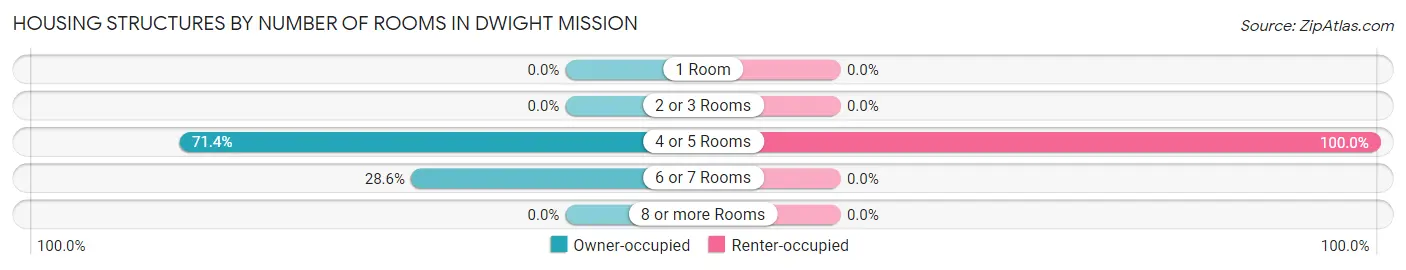
| Number of Rooms | Owner-occupied | Renter-occupied |
| 1 Room | 0 (0.0%) | 0 (0.0%) |
| 2 or 3 Rooms | 0 (0.0%) | 0 (0.0%) |
| 4 or 5 Rooms | 10 (71.4%) | 3 (100.0%) |
| 6 or 7 Rooms | 4 (28.6%) | 0 (0.0%) |
| 8 or more Rooms | 0 (0.0%) | 0 (0.0%) |
| Total | 14 (100.0%) | 3 (100.0%) |
Housing Structure by Heating Type in Dwight Mission
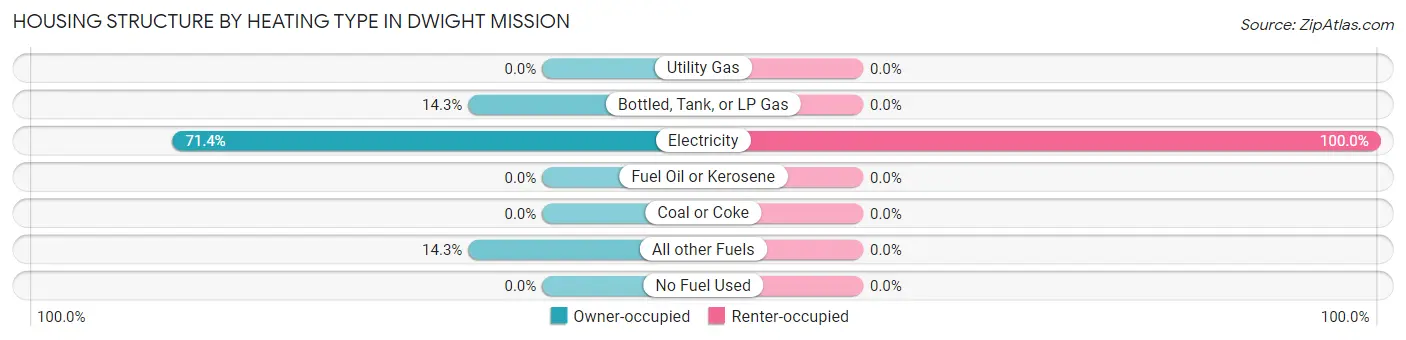
| Heating Type | Owner-occupied | Renter-occupied |
| Utility Gas | 0 (0.0%) | 0 (0.0%) |
| Bottled, Tank, or LP Gas | 2 (14.3%) | 0 (0.0%) |
| Electricity | 10 (71.4%) | 3 (100.0%) |
| Fuel Oil or Kerosene | 0 (0.0%) | 0 (0.0%) |
| Coal or Coke | 0 (0.0%) | 0 (0.0%) |
| All other Fuels | 2 (14.3%) | 0 (0.0%) |
| No Fuel Used | 0 (0.0%) | 0 (0.0%) |
| Total | 14 (100.0%) | 3 (100.0%) |
Household Vehicle Usage in Dwight Mission
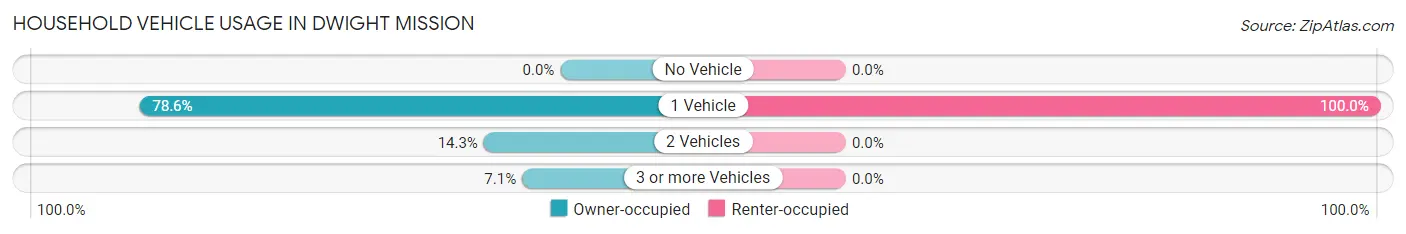
| Vehicles per Household | Owner-occupied | Renter-occupied |
| No Vehicle | 0 (0.0%) | 0 (0.0%) |
| 1 Vehicle | 11 (78.6%) | 3 (100.0%) |
| 2 Vehicles | 2 (14.3%) | 0 (0.0%) |
| 3 or more Vehicles | 1 (7.1%) | 0 (0.0%) |
| Total | 14 (100.0%) | 3 (100.0%) |
Real Estate & Mortgages in Dwight Mission
Real Estate and Mortgage Overview in Dwight Mission
| Characteristic | Without Mortgage | With Mortgage |
| Housing Units | 4 | 10 |
| Median Property Value | $133,300 | $76,300 |
| Median Household Income | $46,250 | $0 |
| Monthly Housing Costs | $333 | $0 |
| Real Estate Taxes | - | - |
Property Value by Mortgage Status in Dwight Mission
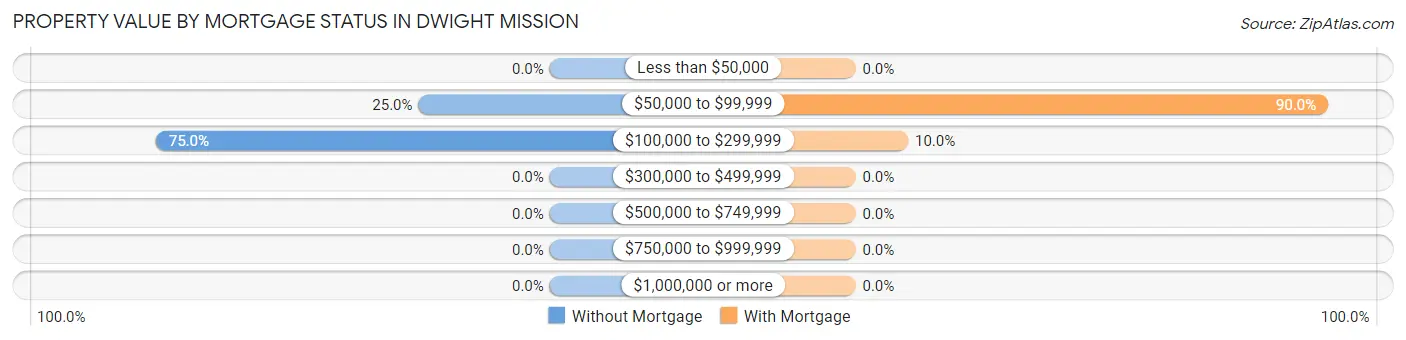
| Property Value | Without Mortgage | With Mortgage |
| Less than $50,000 | 0 (0.0%) | 0 (0.0%) |
| $50,000 to $99,999 | 1 (25.0%) | 9 (90.0%) |
| $100,000 to $299,999 | 3 (75.0%) | 1 (10.0%) |
| $300,000 to $499,999 | 0 (0.0%) | 0 (0.0%) |
| $500,000 to $749,999 | 0 (0.0%) | 0 (0.0%) |
| $750,000 to $999,999 | 0 (0.0%) | 0 (0.0%) |
| $1,000,000 or more | 0 (0.0%) | 0 (0.0%) |
| Total | 4 (100.0%) | 10 (100.0%) |
Household Income by Mortgage Status in Dwight Mission
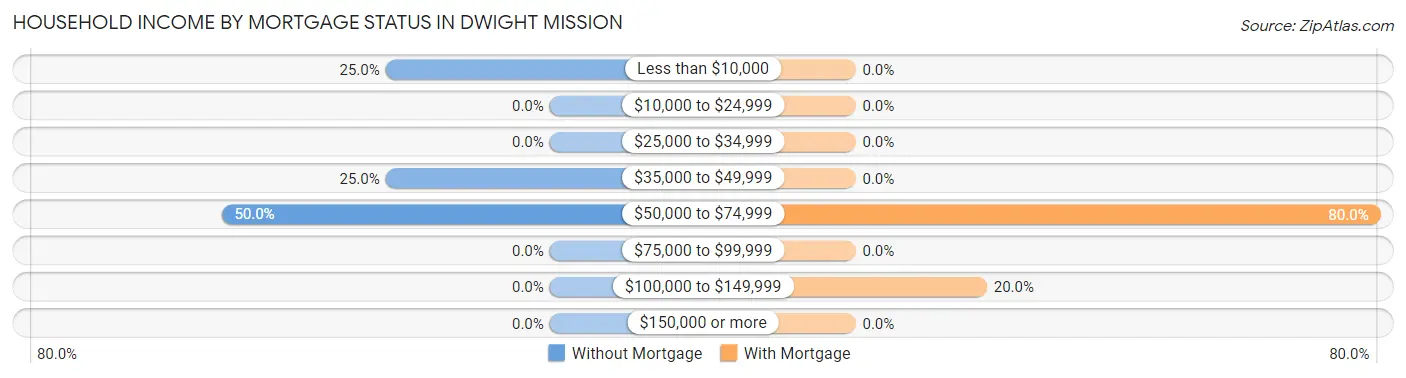
| Household Income | Without Mortgage | With Mortgage |
| Less than $10,000 | 1 (25.0%) | 0 (0.0%) |
| $10,000 to $24,999 | 0 (0.0%) | 0 (0.0%) |
| $25,000 to $34,999 | 0 (0.0%) | 0 (0.0%) |
| $35,000 to $49,999 | 1 (25.0%) | 0 (0.0%) |
| $50,000 to $74,999 | 2 (50.0%) | 8 (80.0%) |
| $75,000 to $99,999 | 0 (0.0%) | 0 (0.0%) |
| $100,000 to $149,999 | 0 (0.0%) | 2 (20.0%) |
| $150,000 or more | 0 (0.0%) | 0 (0.0%) |
| Total | 4 (100.0%) | 10 (100.0%) |
Property Value to Household Income Ratio in Dwight Mission
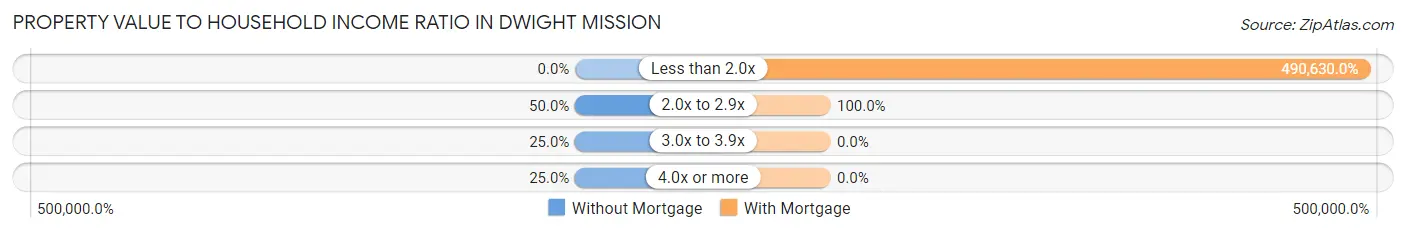
| Value-to-Income Ratio | Without Mortgage | With Mortgage |
| Less than 2.0x | 0 (0.0%) | 49,063 (490,630.0%) |
| 2.0x to 2.9x | 2 (50.0%) | 10 (100.0%) |
| 3.0x to 3.9x | 1 (25.0%) | 0 (0.0%) |
| 4.0x or more | 1 (25.0%) | 0 (0.0%) |
| Total | 4 (100.0%) | 10 (100.0%) |
Real Estate Taxes by Mortgage Status in Dwight Mission
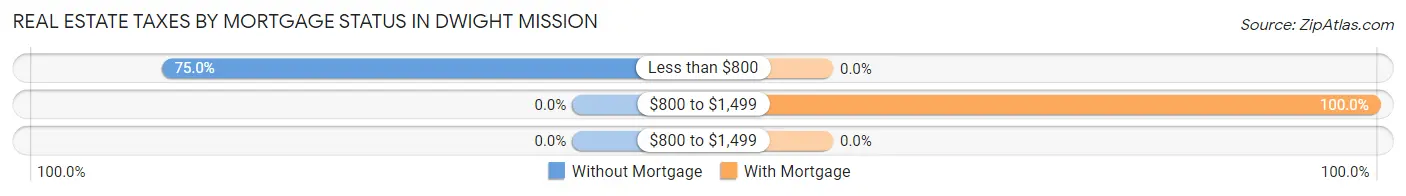
| Property Taxes | Without Mortgage | With Mortgage |
| Less than $800 | 3 (75.0%) | 0 (0.0%) |
| $800 to $1,499 | 0 (0.0%) | 10 (100.0%) |
| $800 to $1,499 | 0 (0.0%) | 0 (0.0%) |
| Total | 4 (100.0%) | 10 (100.0%) |
Health & Disability in Dwight Mission
Health Insurance Coverage by Age in Dwight Mission
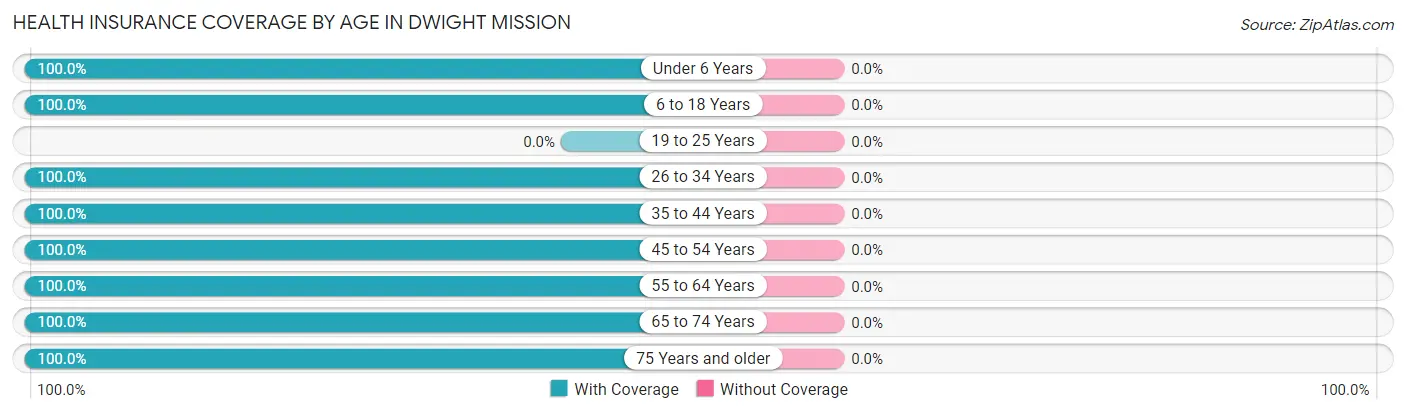
| Age Bracket | With Coverage | Without Coverage |
| Under 6 Years | 2 (100.0%) | 0 (0.0%) |
| 6 to 18 Years | 3 (100.0%) | 0 (0.0%) |
| 19 to 25 Years | 0 (0.0%) | 0 (0.0%) |
| 26 to 34 Years | 2 (100.0%) | 0 (0.0%) |
| 35 to 44 Years | 2 (100.0%) | 0 (0.0%) |
| 45 to 54 Years | 1 (100.0%) | 0 (0.0%) |
| 55 to 64 Years | 1 (100.0%) | 0 (0.0%) |
| 65 to 74 Years | 18 (100.0%) | 0 (0.0%) |
| 75 Years and older | 6 (100.0%) | 0 (0.0%) |
| Total | 35 (100.0%) | 0 (0.0%) |
Health Insurance Coverage by Citizenship Status in Dwight Mission
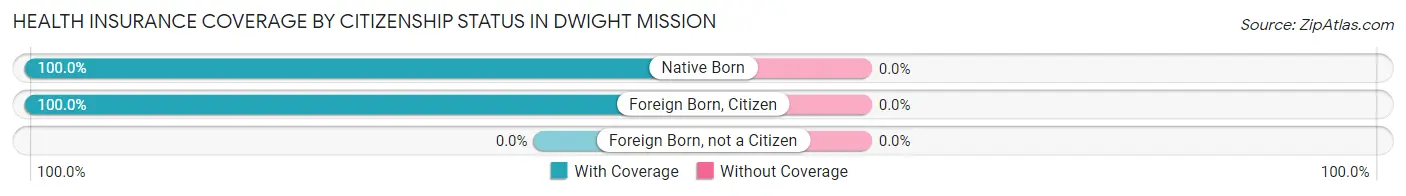
| Citizenship Status | With Coverage | Without Coverage |
| Native Born | 2 (100.0%) | 0 (0.0%) |
| Foreign Born, Citizen | 3 (100.0%) | 0 (0.0%) |
| Foreign Born, not a Citizen | 0 (0.0%) | 0 (0.0%) |
Health Insurance Coverage by Household Income in Dwight Mission
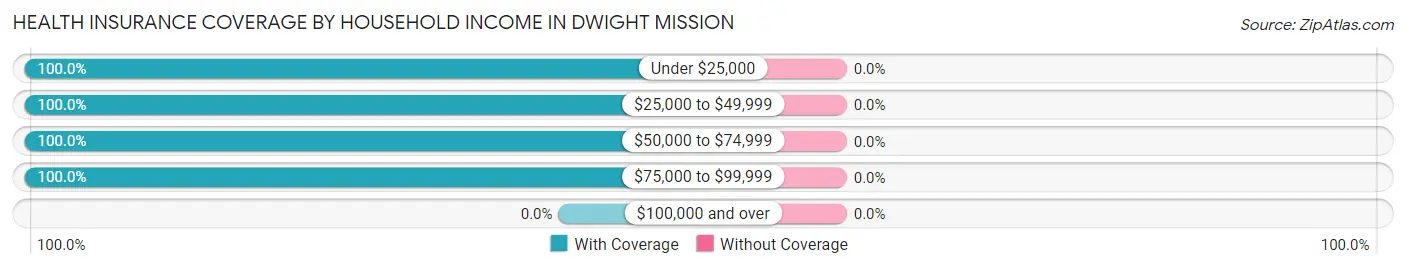
| Household Income | With Coverage | Without Coverage |
| Under $25,000 | 1 (100.0%) | 0 (0.0%) |
| $25,000 to $49,999 | 23 (100.0%) | 0 (0.0%) |
| $50,000 to $74,999 | 2 (100.0%) | 0 (0.0%) |
| $75,000 to $99,999 | 9 (100.0%) | 0 (0.0%) |
| $100,000 and over | 0 (0.0%) | 0 (0.0%) |
Public vs Private Health Insurance Coverage by Age in Dwight Mission
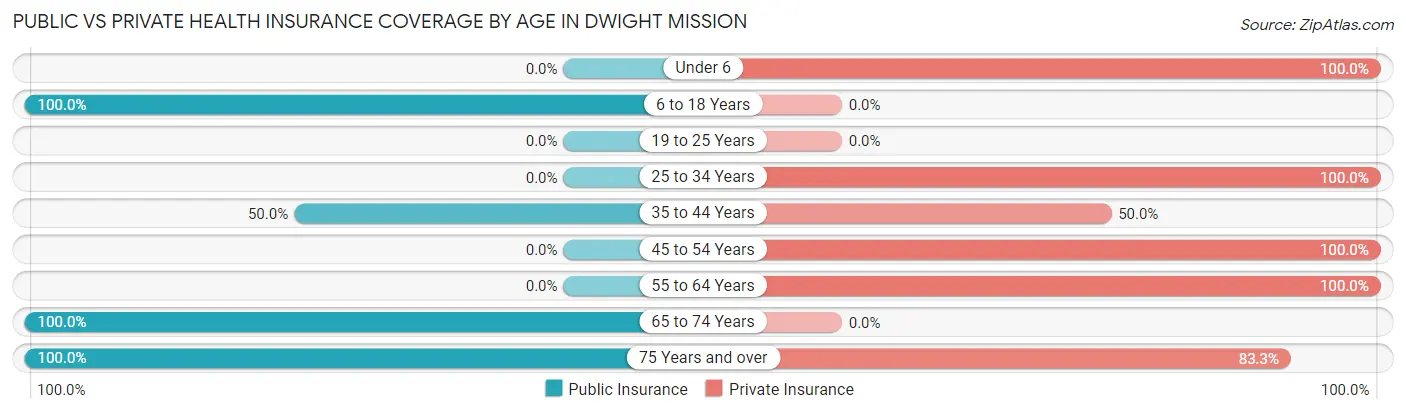
| Age Bracket | Public Insurance | Private Insurance |
| Under 6 | 0 (0.0%) | 2 (100.0%) |
| 6 to 18 Years | 3 (100.0%) | 0 (0.0%) |
| 19 to 25 Years | 0 (0.0%) | 0 (0.0%) |
| 25 to 34 Years | 0 (0.0%) | 2 (100.0%) |
| 35 to 44 Years | 1 (50.0%) | 1 (50.0%) |
| 45 to 54 Years | 0 (0.0%) | 1 (100.0%) |
| 55 to 64 Years | 0 (0.0%) | 1 (100.0%) |
| 65 to 74 Years | 18 (100.0%) | 0 (0.0%) |
| 75 Years and over | 6 (100.0%) | 5 (83.3%) |
| Total | 28 (80.0%) | 12 (34.3%) |
Disability Status by Sex by Age in Dwight Mission
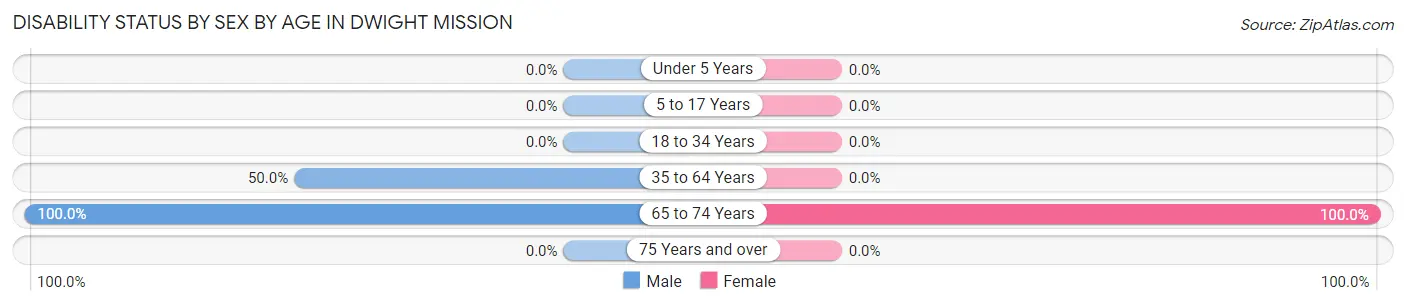
| Age Bracket | Male | Female |
| Under 5 Years | 0 (0.0%) | 0 (0.0%) |
| 5 to 17 Years | 0 (0.0%) | 0 (0.0%) |
| 18 to 34 Years | 0 (0.0%) | 0 (0.0%) |
| 35 to 64 Years | 1 (50.0%) | 0 (0.0%) |
| 65 to 74 Years | 8 (100.0%) | 10 (100.0%) |
| 75 Years and over | 0 (0.0%) | 0 (0.0%) |
Disability Class by Sex by Age in Dwight Mission
Disability Class: Hearing Difficulty
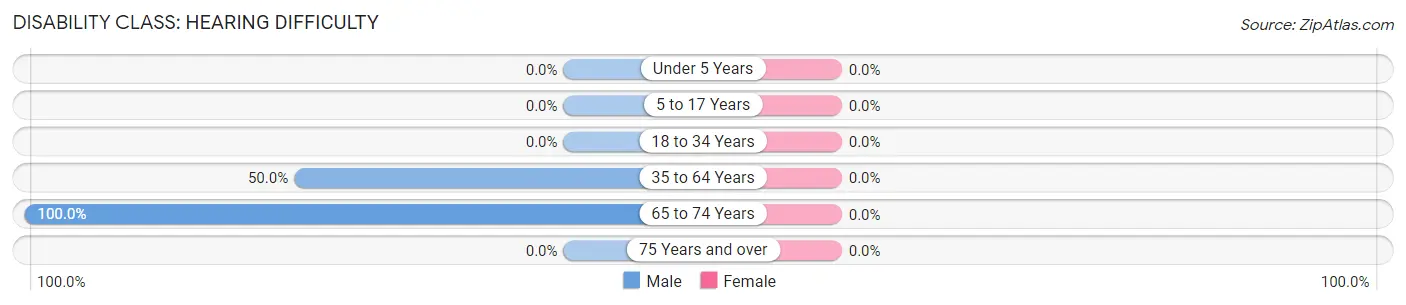
| Age Bracket | Male | Female |
| Under 5 Years | 0 (0.0%) | 0 (0.0%) |
| 5 to 17 Years | 0 (0.0%) | 0 (0.0%) |
| 18 to 34 Years | 0 (0.0%) | 0 (0.0%) |
| 35 to 64 Years | 1 (50.0%) | 0 (0.0%) |
| 65 to 74 Years | 8 (100.0%) | 0 (0.0%) |
| 75 Years and over | 0 (0.0%) | 0 (0.0%) |
Disability Class: Vision Difficulty
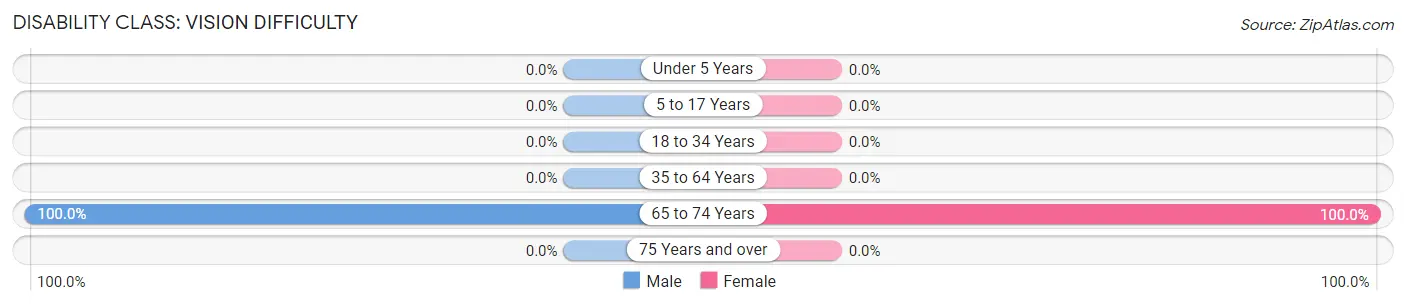
| Age Bracket | Male | Female |
| Under 5 Years | 0 (0.0%) | 0 (0.0%) |
| 5 to 17 Years | 0 (0.0%) | 0 (0.0%) |
| 18 to 34 Years | 0 (0.0%) | 0 (0.0%) |
| 35 to 64 Years | 0 (0.0%) | 0 (0.0%) |
| 65 to 74 Years | 8 (100.0%) | 10 (100.0%) |
| 75 Years and over | 0 (0.0%) | 0 (0.0%) |
Disability Class: Cognitive Difficulty
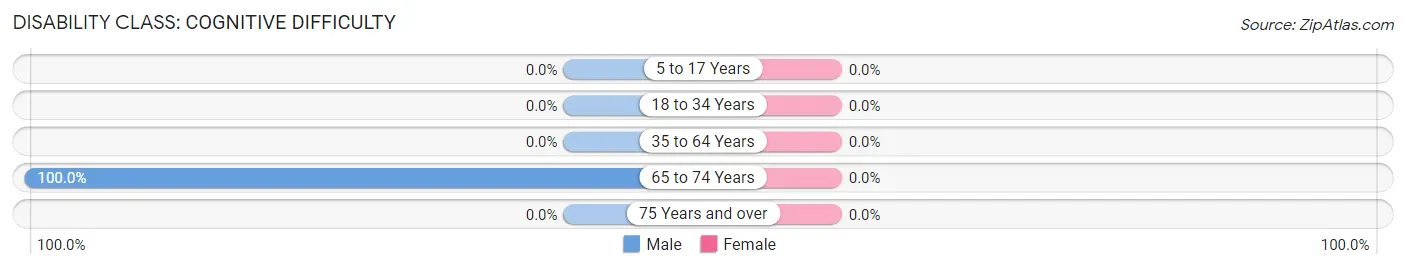
| Age Bracket | Male | Female |
| 5 to 17 Years | 0 (0.0%) | 0 (0.0%) |
| 18 to 34 Years | 0 (0.0%) | 0 (0.0%) |
| 35 to 64 Years | 0 (0.0%) | 0 (0.0%) |
| 65 to 74 Years | 8 (100.0%) | 0 (0.0%) |
| 75 Years and over | 0 (0.0%) | 0 (0.0%) |
Disability Class: Ambulatory Difficulty
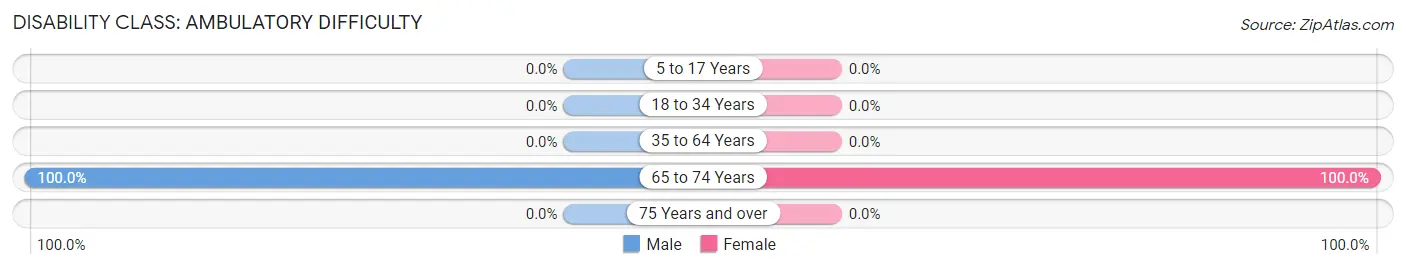
| Age Bracket | Male | Female |
| 5 to 17 Years | 0 (0.0%) | 0 (0.0%) |
| 18 to 34 Years | 0 (0.0%) | 0 (0.0%) |
| 35 to 64 Years | 0 (0.0%) | 0 (0.0%) |
| 65 to 74 Years | 8 (100.0%) | 10 (100.0%) |
| 75 Years and over | 0 (0.0%) | 0 (0.0%) |
Disability Class: Self-Care Difficulty
| Age Bracket | Male | Female |
| 5 to 17 Years | 0 (0.0%) | 0 (0.0%) |
| 18 to 34 Years | 0 (0.0%) | 0 (0.0%) |
| 35 to 64 Years | 0 (0.0%) | 0 (0.0%) |
| 65 to 74 Years | 0 (0.0%) | 0 (0.0%) |
| 75 Years and over | 0 (0.0%) | 0 (0.0%) |
Technology Access in Dwight Mission
Computing Device Access in Dwight Mission
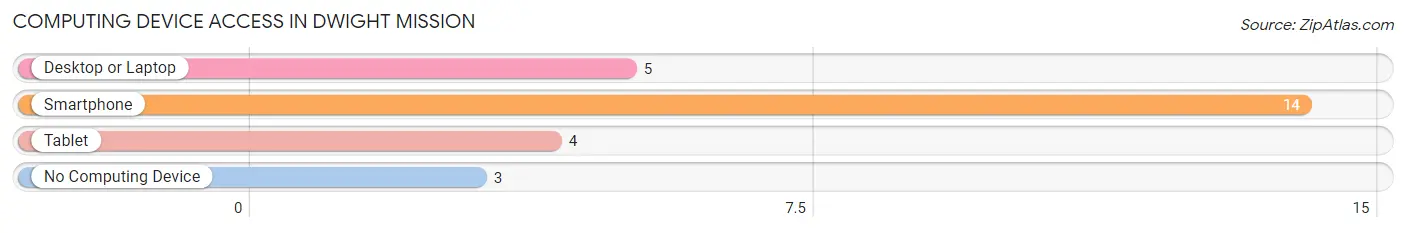
| Device Type | # Households | % Households |
| Desktop or Laptop | 5 | 29.4% |
| Smartphone | 14 | 82.4% |
| Tablet | 4 | 23.5% |
| No Computing Device | 3 | 17.6% |
| Total | 17 | 100.0% |
Internet Access in Dwight Mission
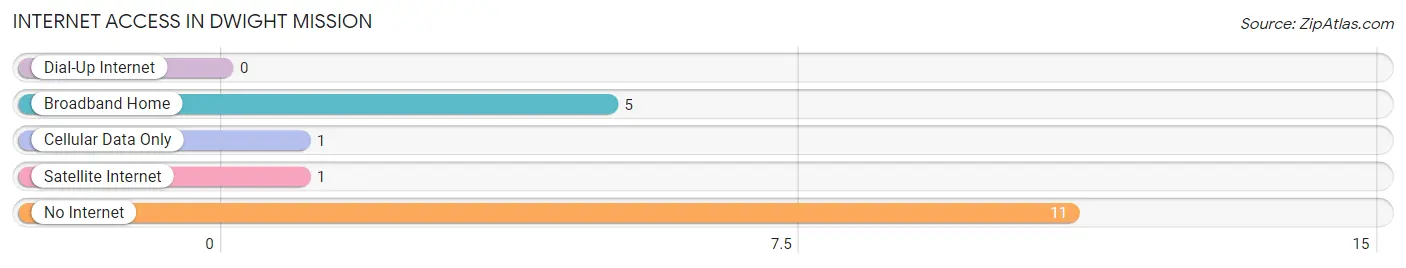
| Internet Type | # Households | % Households |
| Dial-Up Internet | 0 | 0.0% |
| Broadband Home | 5 | 29.4% |
| Cellular Data Only | 1 | 5.9% |
| Satellite Internet | 1 | 5.9% |
| No Internet | 11 | 64.7% |
| Total | 17 | 100.0% |
Dwight Mission Summary
Dwight Mission is a small unincorporated community located in Sequoyah County, Oklahoma. It is situated on the banks of the Arkansas River, approximately 10 miles south of Sallisaw. The community was established in 1820 by the Reverend Dwight Mission, a missionary of the American Board of Commissioners for Foreign Missions. The mission was established to serve the Cherokee Nation, which had been relocated to the area from their ancestral homelands in the southeastern United States.
History
The Dwight Mission was established in 1820 by the Reverend Dwight Mission, a missionary of the American Board of Commissioners for Foreign Missions. The mission was established to serve the Cherokee Nation, which had been relocated to the area from their ancestral homelands in the southeastern United States. The mission was initially located on the banks of the Arkansas River, but was later moved to its current location on the banks of the Illinois River. The mission was a success, and by 1824 it had grown to include a school, a church, and a trading post.
The mission was abandoned in 1829, when the Cherokee Nation was forcibly removed from the area by the United States government. The mission was re-established in 1836, and continued to serve the Cherokee Nation until the Civil War. During the war, the mission was used as a refuge for Cherokee families fleeing the violence of the conflict. After the war, the mission was abandoned once again, and the community of Dwight Mission was established in its place.
Geography
Dwight Mission is located in Sequoyah County, Oklahoma, approximately 10 miles south of Sallisaw. The community is situated on the banks of the Arkansas River, and is surrounded by rolling hills and wooded areas. The climate in the area is temperate, with hot summers and mild winters.
Economy
The economy of Dwight Mission is largely based on agriculture and tourism. The area is home to several farms, which produce a variety of crops, including corn, soybeans, and wheat. The area is also popular with tourists, who come to enjoy the area's natural beauty and to visit the historic Dwight Mission.
Demographics
As of the 2010 census, the population of Dwight Mission was 1,072. The racial makeup of the community was 95.3% White, 0.7% African American, 0.7% Native American, 0.2% Asian, 0.1% Pacific Islander, and 2.1% from other races. The median household income was $30,938, and the median family income was $35,625. The per capita income was $14,945.
Conclusion
Dwight Mission is a small unincorporated community located in Sequoyah County, Oklahoma. It was established in 1820 by the Reverend Dwight Mission, a missionary of the American Board of Commissioners for Foreign Missions. The mission was established to serve the Cherokee Nation, which had been relocated to the area from their ancestral homelands in the southeastern United States. The economy of Dwight Mission is largely based on agriculture and tourism, and the population of the community was 1,072 as of the 2010 census.
Common Questions
What is the Total Population of Dwight Mission?
Total Population of Dwight Mission is 35.
What is the Total Male Population of Dwight Mission?
Total Male Population of Dwight Mission is 15.
What is the Total Female Population of Dwight Mission?
Total Female Population of Dwight Mission is 20.
What is the Ratio of Males per 100 Females in Dwight Mission?
There are 75.00 Males per 100 Females in Dwight Mission.
What is the Ratio of Females per 100 Males in Dwight Mission?
There are 133.33 Females per 100 Males in Dwight Mission.
What is the Median Population Age in Dwight Mission?
Median Population Age in Dwight Mission is 65.7 Years.
What is the Average Family Size in Dwight Mission
Average Family Size in Dwight Mission is 2.6 People.
What is the Average Household Size in Dwight Mission
Average Household Size in Dwight Mission is 2.1 People.
What is Per Capita Income in Dwight Mission?
Per Capita income in Dwight Mission is $25,171.
What is the Median Family Income in Dwight Mission?
Median Family Income in Dwight Mission is $48,906.
What is the Median Household income in Dwight Mission?
Median Household Income in Dwight Mission is $48,594.
What is Inequality or Gini Index in Dwight Mission?
Inequality or Gini Index in Dwight Mission is 0.15.
How Large is the Labor Force in Dwight Mission?
There are 6 People in the Labor Forcein in Dwight Mission.
What is the Percentage of People in the Labor Force in Dwight Mission?
20.0% of People are in the Labor Force in Dwight Mission.