Zip Codes with the Highest Percentage of Population with a Degree in Communications in Dayton, OH

RELATED REPORTS & OPTIONS

Communications
Population
Families and Households
Female Fertility
Female Fertility (Unmarried)
Race (Community Size)
Race (Percentage)
Ancestry (Community Size)
AfricanAlbanianAlsatianAmericanApacheArabArgentineanArmenianAustralianAustrianBasqueBelgianBhutaneseBlackfeetBolivianBrazilianBritishBulgarianBurmeseCajunCanadianCape VerdeanCelticCentral AmericanCentral American IndianCherokeeChileanChippewaChoctawColombianCosta RicanCreekCroatianCubanCzechCzechoslovakianDanishDominicanDutchEastern EuropeanEcuadorianEgyptianEnglishEstonianEthiopianEuropeanFilipinoFinnishFrenchFrench CanadianGermanGhanaianGreekGuamanian / ChamorroGuatemalanHaitianHonduranHungarianIcelanderIndian (Asian)InupiatIranianIraqiIrishIroquoisItalianJamaicanJapaneseKenyanKoreanLaotianLatvianLebaneseLiberianLithuanianLuxembourgerMacedonianMalteseMexicanMexican American IndianMoroccanNative HawaiianNavajoNicaraguanNigerianNorthern EuropeanNorwegianOkinawanPakistaniPalestinianPanamanianPennsylvania GermanPeruvianPolishPortuguesePotawatomiPuerto RicanRomanianRussianSalvadoranSamoanScandinavianScotch-IrishScottishSeminoleSenegaleseSerbianSiouxSlavicSlovakSloveneSouth AfricanSouth AmericanSpaniardSpanishSri LankanSubsaharan AfricanSudaneseSwedishSwissSyrianThaiTrinidadian and TobagonianTurkishUkrainianVenezuelanWelshWest IndianYugoslavian
Ancestry (Percentage)
AfricanAlbanianAlsatianAmericanApacheArabArgentineanArmenianAustralianAustrianBasqueBelgianBhutaneseBlackfeetBolivianBrazilianBritishBulgarianBurmeseCajunCanadianCape VerdeanCelticCentral AmericanCentral American IndianCherokeeChileanChippewaChoctawColombianCosta RicanCreekCroatianCubanCzechCzechoslovakianDanishDominicanDutchEastern EuropeanEcuadorianEgyptianEnglishEstonianEthiopianEuropeanFilipinoFinnishFrenchFrench CanadianGermanGhanaianGreekGuamanian / ChamorroGuatemalanHaitianHonduranHungarianIcelanderIndian (Asian)InupiatIranianIraqiIrishIroquoisItalianJamaicanJapaneseKenyanKoreanLaotianLatvianLebaneseLiberianLithuanianLuxembourgerMacedonianMalteseMexicanMexican American IndianMoroccanNative HawaiianNavajoNicaraguanNigerianNorthern EuropeanNorwegianOkinawanPakistaniPalestinianPanamanianPennsylvania GermanPeruvianPolishPortuguesePotawatomiPuerto RicanRomanianRussianSalvadoranSamoanScandinavianScotch-IrishScottishSeminoleSenegaleseSerbianSiouxSlavicSlovakSloveneSouth AfricanSouth AmericanSpaniardSpanishSri LankanSubsaharan AfricanSudaneseSwedishSwissSyrianThaiTrinidadian and TobagonianTurkishUkrainianVenezuelanWelshWest IndianYugoslavian
Immigrant Origin (Total)
AfricaArgentinaAsiaAustraliaBelarusBosnia and HerzegovinaBrazilBulgariaCambodiaCameroonCanadaCaribbeanCentral AmericaChinaColombiaCongoCosta RicaCubaDominican RepublicEastern AfricaEastern AsiaEastern EuropeEcuadorEgyptEl SalvadorEnglandEthiopiaEuropeFranceGermanyGhanaGreeceGuatemalaGuyanaHaitiHondurasHong KongHungaryIndiaIndonesiaIranIraqIrelandIsraelItalyJamaicaJapanJordanKenyaKoreaKuwaitLatin AmericaLebanonLiberiaMalaysiaMexicoMiddle AfricaMoldovaMoroccoNetherlandsNigeriaNorthern AfricaNorthern EuropeNorwayOceaniaPakistanPanamaPeruPhilippinesPolandPortugalRomaniaRussiaSaudi ArabiaScotlandSenegalSingaporeSouth AfricaSouth AmericaSouth Central AsiaSouth Eastern AsiaSouthern EuropeSpainSudanTaiwanThailandTrinidad and TobagoTurkeyUkraineUzbekistanVenezuelaVietnamWestern AfricaWestern AsiaWestern EuropeZaire
Immigrant Origin (Percentage)
AfricaArgentinaAsiaAustraliaBelarusBosnia and HerzegovinaBrazilBulgariaCambodiaCameroonCanadaCaribbeanCentral AmericaChinaColombiaCongoCosta RicaCubaDominican RepublicEastern AfricaEastern AsiaEastern EuropeEcuadorEgyptEl SalvadorEnglandEthiopiaEuropeFranceGermanyGhanaGreeceGuatemalaGuyanaHaitiHondurasHong KongHungaryIndiaIndonesiaIranIraqIrelandIsraelItalyJamaicaJapanJordanKenyaKoreaKuwaitLatin AmericaLebanonLiberiaMalaysiaMexicoMiddle AfricaMoldovaMoroccoNetherlandsNigeriaNorthern AfricaNorthern EuropeNorwayOceaniaPakistanPanamaPeruPhilippinesPolandPortugalRomaniaRussiaSaudi ArabiaScotlandSenegalSingaporeSouth AfricaSouth AmericaSouth Central AsiaSouth Eastern AsiaSouthern EuropeSpainSudanTaiwanThailandTrinidad and TobagoTurkeyUkraineUzbekistanVenezuelaVietnamWestern AfricaWestern AsiaWestern EuropeZaire
Income
Income (Families)
Income (Households)
Poverty
Poverty (Families)
Unemployment
Employment Occupations
Employment Industries
Employer Class
Commute Time
Commute Means
School Enrollment
Education by Degree Field
Occupancy
Finances
Physical Characteristics
Dayton
Compare Zip Codes
Comparison Subject

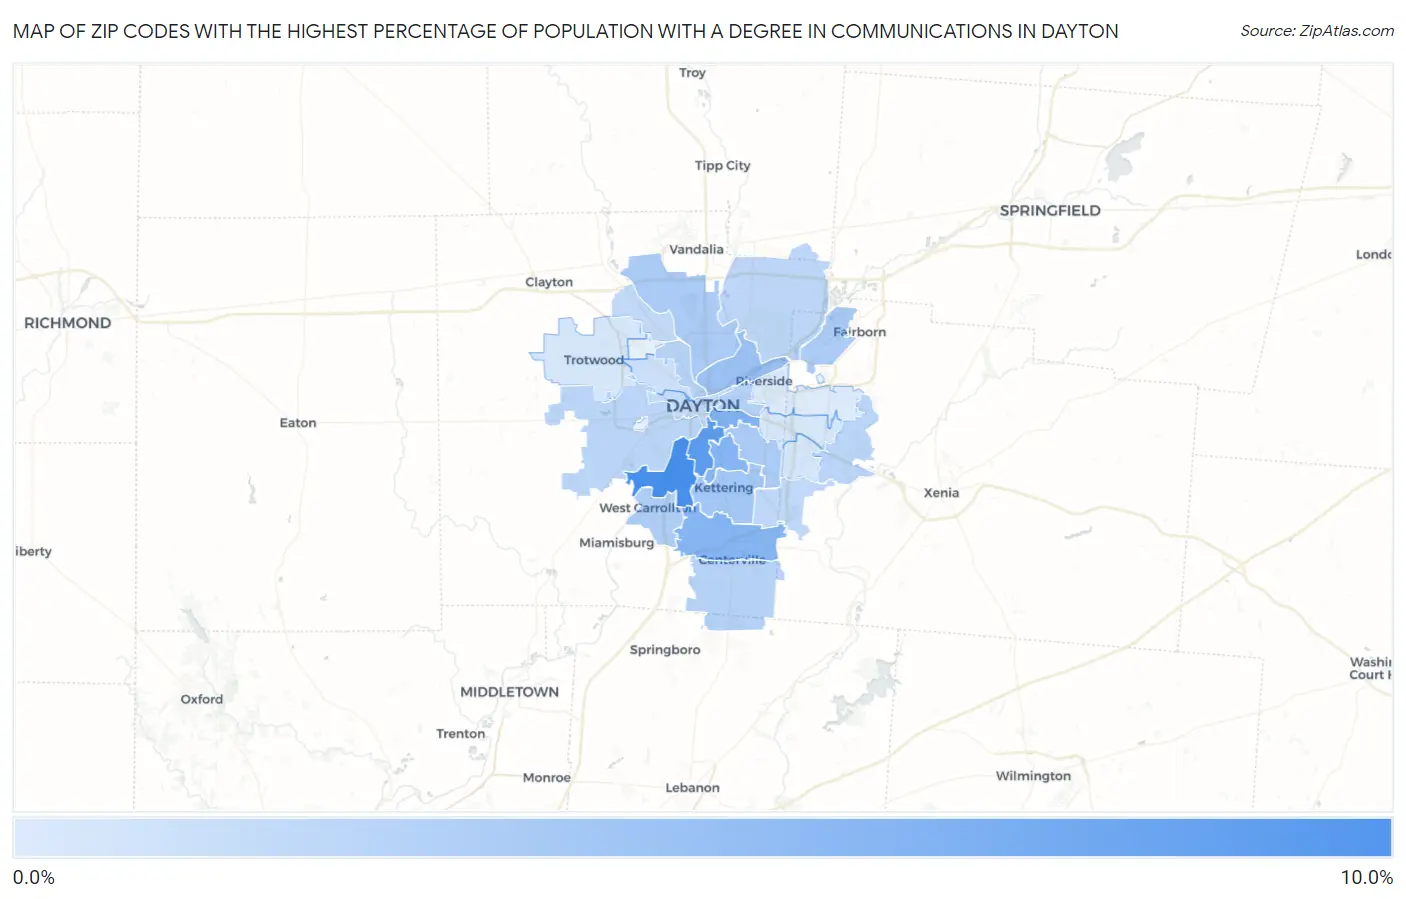
Map of Zip Codes with the Highest Percentage of Population with a Degree in Communications in Dayton

0.0%
10.0%
Zip Codes with the Highest Percentage of Population with a Degree in Communications in Dayton Map

Zip Codes with the Highest Percentage of Population with a Degree in Communications in Dayton, OH

Zip Code % Graduates vs State vs National
1.454398.1%4.3%(+3.81)#844.1%(+3.98)#1,810
2.454097.2%4.3%(+2.90)#1104.1%(+3.07)#2,428
3.454105.7%4.3%(+1.38)#1794.1%(+1.55)#4,298
4.454595.5%4.3%(+1.23)#1914.1%(+1.40)#4,584
5.454195.5%4.3%(+1.16)#1974.1%(+1.33)#4,708
6.454044.5%4.3%(+0.237)#2894.1%(+0.410)#6,828
7.454294.3%4.3%(-0.038)#3184.1%(+0.136)#7,665
8.454204.0%4.3%(-0.327)#3604.1%(-0.154)#8,628
9.454144.0%4.3%(-0.350)#3654.1%(-0.177)#8,719
10.454333.9%4.3%(-0.438)#3714.1%(-0.264)#9,012
11.454493.8%4.3%(-0.556)#3914.1%(-0.382)#9,448
12.454033.6%4.3%(-0.752)#4164.1%(-0.579)#10,114
13.454053.5%4.3%(-0.773)#4214.1%(-0.600)#10,193
14.454583.4%4.3%(-0.861)#4394.1%(-0.688)#10,531
15.454343.3%4.3%(-1.04)#4624.1%(-0.862)#11,161
16.454173.3%4.3%(-1.05)#4654.1%(-0.877)#11,226
17.454243.2%4.3%(-1.14)#4754.1%(-0.965)#11,569
18.454403.2%4.3%(-1.16)#4794.1%(-0.982)#11,633
19.454153.1%4.3%(-1.24)#4884.1%(-1.06)#11,928
20.454022.8%4.3%(-1.51)#5264.1%(-1.34)#13,007
21.454062.5%4.3%(-1.78)#5624.1%(-1.60)#14,020
22.454322.2%4.3%(-2.08)#5934.1%(-1.91)#15,094
23.454262.2%4.3%(-2.08)#5944.1%(-1.91)#15,096
24.454302.2%4.3%(-2.11)#5964.1%(-1.94)#15,210
25.454311.9%4.3%(-2.40)#6284.1%(-2.23)#16,214

Common Questions

What are the Top 10 Zip Codes with the Highest Percentage of Population with a Degree in Communications in Dayton, OH?
Top 10 Zip Codes with the Highest Percentage of Population with a Degree in Communications in Dayton, OH are:
#1
8.1%
#2
7.2%
#3
5.7%
#4
5.5%
#5
5.5%
#6
4.5%
#7
4.3%
#8
4.0%
#9
4.0%
#10
3.9%
What zip code has the Highest Percentage of Population with a Degree in Communications in Dayton, OH?
45439 has the Highest Percentage of Population with a Degree in Communications in Dayton, OH with 8.1%.
What is the Percentage of Population with a Degree in Communications in Dayton, OH?
Percentage of Population with a Degree in Communications in Dayton is 3.8%.
What is the Percentage of Population with a Degree in Communications in Ohio?
Percentage of Population with a Degree in Communications in Ohio is 4.3%.
What is the Percentage of Population with a Degree in Communications in the United States?
Percentage of Population with a Degree in Communications in the United States is 4.1%.