Zip Codes with the Highest Percentage of Population with a Degree in Communications in Oklahoma
RELATED REPORTS & OPTIONS
Communications
Oklahoma
Compare Zip Codes
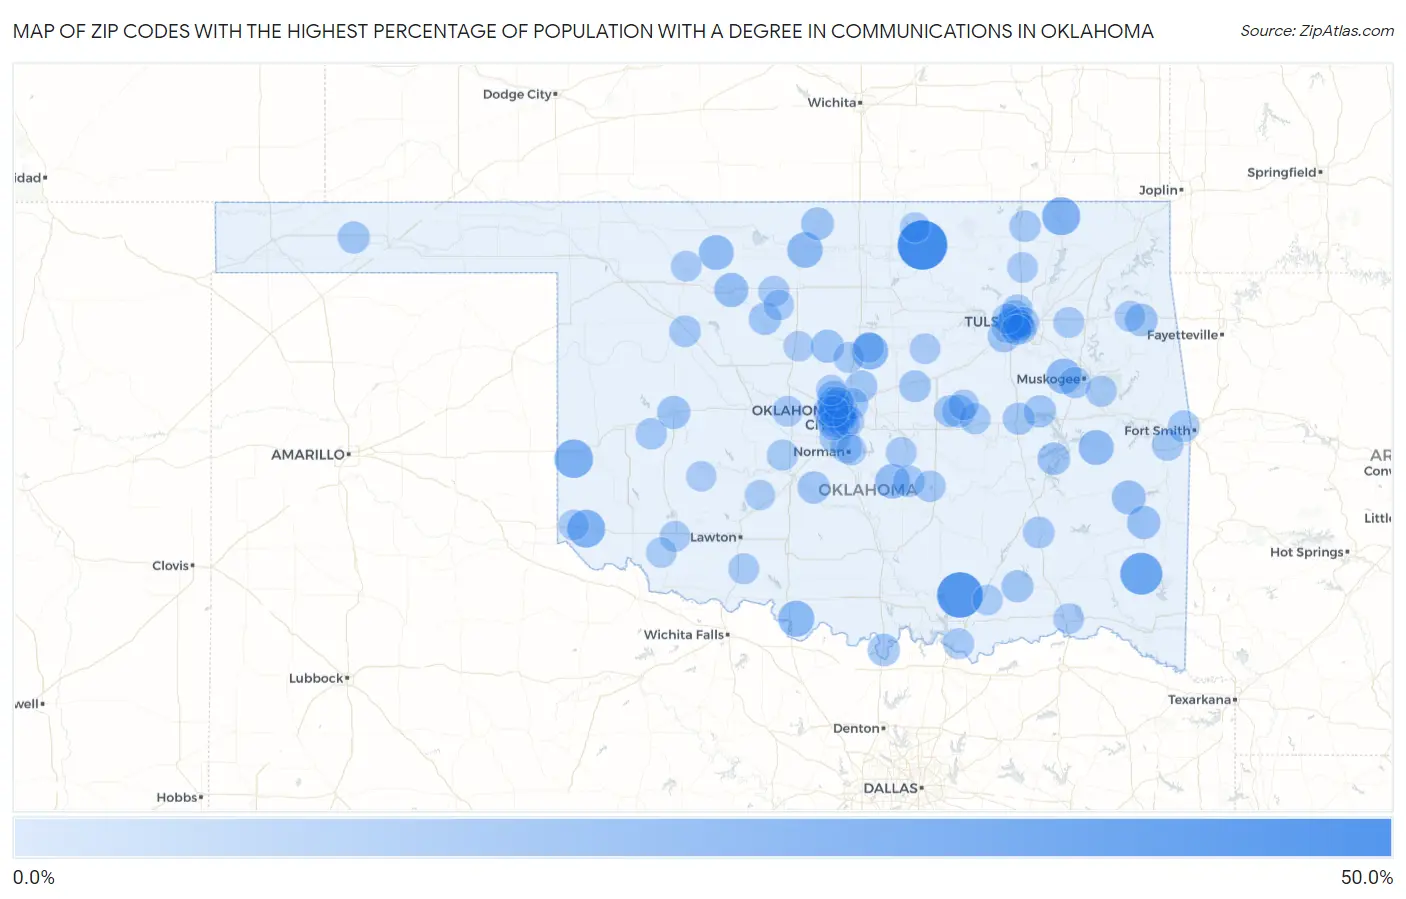
Map of Zip Codes with the Highest Percentage of Population with a Degree in Communications in Oklahoma
0.0%
50.0%
Zip Codes with the Highest Percentage of Population with a Degree in Communications in Oklahoma
| Zip Code | % Graduates | vs State | vs National | |
| 1. | 74633 | 45.5% | 3.8%(+41.7)#1 | 4.1%(+41.3)#65 |
| 2. | 74748 | 37.1% | 3.8%(+33.3)#2 | 4.1%(+33.0)#94 |
| 3. | 74724 | 29.0% | 3.8%(+25.2)#3 | 4.1%(+24.9)#166 |
| 4. | 73645 | 22.0% | 3.8%(+18.3)#4 | 4.1%(+17.9)#272 |
| 5. | 74042 | 20.8% | 3.8%(+17.0)#5 | 4.1%(+16.7)#306 |
| 6. | 73544 | 20.5% | 3.8%(+16.7)#6 | 4.1%(+16.4)#315 |
| 7. | 73050 | 17.5% | 3.8%(+13.7)#7 | 4.1%(+13.4)#419 |
| 8. | 73565 | 16.7% | 3.8%(+12.9)#8 | 4.1%(+12.5)#454 |
| 9. | 73766 | 15.6% | 3.8%(+11.8)#9 | 4.1%(+11.4)#524 |
| 10. | 74463 | 14.9% | 3.8%(+11.1)#10 | 4.1%(+10.8)#557 |
| 11. | 74472 | 14.5% | 3.8%(+10.8)#11 | 4.1%(+10.4)#577 |
| 12. | 73731 | 14.3% | 3.8%(+10.5)#12 | 4.1%(+10.2)#612 |
| 13. | 74878 | 13.9% | 3.8%(+10.1)#13 | 4.1%(+9.73)#633 |
| 14. | 73729 | 12.6% | 3.8%(+8.85)#14 | 4.1%(+8.51)#748 |
| 15. | 74942 | 12.5% | 3.8%(+8.70)#15 | 4.1%(+8.36)#765 |
| 16. | 73105 | 11.4% | 3.8%(+7.57)#16 | 4.1%(+7.23)#919 |
| 17. | 74120 | 11.1% | 3.8%(+7.34)#17 | 4.1%(+7.00)#946 |
| 18. | 74577 | 11.1% | 3.8%(+7.32)#18 | 4.1%(+6.98)#968 |
| 19. | 73108 | 11.0% | 3.8%(+7.18)#19 | 4.1%(+6.84)#985 |
| 20. | 73118 | 10.9% | 3.8%(+7.12)#20 | 4.1%(+6.78)#991 |
| 21. | 73134 | 10.9% | 3.8%(+7.09)#21 | 4.1%(+6.75)#997 |
| 22. | 73601 | 10.7% | 3.8%(+6.94)#22 | 4.1%(+6.60)#1,017 |
| 23. | 73028 | 10.7% | 3.8%(+6.87)#23 | 4.1%(+6.53)#1,036 |
| 24. | 74829 | 10.0% | 3.8%(+6.20)#24 | 4.1%(+5.86)#1,135 |
| 25. | 74359 | 10.0% | 3.8%(+6.20)#25 | 4.1%(+5.86)#1,146 |
| 26. | 73759 | 9.9% | 3.8%(+6.06)#26 | 4.1%(+5.72)#1,185 |
| 27. | 74425 | 9.5% | 3.8%(+5.73)#27 | 4.1%(+5.39)#1,256 |
| 28. | 73102 | 9.5% | 3.8%(+5.71)#28 | 4.1%(+5.37)#1,265 |
| 29. | 73718 | 9.2% | 3.8%(+5.40)#29 | 4.1%(+5.06)#1,363 |
| 30. | 74119 | 9.2% | 3.8%(+5.37)#30 | 4.1%(+5.03)#1,370 |
| 31. | 73002 | 9.0% | 3.8%(+5.21)#31 | 4.1%(+4.87)#1,433 |
| 32. | 73459 | 9.0% | 3.8%(+5.18)#32 | 4.1%(+4.84)#1,446 |
| 33. | 74438 | 8.7% | 3.8%(+4.90)#33 | 4.1%(+4.56)#1,552 |
| 34. | 73939 | 8.6% | 3.8%(+4.84)#34 | 4.1%(+4.50)#1,576 |
| 35. | 74131 | 8.6% | 3.8%(+4.80)#35 | 4.1%(+4.46)#1,589 |
| 36. | 74431 | 8.3% | 3.8%(+4.54)#36 | 4.1%(+4.20)#1,709 |
| 37. | 74555 | 8.3% | 3.8%(+4.54)#37 | 4.1%(+4.20)#1,713 |
| 38. | 73007 | 8.2% | 3.8%(+4.39)#38 | 4.1%(+4.05)#1,776 |
| 39. | 74106 | 8.0% | 3.8%(+4.25)#39 | 4.1%(+3.91)#1,853 |
| 40. | 73116 | 7.9% | 3.8%(+4.08)#40 | 4.1%(+3.74)#1,953 |
| 41. | 74834 | 7.8% | 3.8%(+4.05)#41 | 4.1%(+3.71)#1,966 |
| 42. | 74860 | 7.8% | 3.8%(+4.04)#42 | 4.1%(+3.70)#1,985 |
| 43. | 73104 | 7.8% | 3.8%(+4.03)#43 | 4.1%(+3.69)#1,992 |
| 44. | 73120 | 7.7% | 3.8%(+3.95)#44 | 4.1%(+3.61)#2,030 |
| 45. | 73107 | 7.7% | 3.8%(+3.93)#45 | 4.1%(+3.59)#2,042 |
| 46. | 74107 | 7.7% | 3.8%(+3.93)#46 | 4.1%(+3.59)#2,045 |
| 47. | 74954 | 7.7% | 3.8%(+3.92)#47 | 4.1%(+3.58)#2,046 |
| 48. | 74560 | 7.7% | 3.8%(+3.90)#48 | 4.1%(+3.56)#2,063 |
| 49. | 74826 | 7.6% | 3.8%(+3.77)#49 | 4.1%(+3.43)#2,154 |
| 50. | 73103 | 7.5% | 3.8%(+3.71)#50 | 4.1%(+3.37)#2,181 |
| 51. | 73663 | 7.4% | 3.8%(+3.64)#51 | 4.1%(+3.30)#2,243 |
| 52. | 74959 | 7.4% | 3.8%(+3.60)#52 | 4.1%(+3.26)#2,272 |
| 53. | 74029 | 7.2% | 3.8%(+3.44)#53 | 4.1%(+3.10)#2,412 |
| 54. | 73122 | 7.2% | 3.8%(+3.37)#54 | 4.1%(+3.03)#2,458 |
| 55. | 73624 | 7.1% | 3.8%(+3.35)#55 | 4.1%(+3.01)#2,477 |
| 56. | 73151 | 7.0% | 3.8%(+3.21)#56 | 4.1%(+2.87)#2,600 |
| 57. | 74401 | 7.0% | 3.8%(+3.21)#57 | 4.1%(+2.87)#2,607 |
| 58. | 74849 | 7.0% | 3.8%(+3.20)#58 | 4.1%(+2.86)#2,614 |
| 59. | 73069 | 7.0% | 3.8%(+3.18)#59 | 4.1%(+2.84)#2,622 |
| 60. | 73129 | 6.7% | 3.8%(+2.95)#60 | 4.1%(+2.61)#2,859 |
| 61. | 73170 | 6.7% | 3.8%(+2.92)#61 | 4.1%(+2.58)#2,895 |
| 62. | 74423 | 6.7% | 3.8%(+2.87)#62 | 4.1%(+2.53)#2,949 |
| 63. | 74104 | 6.4% | 3.8%(+2.61)#63 | 4.1%(+2.27)#3,237 |
| 64. | 74859 | 6.4% | 3.8%(+2.57)#64 | 4.1%(+2.23)#3,291 |
| 65. | 73119 | 6.3% | 3.8%(+2.55)#65 | 4.1%(+2.21)#3,321 |
| 66. | 74130 | 6.3% | 3.8%(+2.52)#66 | 4.1%(+2.18)#3,347 |
| 67. | 73079 | 6.2% | 3.8%(+2.45)#67 | 4.1%(+2.11)#3,423 |
| 68. | 74112 | 6.2% | 3.8%(+2.45)#68 | 4.1%(+2.11)#3,439 |
| 69. | 74114 | 6.2% | 3.8%(+2.37)#69 | 4.1%(+2.03)#3,530 |
| 70. | 73572 | 6.1% | 3.8%(+2.33)#70 | 4.1%(+1.99)#3,588 |
| 71. | 73115 | 6.1% | 3.8%(+2.28)#71 | 4.1%(+1.94)#3,660 |
| 72. | 74873 | 6.1% | 3.8%(+2.27)#72 | 4.1%(+1.93)#3,675 |
| 73. | 73754 | 6.0% | 3.8%(+2.25)#73 | 4.1%(+1.91)#3,715 |
| 74. | 74364 | 6.0% | 3.8%(+2.23)#74 | 4.1%(+1.89)#3,735 |
| 75. | 74036 | 6.0% | 3.8%(+2.19)#75 | 4.1%(+1.85)#3,804 |
| 76. | 73566 | 6.0% | 3.8%(+2.17)#76 | 4.1%(+1.83)#3,840 |
| 77. | 74733 | 5.9% | 3.8%(+2.15)#77 | 4.1%(+1.81)#3,863 |
| 78. | 73044 | 5.9% | 3.8%(+2.14)#78 | 4.1%(+1.80)#3,878 |
| 79. | 73114 | 5.8% | 3.8%(+1.98)#79 | 4.1%(+1.64)#4,161 |
| 80. | 73036 | 5.7% | 3.8%(+1.94)#80 | 4.1%(+1.60)#4,204 |
| 81. | 73112 | 5.7% | 3.8%(+1.90)#81 | 4.1%(+1.56)#4,287 |
| 82. | 73735 | 5.6% | 3.8%(+1.82)#82 | 4.1%(+1.48)#4,415 |
| 83. | 74743 | 5.6% | 3.8%(+1.78)#83 | 4.1%(+1.44)#4,510 |
| 84. | 73860 | 5.6% | 3.8%(+1.76)#84 | 4.1%(+1.42)#4,539 |
| 85. | 74833 | 5.6% | 3.8%(+1.76)#85 | 4.1%(+1.42)#4,549 |
| 86. | 74023 | 5.5% | 3.8%(+1.72)#86 | 4.1%(+1.38)#4,609 |
| 87. | 74135 | 5.5% | 3.8%(+1.72)#87 | 4.1%(+1.38)#4,610 |
| 88. | 73550 | 5.5% | 3.8%(+1.70)#88 | 4.1%(+1.36)#4,642 |
| 89. | 74729 | 5.5% | 3.8%(+1.69)#89 | 4.1%(+1.35)#4,671 |
| 90. | 73027 | 5.5% | 3.8%(+1.68)#90 | 4.1%(+1.34)#4,692 |
| 91. | 74061 | 5.4% | 3.8%(+1.60)#91 | 4.1%(+1.26)#4,862 |
| 92. | 73071 | 5.4% | 3.8%(+1.56)#92 | 4.1%(+1.22)#4,941 |
| 93. | 74127 | 5.2% | 3.8%(+1.36)#93 | 4.1%(+1.02)#5,341 |
| 94. | 74641 | 5.1% | 3.8%(+1.33)#94 | 4.1%(+0.993)#5,403 |
| 95. | 74105 | 5.1% | 3.8%(+1.32)#95 | 4.1%(+0.977)#5,432 |
| 96. | 73029 | 5.1% | 3.8%(+1.30)#96 | 4.1%(+0.958)#5,481 |
| 97. | 73570 | 5.1% | 3.8%(+1.28)#97 | 4.1%(+0.937)#5,526 |
| 98. | 73734 | 5.0% | 3.8%(+1.20)#98 | 4.1%(+0.865)#5,698 |
| 99. | 73062 | 4.9% | 3.8%(+1.12)#99 | 4.1%(+0.776)#5,899 |
| 100. | 73012 | 4.9% | 3.8%(+1.10)#100 | 4.1%(+0.763)#5,920 |
Common Questions
What are the Top 10 Zip Codes with the Highest Percentage of Population with a Degree in Communications in Oklahoma?
Top 10 Zip Codes with the Highest Percentage of Population with a Degree in Communications in Oklahoma are:
What zip code has the Highest Percentage of Population with a Degree in Communications in Oklahoma?
74633 has the Highest Percentage of Population with a Degree in Communications in Oklahoma with 45.5%.
What is the Percentage of Population with a Degree in Communications in the State of Oklahoma?
Percentage of Population with a Degree in Communications in Oklahoma is 3.8%.
What is the Percentage of Population with a Degree in Communications in the United States?
Percentage of Population with a Degree in Communications in the United States is 4.1%.