Zip Codes with the Highest Percentage of Population with a Degree in Communications in Cincinnati, OH
RELATED REPORTS & OPTIONS
Communications
Cincinnati
Compare Zip Codes
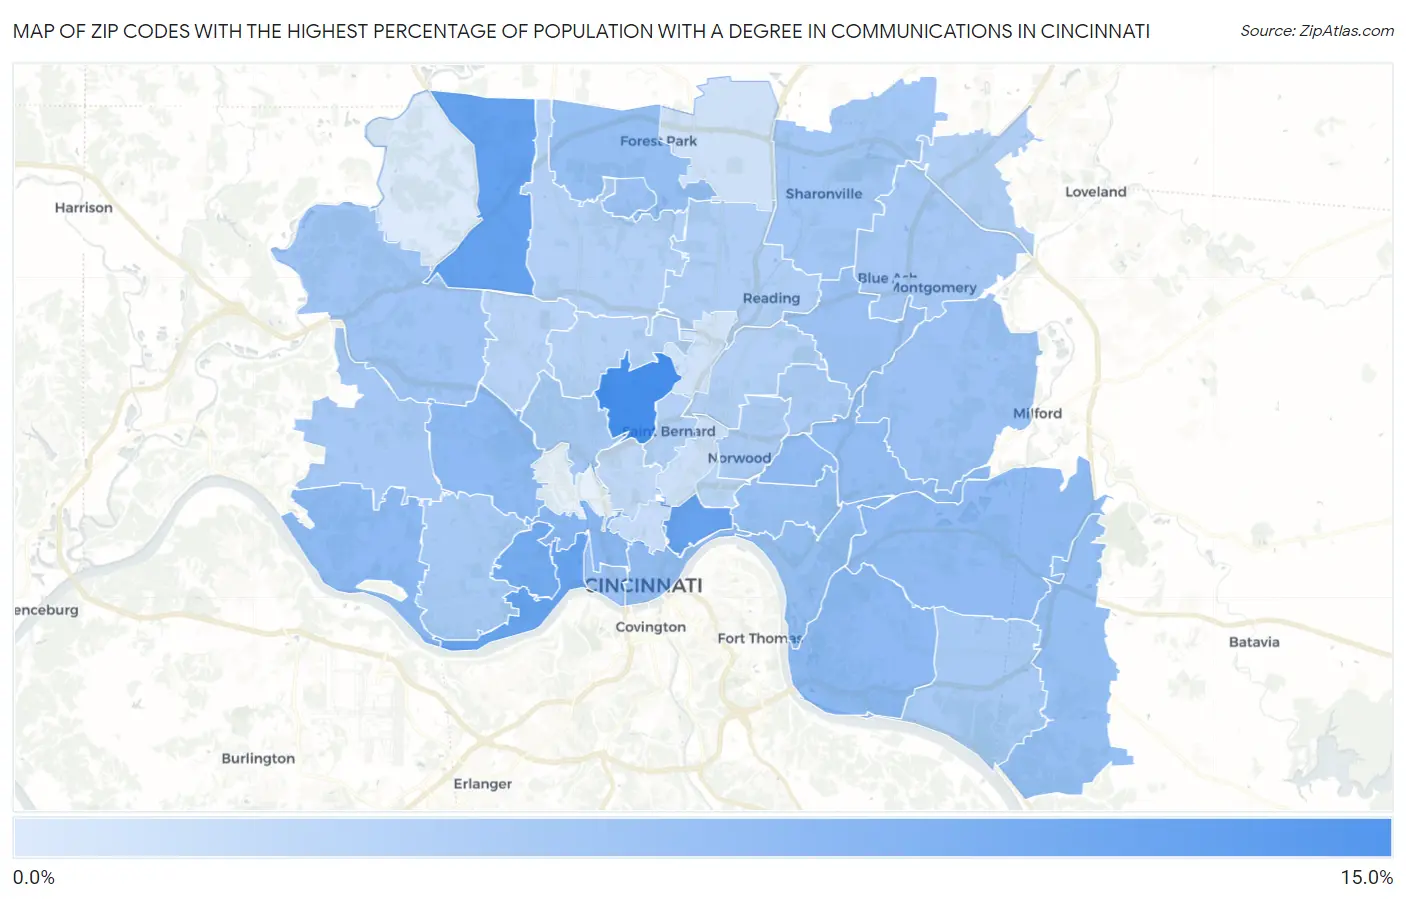
Map of Zip Codes with the Highest Percentage of Population with a Degree in Communications in Cincinnati
0.0%
15.0%
Zip Codes with the Highest Percentage of Population with a Degree in Communications in Cincinnati, OH
| Zip Code | % Graduates | vs State | vs National | |
| 1. | 45232 | 12.3% | 4.3%(+7.97)#41 | 4.1%(+8.14)#782 |
| 2. | 45251 | 9.8% | 4.3%(+5.49)#57 | 4.1%(+5.67)#1,195 |
| 3. | 45206 | 9.7% | 4.3%(+5.36)#59 | 4.1%(+5.53)#1,224 |
| 4. | 45204 | 9.5% | 4.3%(+5.14)#64 | 4.1%(+5.32)#1,286 |
| 5. | 45205 | 8.6% | 4.3%(+4.30)#73 | 4.1%(+4.47)#1,587 |
| 6. | 45214 | 6.9% | 4.3%(+2.63)#117 | 4.1%(+2.80)#2,663 |
| 7. | 45211 | 6.5% | 4.3%(+2.18)#137 | 4.1%(+2.35)#3,146 |
| 8. | 45233 | 6.5% | 4.3%(+2.14)#138 | 4.1%(+2.32)#3,187 |
| 9. | 45230 | 6.4% | 4.3%(+2.10)#139 | 4.1%(+2.28)#3,228 |
| 10. | 45209 | 6.4% | 4.3%(+2.06)#143 | 4.1%(+2.24)#3,286 |
| 11. | 45244 | 6.3% | 4.3%(+1.97)#146 | 4.1%(+2.15)#3,389 |
| 12. | 45227 | 6.2% | 4.3%(+1.91)#150 | 4.1%(+2.08)#3,469 |
| 13. | 45202 | 6.1% | 4.3%(+1.79)#158 | 4.1%(+1.97)#3,630 |
| 14. | 45245 | 6.0% | 4.3%(+1.70)#164 | 4.1%(+1.87)#3,768 |
| 15. | 45226 | 6.0% | 4.3%(+1.68)#166 | 4.1%(+1.86)#3,798 |
| 16. | 45240 | 5.9% | 4.3%(+1.59)#168 | 4.1%(+1.76)#3,941 |
| 17. | 45208 | 5.7% | 4.3%(+1.39)#177 | 4.1%(+1.56)#4,279 |
| 18. | 45203 | 5.5% | 4.3%(+1.21)#192 | 4.1%(+1.39)#4,604 |
| 19. | 45243 | 5.5% | 4.3%(+1.16)#195 | 4.1%(+1.33)#4,702 |
| 20. | 45218 | 5.4% | 4.3%(+1.10)#204 | 4.1%(+1.27)#4,826 |
| 21. | 45236 | 5.4% | 4.3%(+1.06)#209 | 4.1%(+1.23)#4,914 |
| 22. | 45247 | 5.0% | 4.3%(+0.727)#239 | 4.1%(+0.901)#5,605 |
| 23. | 45241 | 4.9% | 4.3%(+0.572)#254 | 4.1%(+0.745)#5,968 |
| 24. | 45248 | 4.7% | 4.3%(+0.383)#273 | 4.1%(+0.556)#6,428 |
| 25. | 45242 | 4.6% | 4.3%(+0.320)#279 | 4.1%(+0.494)#6,609 |
| 26. | 45223 | 4.6% | 4.3%(+0.302)#281 | 4.1%(+0.476)#6,659 |
| 27. | 45255 | 4.6% | 4.3%(+0.266)#285 | 4.1%(+0.439)#6,763 |
| 28. | 45238 | 4.5% | 4.3%(+0.197)#293 | 4.1%(+0.371)#6,938 |
| 29. | 45213 | 4.3% | 4.3%(-0.020)#315 | 4.1%(+0.154)#7,614 |
| 30. | 45212 | 4.2% | 4.3%(-0.134)#332 | 4.1%(+0.040)#7,969 |
| 31. | 45215 | 3.8% | 4.3%(-0.501)#379 | 4.1%(-0.327)#9,247 |
| 32. | 45249 | 3.8% | 4.3%(-0.557)#392 | 4.1%(-0.384)#9,450 |
| 33. | 45231 | 3.7% | 4.3%(-0.591)#397 | 4.1%(-0.417)#9,567 |
| 34. | 45217 | 3.7% | 4.3%(-0.629)#404 | 4.1%(-0.455)#9,699 |
| 35. | 45237 | 3.6% | 4.3%(-0.722)#413 | 4.1%(-0.549)#9,993 |
| 36. | 45224 | 3.5% | 4.3%(-0.839)#433 | 4.1%(-0.666)#10,448 |
| 37. | 45239 | 3.3% | 4.3%(-0.997)#456 | 4.1%(-0.824)#11,022 |
| 38. | 45207 | 3.2% | 4.3%(-1.15)#477 | 4.1%(-0.974)#11,598 |
| 39. | 45220 | 2.6% | 4.3%(-1.69)#554 | 4.1%(-1.52)#13,721 |
| 40. | 45219 | 2.1% | 4.3%(-2.17)#600 | 4.1%(-2.00)#15,379 |
| 41. | 45229 | 1.8% | 4.3%(-2.55)#640 | 4.1%(-2.37)#16,682 |
| 42. | 45246 | 1.5% | 4.3%(-2.77)#663 | 4.1%(-2.60)#17,394 |
| 43. | 45216 | 1.3% | 4.3%(-2.97)#680 | 4.1%(-2.80)#18,021 |
| 44. | 45252 | 0.51% | 4.3%(-3.80)#749 | 4.1%(-3.62)#20,099 |
1
Common Questions
What are the Top 10 Zip Codes with the Highest Percentage of Population with a Degree in Communications in Cincinnati, OH?
Top 10 Zip Codes with the Highest Percentage of Population with a Degree in Communications in Cincinnati, OH are:
What zip code has the Highest Percentage of Population with a Degree in Communications in Cincinnati, OH?
45232 has the Highest Percentage of Population with a Degree in Communications in Cincinnati, OH with 12.3%.
What is the Percentage of Population with a Degree in Communications in Cincinnati, OH?
Percentage of Population with a Degree in Communications in Cincinnati is 5.4%.
What is the Percentage of Population with a Degree in Communications in Ohio?
Percentage of Population with a Degree in Communications in Ohio is 4.3%.
What is the Percentage of Population with a Degree in Communications in the United States?
Percentage of Population with a Degree in Communications in the United States is 4.1%.