Zip Codes with the Highest Percentage of Population with a Degree in Communications in Nebraska
RELATED REPORTS & OPTIONS
Communications
Nebraska
Compare Zip Codes
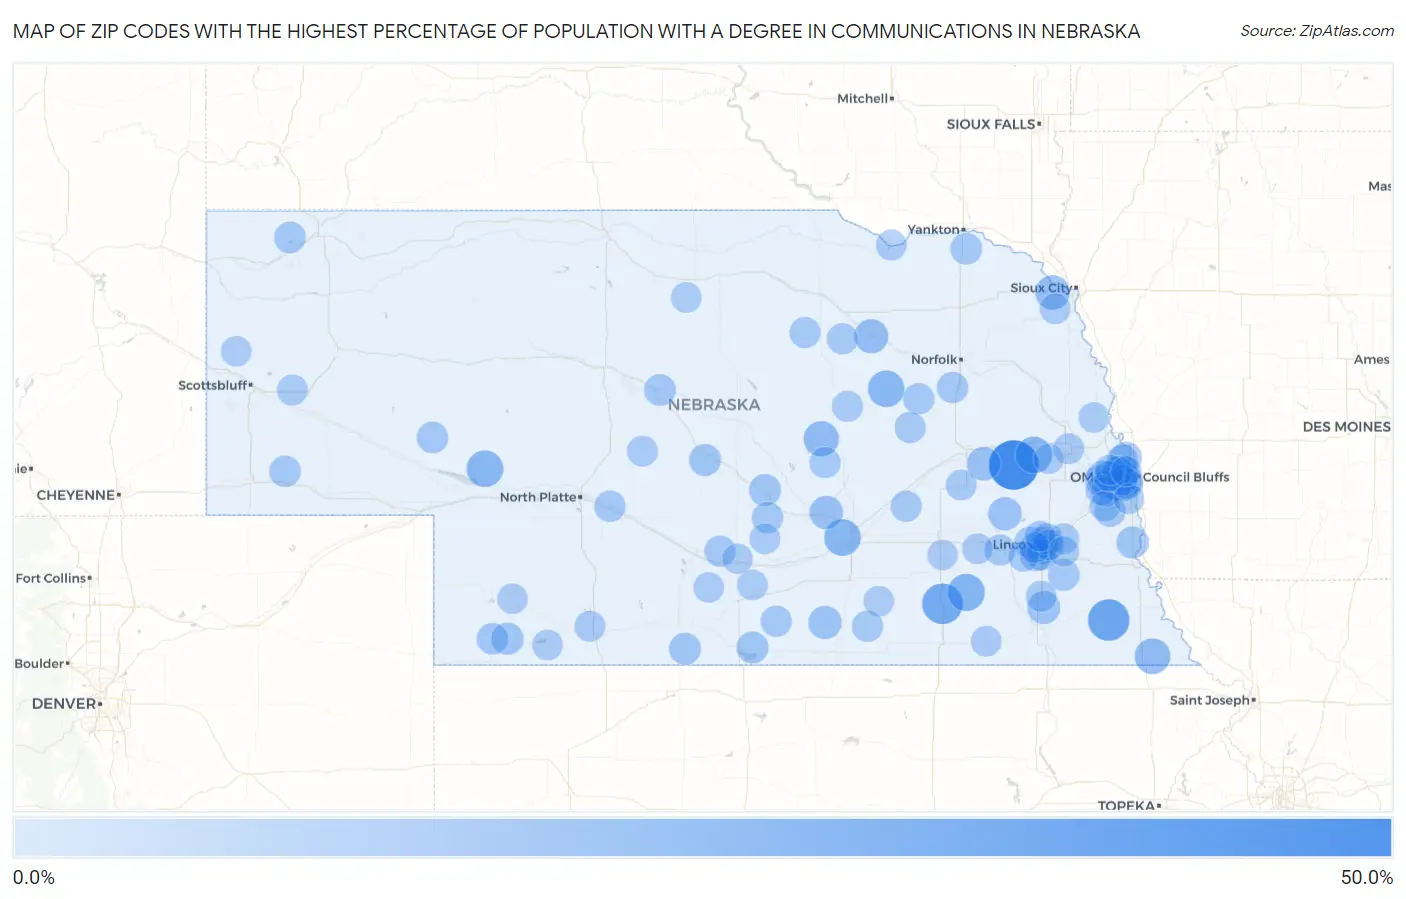
Map of Zip Codes with the Highest Percentage of Population with a Degree in Communications in Nebraska
0.0%
50.0%
Zip Codes with the Highest Percentage of Population with a Degree in Communications in Nebraska
| Zip Code | % Graduates | vs State | vs National | |
| 1. | 68001 | 50.0% | 4.0%(+46.0)#1 | 4.1%(+45.9)#51 |
| 2. | 68348 | 30.8% | 4.0%(+26.7)#2 | 4.1%(+26.6)#149 |
| 3. | 68444 | 28.6% | 4.0%(+24.6)#3 | 4.1%(+24.4)#171 |
| 4. | 68406 | 20.5% | 4.0%(+16.5)#4 | 4.1%(+16.4)#313 |
| 5. | 68648 | 19.2% | 4.0%(+15.2)#5 | 4.1%(+15.1)#358 |
| 6. | 68810 | 19.1% | 4.0%(+15.1)#6 | 4.1%(+15.0)#364 |
| 7. | 69144 | 19.0% | 4.0%(+15.0)#7 | 4.1%(+14.9)#367 |
| 8. | 68652 | 18.8% | 4.0%(+14.7)#8 | 4.1%(+14.6)#378 |
| 9. | 68433 | 16.7% | 4.0%(+12.6)#9 | 4.1%(+12.5)#463 |
| 10. | 68875 | 15.8% | 4.0%(+11.8)#10 | 4.1%(+11.7)#508 |
| 11. | 68743 | 14.0% | 4.0%(+10.00)#11 | 4.1%(+9.88)#625 |
| 12. | 68726 | 13.4% | 4.0%(+9.39)#12 | 4.1%(+9.28)#666 |
| 13. | 68624 | 11.9% | 4.0%(+7.86)#13 | 4.1%(+7.75)#838 |
| 14. | 68824 | 11.6% | 4.0%(+7.61)#14 | 4.1%(+7.49)#873 |
| 15. | 68314 | 11.1% | 4.0%(+7.09)#15 | 4.1%(+6.98)#961 |
| 16. | 68928 | 11.1% | 4.0%(+7.09)#16 | 4.1%(+6.98)#962 |
| 17. | 68422 | 10.8% | 4.0%(+6.76)#17 | 4.1%(+6.65)#1,010 |
| 18. | 68105 | 9.6% | 4.0%(+5.58)#18 | 4.1%(+5.46)#1,241 |
| 19. | 68117 | 9.6% | 4.0%(+5.57)#19 | 4.1%(+5.46)#1,242 |
| 20. | 68523 | 9.1% | 4.0%(+5.07)#20 | 4.1%(+4.96)#1,399 |
| 21. | 69037 | 8.8% | 4.0%(+4.75)#21 | 4.1%(+4.64)#1,519 |
| 22. | 68455 | 8.4% | 4.0%(+4.40)#22 | 4.1%(+4.29)#1,672 |
| 23. | 68822 | 8.3% | 4.0%(+4.24)#23 | 4.1%(+4.13)#1,741 |
| 24. | 68104 | 8.0% | 4.0%(+3.97)#24 | 4.1%(+3.85)#1,889 |
| 25. | 68852 | 8.0% | 4.0%(+3.93)#25 | 4.1%(+3.82)#1,908 |
| 26. | 68971 | 7.8% | 4.0%(+3.82)#26 | 4.1%(+3.71)#1,974 |
| 27. | 68926 | 7.8% | 4.0%(+3.79)#27 | 4.1%(+3.68)#1,999 |
| 28. | 68419 | 7.7% | 4.0%(+3.67)#28 | 4.1%(+3.56)#2,069 |
| 29. | 68833 | 7.7% | 4.0%(+3.67)#29 | 4.1%(+3.56)#2,072 |
| 30. | 69367 | 7.5% | 4.0%(+3.53)#30 | 4.1%(+3.41)#2,162 |
| 31. | 68736 | 7.5% | 4.0%(+3.48)#31 | 4.1%(+3.36)#2,189 |
| 32. | 69156 | 7.2% | 4.0%(+3.18)#32 | 4.1%(+3.06)#2,434 |
| 33. | 69021 | 7.2% | 4.0%(+3.17)#33 | 4.1%(+3.06)#2,436 |
| 34. | 69147 | 7.1% | 4.0%(+3.12)#34 | 4.1%(+3.01)#2,486 |
| 35. | 68528 | 7.1% | 4.0%(+3.03)#35 | 4.1%(+2.92)#2,549 |
| 36. | 68132 | 7.0% | 4.0%(+3.01)#36 | 4.1%(+2.90)#2,577 |
| 37. | 68112 | 7.0% | 4.0%(+2.97)#37 | 4.1%(+2.86)#2,611 |
| 38. | 68748 | 6.9% | 4.0%(+2.86)#38 | 4.1%(+2.75)#2,719 |
| 39. | 68508 | 6.8% | 4.0%(+2.73)#39 | 4.1%(+2.62)#2,845 |
| 40. | 68758 | 6.7% | 4.0%(+2.71)#40 | 4.1%(+2.60)#2,874 |
| 41. | 68118 | 6.6% | 4.0%(+2.63)#41 | 4.1%(+2.51)#2,970 |
| 42. | 68863 | 6.6% | 4.0%(+2.60)#42 | 4.1%(+2.48)#2,999 |
| 43. | 69151 | 6.6% | 4.0%(+2.55)#43 | 4.1%(+2.43)#3,056 |
| 44. | 68866 | 6.5% | 4.0%(+2.45)#44 | 4.1%(+2.33)#3,171 |
| 45. | 68947 | 6.5% | 4.0%(+2.43)#45 | 4.1%(+2.32)#3,191 |
| 46. | 68660 | 6.4% | 4.0%(+2.38)#46 | 4.1%(+2.26)#3,245 |
| 47. | 68114 | 6.4% | 4.0%(+2.36)#47 | 4.1%(+2.25)#3,272 |
| 48. | 68016 | 6.3% | 4.0%(+2.29)#48 | 4.1%(+2.17)#3,354 |
| 49. | 68735 | 6.3% | 4.0%(+2.27)#49 | 4.1%(+2.15)#3,376 |
| 50. | 68846 | 6.2% | 4.0%(+2.23)#50 | 4.1%(+2.11)#3,426 |
| 51. | 68835 | 6.2% | 4.0%(+2.15)#51 | 4.1%(+2.04)#3,517 |
| 52. | 68957 | 6.2% | 4.0%(+2.13)#52 | 4.1%(+2.02)#3,542 |
| 53. | 68405 | 6.1% | 4.0%(+2.05)#53 | 4.1%(+1.94)#3,669 |
| 54. | 68725 | 6.0% | 4.0%(+2.01)#54 | 4.1%(+1.90)#3,725 |
| 55. | 68502 | 6.0% | 4.0%(+1.94)#55 | 4.1%(+1.82)#3,846 |
| 56. | 68152 | 5.9% | 4.0%(+1.91)#56 | 4.1%(+1.79)#3,896 |
| 57. | 68512 | 5.9% | 4.0%(+1.91)#57 | 4.1%(+1.79)#3,897 |
| 58. | 68137 | 5.9% | 4.0%(+1.84)#58 | 4.1%(+1.73)#4,012 |
| 59. | 68665 | 5.8% | 4.0%(+1.81)#59 | 4.1%(+1.70)#4,054 |
| 60. | 68331 | 5.8% | 4.0%(+1.77)#60 | 4.1%(+1.65)#4,131 |
| 61. | 68127 | 5.8% | 4.0%(+1.76)#61 | 4.1%(+1.65)#4,141 |
| 62. | 68504 | 5.7% | 4.0%(+1.71)#62 | 4.1%(+1.59)#4,209 |
| 63. | 68510 | 5.7% | 4.0%(+1.66)#63 | 4.1%(+1.54)#4,315 |
| 64. | 69334 | 5.7% | 4.0%(+1.65)#64 | 4.1%(+1.54)#4,327 |
| 65. | 68025 | 5.6% | 4.0%(+1.62)#65 | 4.1%(+1.50)#4,380 |
| 66. | 68522 | 5.6% | 4.0%(+1.54)#66 | 4.1%(+1.43)#4,530 |
| 67. | 69120 | 5.5% | 4.0%(+1.48)#67 | 4.1%(+1.36)#4,643 |
| 68. | 68130 | 5.5% | 4.0%(+1.43)#68 | 4.1%(+1.32)#4,737 |
| 69. | 69001 | 5.4% | 4.0%(+1.42)#69 | 4.1%(+1.31)#4,751 |
| 70. | 68138 | 5.4% | 4.0%(+1.41)#70 | 4.1%(+1.30)#4,782 |
| 71. | 68527 | 5.4% | 4.0%(+1.38)#71 | 4.1%(+1.27)#4,834 |
| 72. | 68662 | 5.4% | 4.0%(+1.36)#72 | 4.1%(+1.25)#4,874 |
| 73. | 68339 | 5.4% | 4.0%(+1.34)#73 | 4.1%(+1.22)#4,933 |
| 74. | 68760 | 5.3% | 4.0%(+1.32)#74 | 4.1%(+1.21)#4,953 |
| 75. | 68107 | 5.3% | 4.0%(+1.28)#75 | 4.1%(+1.16)#5,049 |
| 76. | 68352 | 5.3% | 4.0%(+1.28)#76 | 4.1%(+1.16)#5,051 |
| 77. | 68313 | 5.3% | 4.0%(+1.24)#77 | 4.1%(+1.13)#5,113 |
| 78. | 69044 | 5.3% | 4.0%(+1.24)#78 | 4.1%(+1.13)#5,114 |
| 79. | 68741 | 5.2% | 4.0%(+1.20)#79 | 4.1%(+1.08)#5,211 |
| 80. | 68134 | 5.2% | 4.0%(+1.18)#80 | 4.1%(+1.07)#5,240 |
| 81. | 68136 | 5.2% | 4.0%(+1.17)#81 | 4.1%(+1.06)#5,274 |
| 82. | 68059 | 5.2% | 4.0%(+1.14)#82 | 4.1%(+1.02)#5,336 |
| 83. | 68870 | 5.1% | 4.0%(+1.06)#83 | 4.1%(+0.950)#5,499 |
| 84. | 68106 | 5.1% | 4.0%(+1.05)#84 | 4.1%(+0.938)#5,524 |
| 85. | 68940 | 5.0% | 4.0%(+0.979)#85 | 4.1%(+0.865)#5,699 |
| 86. | 68521 | 5.0% | 4.0%(+0.969)#86 | 4.1%(+0.855)#5,726 |
| 87. | 68154 | 5.0% | 4.0%(+0.945)#87 | 4.1%(+0.831)#5,783 |
| 88. | 68461 | 4.9% | 4.0%(+0.903)#88 | 4.1%(+0.789)#5,869 |
| 89. | 69210 | 4.9% | 4.0%(+0.881)#89 | 4.1%(+0.767)#5,913 |
| 90. | 69357 | 4.9% | 4.0%(+0.880)#90 | 4.1%(+0.765)#5,918 |
| 91. | 68029 | 4.9% | 4.0%(+0.840)#91 | 4.1%(+0.726)#6,033 |
| 92. | 69045 | 4.9% | 4.0%(+0.833)#92 | 4.1%(+0.719)#6,059 |
| 93. | 68164 | 4.8% | 4.0%(+0.784)#93 | 4.1%(+0.670)#6,175 |
| 94. | 68123 | 4.8% | 4.0%(+0.741)#94 | 4.1%(+0.627)#6,265 |
| 95. | 68927 | 4.8% | 4.0%(+0.741)#95 | 4.1%(+0.627)#6,273 |
| 96. | 68938 | 4.7% | 4.0%(+0.667)#96 | 4.1%(+0.552)#6,440 |
| 97. | 68111 | 4.7% | 4.0%(+0.643)#97 | 4.1%(+0.529)#6,509 |
| 98. | 68401 | 4.7% | 4.0%(+0.630)#98 | 4.1%(+0.516)#6,541 |
| 99. | 68836 | 4.5% | 4.0%(+0.512)#99 | 4.1%(+0.398)#6,872 |
| 100. | 68015 | 4.5% | 4.0%(+0.504)#100 | 4.1%(+0.390)#6,886 |
Common Questions
What are the Top 10 Zip Codes with the Highest Percentage of Population with a Degree in Communications in Nebraska?
Top 10 Zip Codes with the Highest Percentage of Population with a Degree in Communications in Nebraska are:
What zip code has the Highest Percentage of Population with a Degree in Communications in Nebraska?
68001 has the Highest Percentage of Population with a Degree in Communications in Nebraska with 50.0%.
What is the Percentage of Population with a Degree in Communications in the State of Nebraska?
Percentage of Population with a Degree in Communications in Nebraska is 4.0%.
What is the Percentage of Population with a Degree in Communications in the United States?
Percentage of Population with a Degree in Communications in the United States is 4.1%.