Zip Codes with the Highest Percentage of Population with a Degree in Communications in Minnesota
RELATED REPORTS & OPTIONS
Communications
Minnesota
Compare Zip Codes
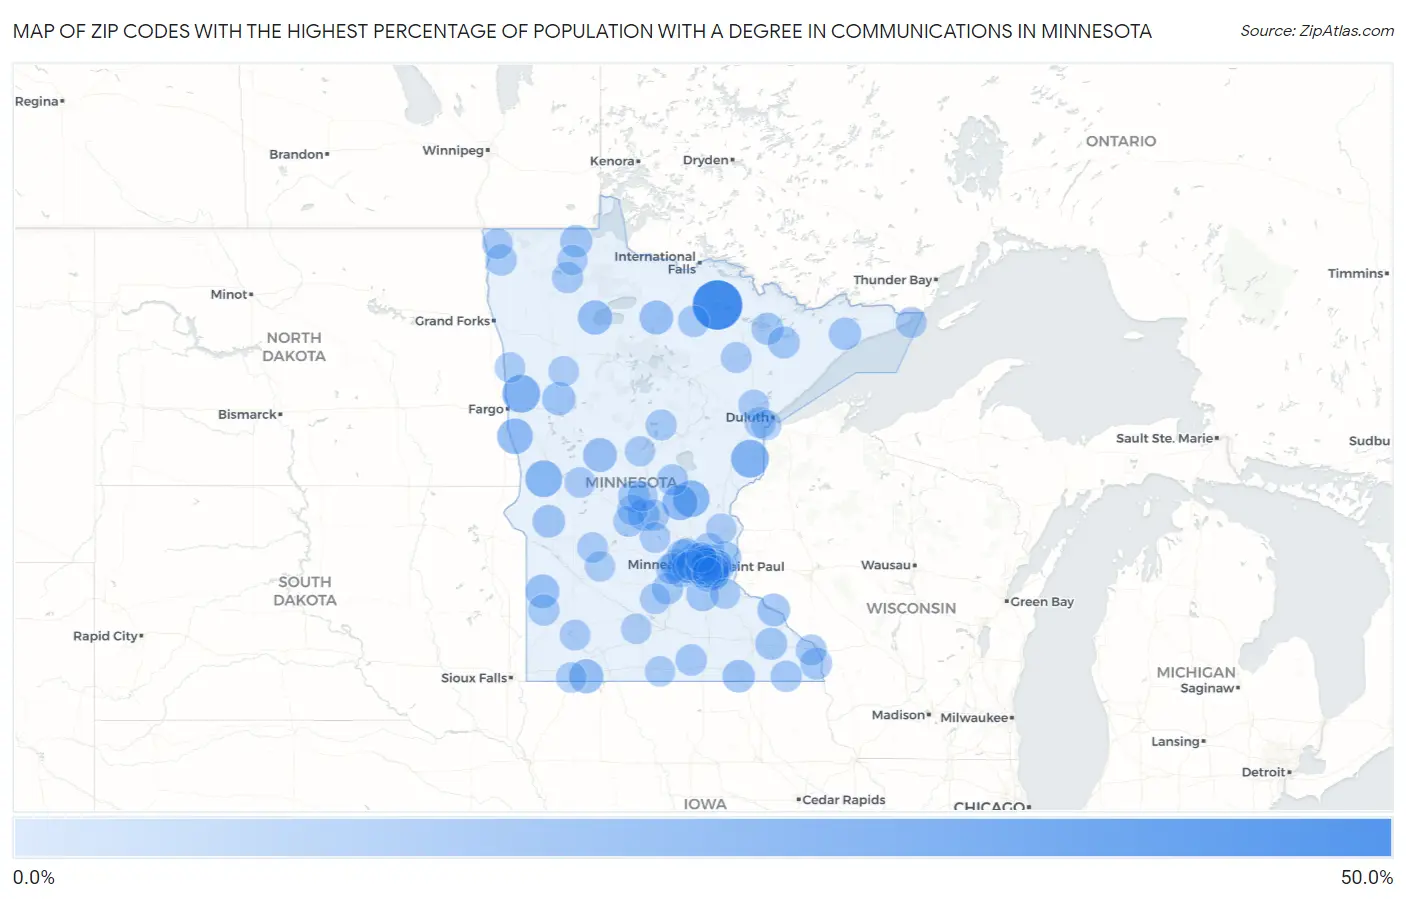
Map of Zip Codes with the Highest Percentage of Population with a Degree in Communications in Minnesota
0.0%
50.0%
Zip Codes with the Highest Percentage of Population with a Degree in Communications in Minnesota
| Zip Code | % Graduates | vs State | vs National | |
| 1. | 55772 | 50.0% | 4.8%(+45.2)#1 | 4.1%(+45.9)#50 |
| 2. | 56536 | 22.9% | 4.8%(+18.1)#2 | 4.1%(+18.8)#251 |
| 3. | 55712 | 22.6% | 4.8%(+17.8)#3 | 4.1%(+18.4)#257 |
| 4. | 56590 | 20.5% | 4.8%(+15.7)#4 | 4.1%(+16.3)#317 |
| 5. | 56313 | 20.0% | 4.8%(+15.2)#5 | 4.1%(+15.9)#334 |
| 6. | 56594 | 17.9% | 4.8%(+13.1)#6 | 4.1%(+13.7)#400 |
| 7. | 56330 | 17.2% | 4.8%(+12.4)#7 | 4.1%(+13.0)#433 |
| 8. | 56671 | 14.9% | 4.8%(+10.2)#8 | 4.1%(+10.8)#556 |
| 9. | 56167 | 14.6% | 4.8%(+9.86)#9 | 4.1%(+10.5)#570 |
| 10. | 56660 | 14.1% | 4.8%(+9.28)#10 | 4.1%(+9.93)#621 |
| 11. | 56453 | 14.0% | 4.8%(+9.22)#11 | 4.1%(+9.86)#626 |
| 12. | 56280 | 13.5% | 4.8%(+8.74)#12 | 4.1%(+9.38)#657 |
| 13. | 55150 | 13.0% | 4.8%(+8.27)#13 | 4.1%(+8.91)#702 |
| 14. | 56521 | 12.6% | 4.8%(+7.84)#14 | 4.1%(+8.49)#749 |
| 15. | 56207 | 11.4% | 4.8%(+6.65)#15 | 4.1%(+7.29)#911 |
| 16. | 55909 | 11.1% | 4.8%(+6.33)#16 | 4.1%(+6.98)#952 |
| 17. | 55968 | 11.1% | 4.8%(+6.33)#17 | 4.1%(+6.98)#969 |
| 18. | 55020 | 10.9% | 4.8%(+6.13)#18 | 4.1%(+6.78)#992 |
| 19. | 55090 | 10.7% | 4.8%(+5.94)#19 | 4.1%(+6.58)#1,026 |
| 20. | 55615 | 10.5% | 4.8%(+5.75)#20 | 4.1%(+6.39)#1,055 |
| 21. | 56756 | 10.4% | 4.8%(+5.67)#21 | 4.1%(+6.31)#1,065 |
| 22. | 55375 | 10.1% | 4.8%(+5.29)#22 | 4.1%(+5.93)#1,121 |
| 23. | 55782 | 10.0% | 4.8%(+5.22)#23 | 4.1%(+5.86)#1,143 |
| 24. | 55418 | 10.0% | 4.8%(+5.21)#24 | 4.1%(+5.86)#1,152 |
| 25. | 55706 | 10.0% | 4.8%(+5.19)#25 | 4.1%(+5.83)#1,158 |
| 26. | 55929 | 9.7% | 4.8%(+4.90)#26 | 4.1%(+5.54)#1,219 |
| 27. | 55101 | 9.7% | 4.8%(+4.89)#27 | 4.1%(+5.53)#1,222 |
| 28. | 55434 | 9.1% | 4.8%(+4.34)#28 | 4.1%(+4.98)#1,389 |
| 29. | 55941 | 9.0% | 4.8%(+4.22)#29 | 4.1%(+4.86)#1,436 |
| 30. | 55364 | 8.8% | 4.8%(+4.07)#30 | 4.1%(+4.71)#1,494 |
| 31. | 56321 | 8.8% | 4.8%(+4.05)#31 | 4.1%(+4.69)#1,500 |
| 32. | 56384 | 8.8% | 4.8%(+4.05)#32 | 4.1%(+4.69)#1,503 |
| 33. | 55415 | 8.8% | 4.8%(+4.03)#33 | 4.1%(+4.67)#1,508 |
| 34. | 56639 | 8.7% | 4.8%(+3.92)#34 | 4.1%(+4.56)#1,553 |
| 35. | 56032 | 8.7% | 4.8%(+3.92)#35 | 4.1%(+4.56)#1,554 |
| 36. | 55424 | 8.6% | 4.8%(+3.82)#36 | 4.1%(+4.46)#1,592 |
| 37. | 55446 | 8.5% | 4.8%(+3.76)#37 | 4.1%(+4.40)#1,618 |
| 38. | 55388 | 8.5% | 4.8%(+3.69)#38 | 4.1%(+4.33)#1,642 |
| 39. | 56338 | 8.4% | 4.8%(+3.66)#39 | 4.1%(+4.31)#1,661 |
| 40. | 55922 | 8.4% | 4.8%(+3.66)#40 | 4.1%(+4.30)#1,664 |
| 41. | 55439 | 8.4% | 4.8%(+3.58)#41 | 4.1%(+4.23)#1,691 |
| 42. | 56113 | 8.3% | 4.8%(+3.56)#42 | 4.1%(+4.20)#1,718 |
| 43. | 56724 | 8.3% | 4.8%(+3.56)#43 | 4.1%(+4.20)#1,723 |
| 44. | 56733 | 8.2% | 4.8%(+3.46)#44 | 4.1%(+4.10)#1,752 |
| 45. | 55338 | 8.1% | 4.8%(+3.31)#45 | 4.1%(+3.95)#1,833 |
| 46. | 55305 | 7.9% | 4.8%(+3.08)#46 | 4.1%(+3.72)#1,962 |
| 47. | 55417 | 7.8% | 4.8%(+3.06)#47 | 4.1%(+3.71)#1,975 |
| 48. | 56303 | 7.8% | 4.8%(+3.04)#48 | 4.1%(+3.69)#1,994 |
| 49. | 55733 | 7.8% | 4.8%(+2.98)#49 | 4.1%(+3.62)#2,026 |
| 50. | 55373 | 7.7% | 4.8%(+2.96)#50 | 4.1%(+3.60)#2,036 |
| 51. | 56376 | 7.7% | 4.8%(+2.91)#51 | 4.1%(+3.56)#2,066 |
| 52. | 56442 | 7.7% | 4.8%(+2.90)#52 | 4.1%(+3.54)#2,083 |
| 53. | 55103 | 7.7% | 4.8%(+2.89)#53 | 4.1%(+3.53)#2,091 |
| 54. | 55925 | 7.6% | 4.8%(+2.87)#54 | 4.1%(+3.51)#2,101 |
| 55. | 55420 | 7.6% | 4.8%(+2.86)#55 | 4.1%(+3.51)#2,103 |
| 56. | 55402 | 7.6% | 4.8%(+2.84)#56 | 4.1%(+3.49)#2,116 |
| 57. | 55360 | 7.6% | 4.8%(+2.78)#57 | 4.1%(+3.42)#2,156 |
| 58. | 55435 | 7.5% | 4.8%(+2.77)#58 | 4.1%(+3.41)#2,160 |
| 59. | 55357 | 7.5% | 4.8%(+2.71)#59 | 4.1%(+3.36)#2,197 |
| 60. | 55713 | 7.5% | 4.8%(+2.68)#60 | 4.1%(+3.33)#2,226 |
| 61. | 55605 | 7.4% | 4.8%(+2.63)#61 | 4.1%(+3.27)#2,262 |
| 62. | 56307 | 7.4% | 4.8%(+2.58)#62 | 4.1%(+3.23)#2,295 |
| 63. | 55121 | 7.3% | 4.8%(+2.55)#63 | 4.1%(+3.19)#2,322 |
| 64. | 55416 | 7.3% | 4.8%(+2.51)#64 | 4.1%(+3.15)#2,353 |
| 65. | 55436 | 7.3% | 4.8%(+2.50)#65 | 4.1%(+3.15)#2,359 |
| 66. | 55334 | 7.2% | 4.8%(+2.45)#66 | 4.1%(+3.09)#2,419 |
| 67. | 55384 | 7.1% | 4.8%(+2.34)#67 | 4.1%(+2.98)#2,505 |
| 68. | 55419 | 7.1% | 4.8%(+2.33)#68 | 4.1%(+2.97)#2,512 |
| 69. | 55426 | 7.1% | 4.8%(+2.32)#69 | 4.1%(+2.96)#2,521 |
| 70. | 55403 | 7.1% | 4.8%(+2.31)#70 | 4.1%(+2.96)#2,526 |
| 71. | 55401 | 7.0% | 4.8%(+2.27)#71 | 4.1%(+2.91)#2,559 |
| 72. | 56123 | 7.0% | 4.8%(+2.24)#72 | 4.1%(+2.88)#2,595 |
| 73. | 56332 | 6.9% | 4.8%(+2.14)#73 | 4.1%(+2.79)#2,685 |
| 74. | 55779 | 6.9% | 4.8%(+2.14)#74 | 4.1%(+2.78)#2,688 |
| 75. | 55382 | 6.9% | 4.8%(+2.10)#75 | 4.1%(+2.74)#2,725 |
| 76. | 56728 | 6.8% | 4.8%(+2.06)#76 | 4.1%(+2.70)#2,763 |
| 77. | 55412 | 6.8% | 4.8%(+2.00)#77 | 4.1%(+2.64)#2,813 |
| 78. | 56252 | 6.7% | 4.8%(+1.89)#78 | 4.1%(+2.53)#2,946 |
| 79. | 55410 | 6.7% | 4.8%(+1.87)#79 | 4.1%(+2.52)#2,967 |
| 80. | 55343 | 6.6% | 4.8%(+1.87)#80 | 4.1%(+2.51)#2,968 |
| 81. | 55102 | 6.6% | 4.8%(+1.85)#81 | 4.1%(+2.49)#2,987 |
| 82. | 56548 | 6.6% | 4.8%(+1.83)#82 | 4.1%(+2.47)#3,014 |
| 83. | 56281 | 6.6% | 4.8%(+1.79)#83 | 4.1%(+2.43)#3,057 |
| 84. | 55079 | 6.5% | 4.8%(+1.76)#84 | 4.1%(+2.40)#3,089 |
| 85. | 55411 | 6.5% | 4.8%(+1.76)#85 | 4.1%(+2.40)#3,095 |
| 86. | 55422 | 6.5% | 4.8%(+1.76)#86 | 4.1%(+2.40)#3,098 |
| 87. | 56117 | 6.5% | 4.8%(+1.74)#87 | 4.1%(+2.39)#3,110 |
| 88. | 55408 | 6.5% | 4.8%(+1.74)#88 | 4.1%(+2.38)#3,117 |
| 89. | 56473 | 6.4% | 4.8%(+1.64)#89 | 4.1%(+2.28)#3,217 |
| 90. | 56013 | 6.4% | 4.8%(+1.64)#90 | 4.1%(+2.28)#3,221 |
| 91. | 56557 | 6.4% | 4.8%(+1.63)#91 | 4.1%(+2.28)#3,231 |
| 92. | 56761 | 6.4% | 4.8%(+1.60)#92 | 4.1%(+2.25)#3,271 |
| 93. | 55808 | 6.4% | 4.8%(+1.60)#93 | 4.1%(+2.24)#3,283 |
| 94. | 55391 | 6.4% | 4.8%(+1.58)#94 | 4.1%(+2.22)#3,304 |
| 95. | 55116 | 6.4% | 4.8%(+1.58)#95 | 4.1%(+2.22)#3,306 |
| 96. | 55428 | 6.3% | 4.8%(+1.55)#96 | 4.1%(+2.19)#3,331 |
| 97. | 56041 | 6.3% | 4.8%(+1.52)#97 | 4.1%(+2.16)#3,361 |
| 98. | 55423 | 6.2% | 4.8%(+1.47)#98 | 4.1%(+2.11)#3,418 |
| 99. | 56314 | 6.2% | 4.8%(+1.47)#99 | 4.1%(+2.11)#3,420 |
| 100. | 55031 | 6.2% | 4.8%(+1.39)#100 | 4.1%(+2.03)#3,525 |
Common Questions
What are the Top 10 Zip Codes with the Highest Percentage of Population with a Degree in Communications in Minnesota?
Top 10 Zip Codes with the Highest Percentage of Population with a Degree in Communications in Minnesota are:
What zip code has the Highest Percentage of Population with a Degree in Communications in Minnesota?
55772 has the Highest Percentage of Population with a Degree in Communications in Minnesota with 50.0%.
What is the Percentage of Population with a Degree in Communications in the State of Minnesota?
Percentage of Population with a Degree in Communications in Minnesota is 4.8%.
What is the Percentage of Population with a Degree in Communications in the United States?
Percentage of Population with a Degree in Communications in the United States is 4.1%.