Zip Codes with the Highest Percentage of Population Employed in Accommodation & Food Services in Mansfield, OH
RELATED REPORTS & OPTIONS
Accommodation & Food Services
Mansfield
Compare Zip Codes
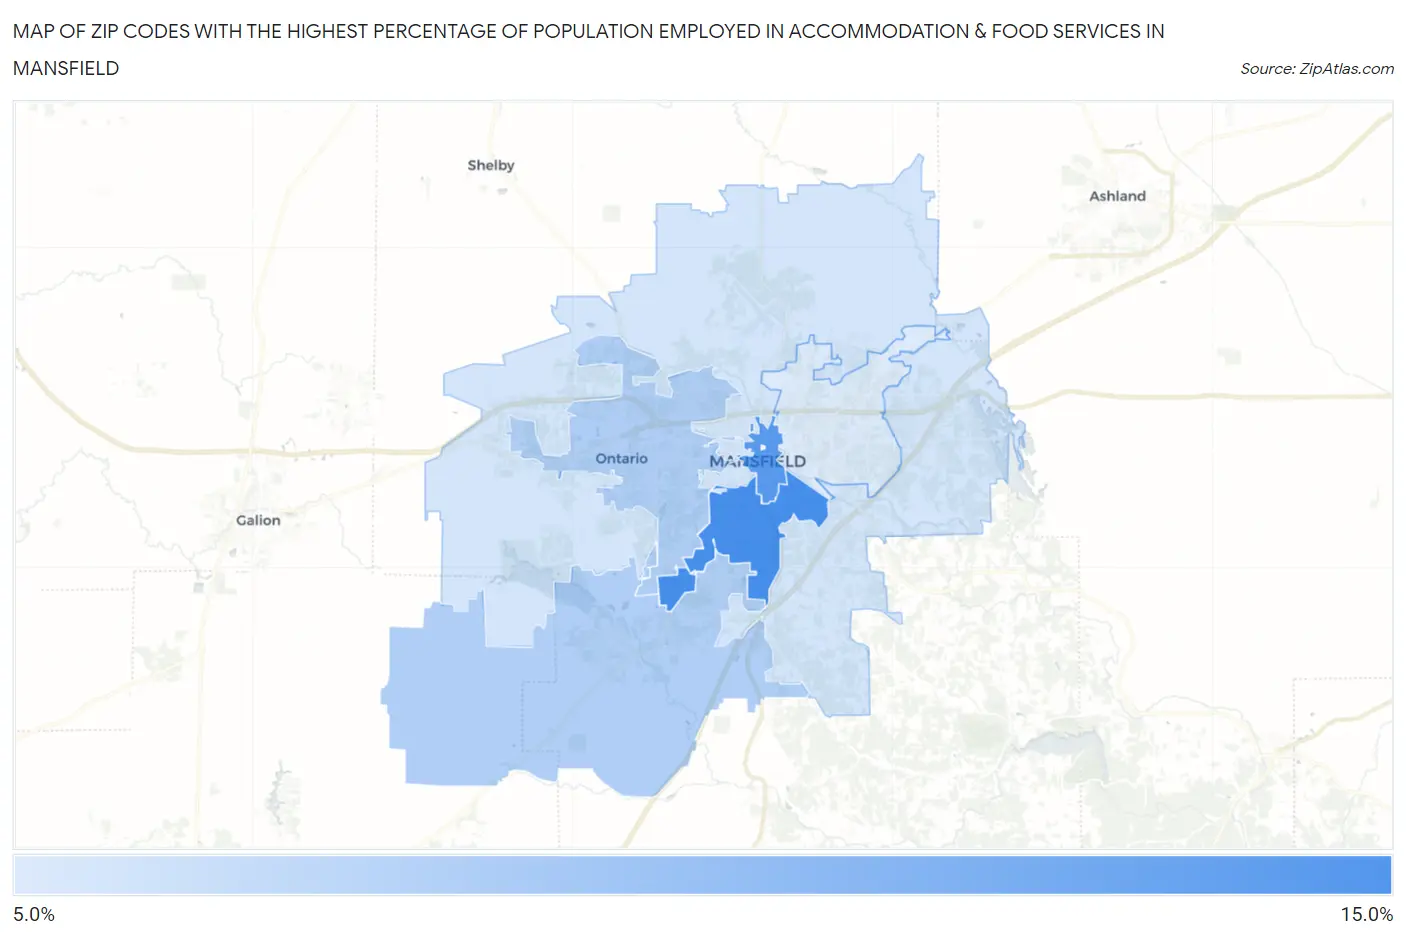
Map of Zip Codes with the Highest Percentage of Population Employed in Accommodation & Food Services in Mansfield
0.0%
15.0%
Zip Codes with the Highest Percentage of Population Employed in Accommodation & Food Services in Mansfield, OH
| Zip Code | % Employed | vs State | vs National | |
| 1. | 44907 | 13.3% | 7.0%(+6.32)#83 | 6.9%(+6.45)#2,218 |
| 2. | 44902 | 12.6% | 7.0%(+5.55)#99 | 6.9%(+5.68)#2,557 |
| 3. | 44906 | 8.2% | 7.0%(+1.19)#331 | 6.9%(+1.32)#7,419 |
| 4. | 44904 | 8.1% | 7.0%(+1.07)#340 | 6.9%(+1.20)#7,664 |
| 5. | 44903 | 6.5% | 7.0%(-0.546)#540 | 6.9%(-0.419)#11,961 |
| 6. | 44905 | 6.1% | 7.0%(-0.951)#592 | 6.9%(-0.824)#13,279 |
1
Common Questions
What are the Top 5 Zip Codes with the Highest Percentage of Population Employed in Accommodation & Food Services in Mansfield, OH?
Top 5 Zip Codes with the Highest Percentage of Population Employed in Accommodation & Food Services in Mansfield, OH are:
What zip code has the Highest Percentage of Population Employed in Accommodation & Food Services in Mansfield, OH?
44907 has the Highest Percentage of Population Employed in Accommodation & Food Services in Mansfield, OH with 13.3%.
What is the Percentage of Population Employed in Accommodation & Food Services in Mansfield, OH?
Percentage of Population Employed in Accommodation & Food Services in Mansfield is 12.6%.
What is the Percentage of Population Employed in Accommodation & Food Services in Ohio?
Percentage of Population Employed in Accommodation & Food Services in Ohio is 7.0%.
What is the Percentage of Population Employed in Accommodation & Food Services in the United States?
Percentage of Population Employed in Accommodation & Food Services in the United States is 6.9%.