Zip Codes with the Highest Percentage of Population Employed in Accommodation & Food Services in Chagrin Falls, OH
RELATED REPORTS & OPTIONS
Accommodation & Food Services
Chagrin Falls
Compare Zip Codes
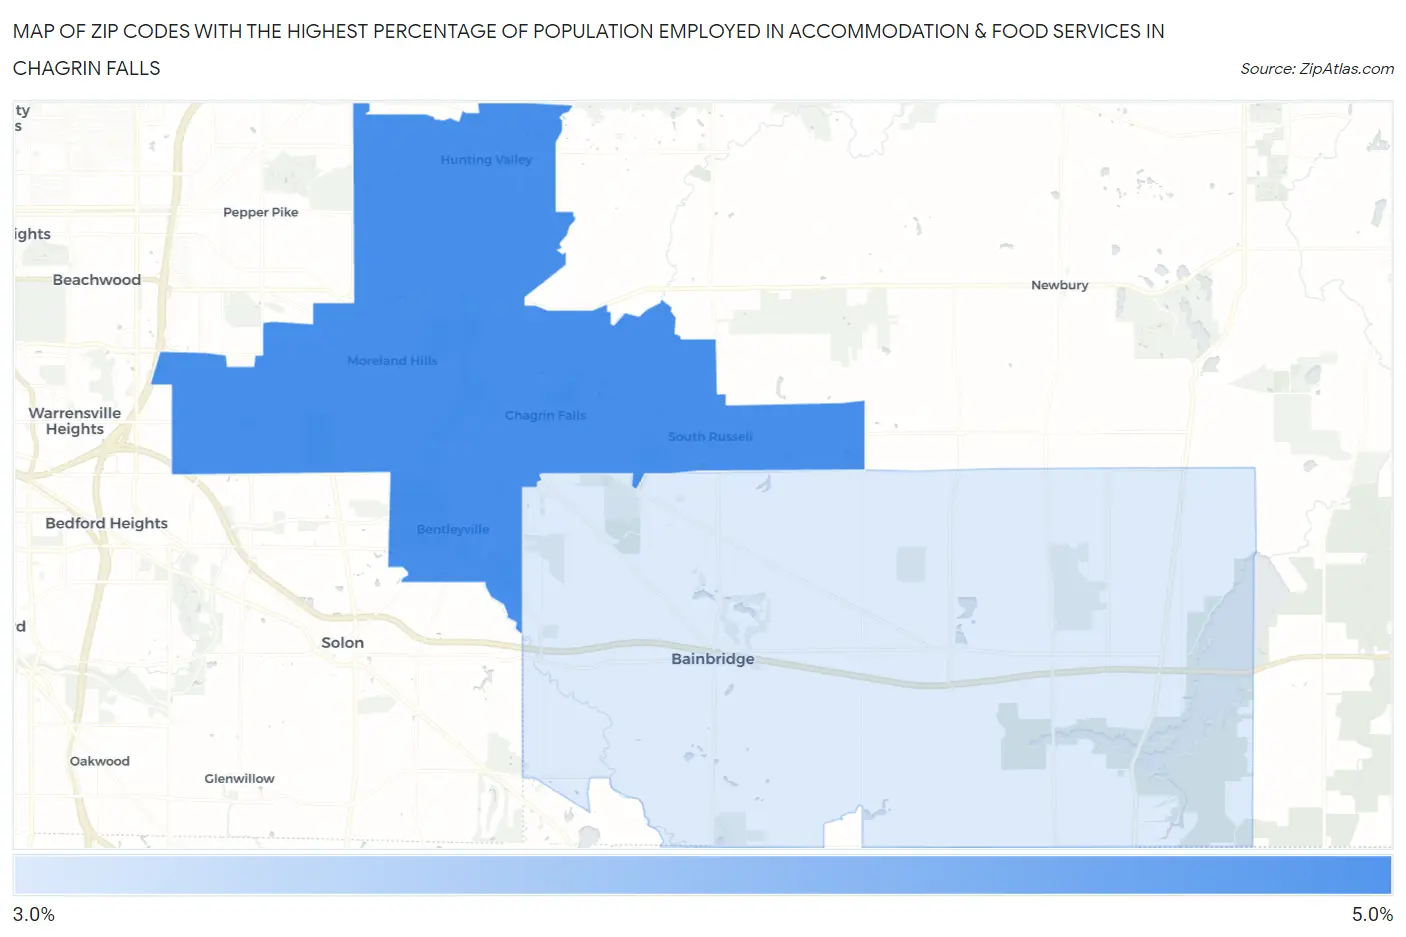
Map of Zip Codes with the Highest Percentage of Population Employed in Accommodation & Food Services in Chagrin Falls
0.0%
5.0%
Zip Codes with the Highest Percentage of Population Employed in Accommodation & Food Services in Chagrin Falls, OH
| Zip Code | % Employed | vs State | vs National | |
| 1. | 44022 | 4.7% | 7.0%(-2.36)#773 | 6.9%(-2.23)#17,977 |
| 2. | 44023 | 3.2% | 7.0%(-3.86)#945 | 6.9%(-3.73)#22,829 |
1
Common Questions
What are the Top Zip Codes with the Highest Percentage of Population Employed in Accommodation & Food Services in Chagrin Falls, OH?
Top Zip Codes with the Highest Percentage of Population Employed in Accommodation & Food Services in Chagrin Falls, OH are:
What zip code has the Highest Percentage of Population Employed in Accommodation & Food Services in Chagrin Falls, OH?
44022 has the Highest Percentage of Population Employed in Accommodation & Food Services in Chagrin Falls, OH with 4.7%.
What is the Percentage of Population Employed in Accommodation & Food Services in Chagrin Falls, OH?
Percentage of Population Employed in Accommodation & Food Services in Chagrin Falls is 3.4%.
What is the Percentage of Population Employed in Accommodation & Food Services in Ohio?
Percentage of Population Employed in Accommodation & Food Services in Ohio is 7.0%.
What is the Percentage of Population Employed in Accommodation & Food Services in the United States?
Percentage of Population Employed in Accommodation & Food Services in the United States is 6.9%.