Zip Codes with the Highest Percentage of Population Employed in Accommodation & Food Services in Dayton, OH

RELATED REPORTS & OPTIONS

Accommodation & Food Services
Population
Families and Households
Female Fertility
Female Fertility (Unmarried)
Race (Community Size)
Race (Percentage)
Ancestry (Community Size)
AfricanAlbanianAlsatianAmericanApacheArabArgentineanArmenianAustralianAustrianBasqueBelgianBhutaneseBlackfeetBolivianBrazilianBritishBulgarianBurmeseCajunCanadianCape VerdeanCelticCentral AmericanCentral American IndianCherokeeChileanChippewaChoctawColombianCosta RicanCreekCroatianCubanCzechCzechoslovakianDanishDominicanDutchEastern EuropeanEcuadorianEgyptianEnglishEstonianEthiopianEuropeanFilipinoFinnishFrenchFrench CanadianGermanGhanaianGreekGuamanian / ChamorroGuatemalanHaitianHonduranHungarianIcelanderIndian (Asian)InupiatIranianIraqiIrishIroquoisItalianJamaicanJapaneseKenyanKoreanLaotianLatvianLebaneseLiberianLithuanianLuxembourgerMacedonianMalteseMexicanMexican American IndianMoroccanNative HawaiianNavajoNicaraguanNigerianNorthern EuropeanNorwegianOkinawanPakistaniPalestinianPanamanianPennsylvania GermanPeruvianPolishPortuguesePotawatomiPuerto RicanRomanianRussianSalvadoranSamoanScandinavianScotch-IrishScottishSeminoleSenegaleseSerbianSiouxSlavicSlovakSloveneSouth AfricanSouth AmericanSpaniardSpanishSri LankanSubsaharan AfricanSudaneseSwedishSwissSyrianThaiTrinidadian and TobagonianTurkishUkrainianVenezuelanWelshWest IndianYugoslavian
Ancestry (Percentage)
AfricanAlbanianAlsatianAmericanApacheArabArgentineanArmenianAustralianAustrianBasqueBelgianBhutaneseBlackfeetBolivianBrazilianBritishBulgarianBurmeseCajunCanadianCape VerdeanCelticCentral AmericanCentral American IndianCherokeeChileanChippewaChoctawColombianCosta RicanCreekCroatianCubanCzechCzechoslovakianDanishDominicanDutchEastern EuropeanEcuadorianEgyptianEnglishEstonianEthiopianEuropeanFilipinoFinnishFrenchFrench CanadianGermanGhanaianGreekGuamanian / ChamorroGuatemalanHaitianHonduranHungarianIcelanderIndian (Asian)InupiatIranianIraqiIrishIroquoisItalianJamaicanJapaneseKenyanKoreanLaotianLatvianLebaneseLiberianLithuanianLuxembourgerMacedonianMalteseMexicanMexican American IndianMoroccanNative HawaiianNavajoNicaraguanNigerianNorthern EuropeanNorwegianOkinawanPakistaniPalestinianPanamanianPennsylvania GermanPeruvianPolishPortuguesePotawatomiPuerto RicanRomanianRussianSalvadoranSamoanScandinavianScotch-IrishScottishSeminoleSenegaleseSerbianSiouxSlavicSlovakSloveneSouth AfricanSouth AmericanSpaniardSpanishSri LankanSubsaharan AfricanSudaneseSwedishSwissSyrianThaiTrinidadian and TobagonianTurkishUkrainianVenezuelanWelshWest IndianYugoslavian
Immigrant Origin (Total)
AfricaArgentinaAsiaAustraliaBelarusBosnia and HerzegovinaBrazilBulgariaCambodiaCameroonCanadaCaribbeanCentral AmericaChinaColombiaCongoCosta RicaCubaDominican RepublicEastern AfricaEastern AsiaEastern EuropeEcuadorEgyptEl SalvadorEnglandEthiopiaEuropeFranceGermanyGhanaGreeceGuatemalaGuyanaHaitiHondurasHong KongHungaryIndiaIndonesiaIranIraqIrelandIsraelItalyJamaicaJapanJordanKenyaKoreaKuwaitLatin AmericaLebanonLiberiaMalaysiaMexicoMiddle AfricaMoldovaMoroccoNetherlandsNigeriaNorthern AfricaNorthern EuropeNorwayOceaniaPakistanPanamaPeruPhilippinesPolandPortugalRomaniaRussiaSaudi ArabiaScotlandSenegalSingaporeSouth AfricaSouth AmericaSouth Central AsiaSouth Eastern AsiaSouthern EuropeSpainSudanTaiwanThailandTrinidad and TobagoTurkeyUkraineUzbekistanVenezuelaVietnamWestern AfricaWestern AsiaWestern EuropeZaire
Immigrant Origin (Percentage)
AfricaArgentinaAsiaAustraliaBelarusBosnia and HerzegovinaBrazilBulgariaCambodiaCameroonCanadaCaribbeanCentral AmericaChinaColombiaCongoCosta RicaCubaDominican RepublicEastern AfricaEastern AsiaEastern EuropeEcuadorEgyptEl SalvadorEnglandEthiopiaEuropeFranceGermanyGhanaGreeceGuatemalaGuyanaHaitiHondurasHong KongHungaryIndiaIndonesiaIranIraqIrelandIsraelItalyJamaicaJapanJordanKenyaKoreaKuwaitLatin AmericaLebanonLiberiaMalaysiaMexicoMiddle AfricaMoldovaMoroccoNetherlandsNigeriaNorthern AfricaNorthern EuropeNorwayOceaniaPakistanPanamaPeruPhilippinesPolandPortugalRomaniaRussiaSaudi ArabiaScotlandSenegalSingaporeSouth AfricaSouth AmericaSouth Central AsiaSouth Eastern AsiaSouthern EuropeSpainSudanTaiwanThailandTrinidad and TobagoTurkeyUkraineUzbekistanVenezuelaVietnamWestern AfricaWestern AsiaWestern EuropeZaire
Income
Income (Families)
Income (Households)
Poverty
Poverty (Families)
Unemployment
Employment Occupations
Employment Industries
Employer Class
Commute Time
Commute Means
School Enrollment
Education by Degree Field
Occupancy
Finances
Physical Characteristics
Dayton
Compare Zip Codes
Comparison Subject

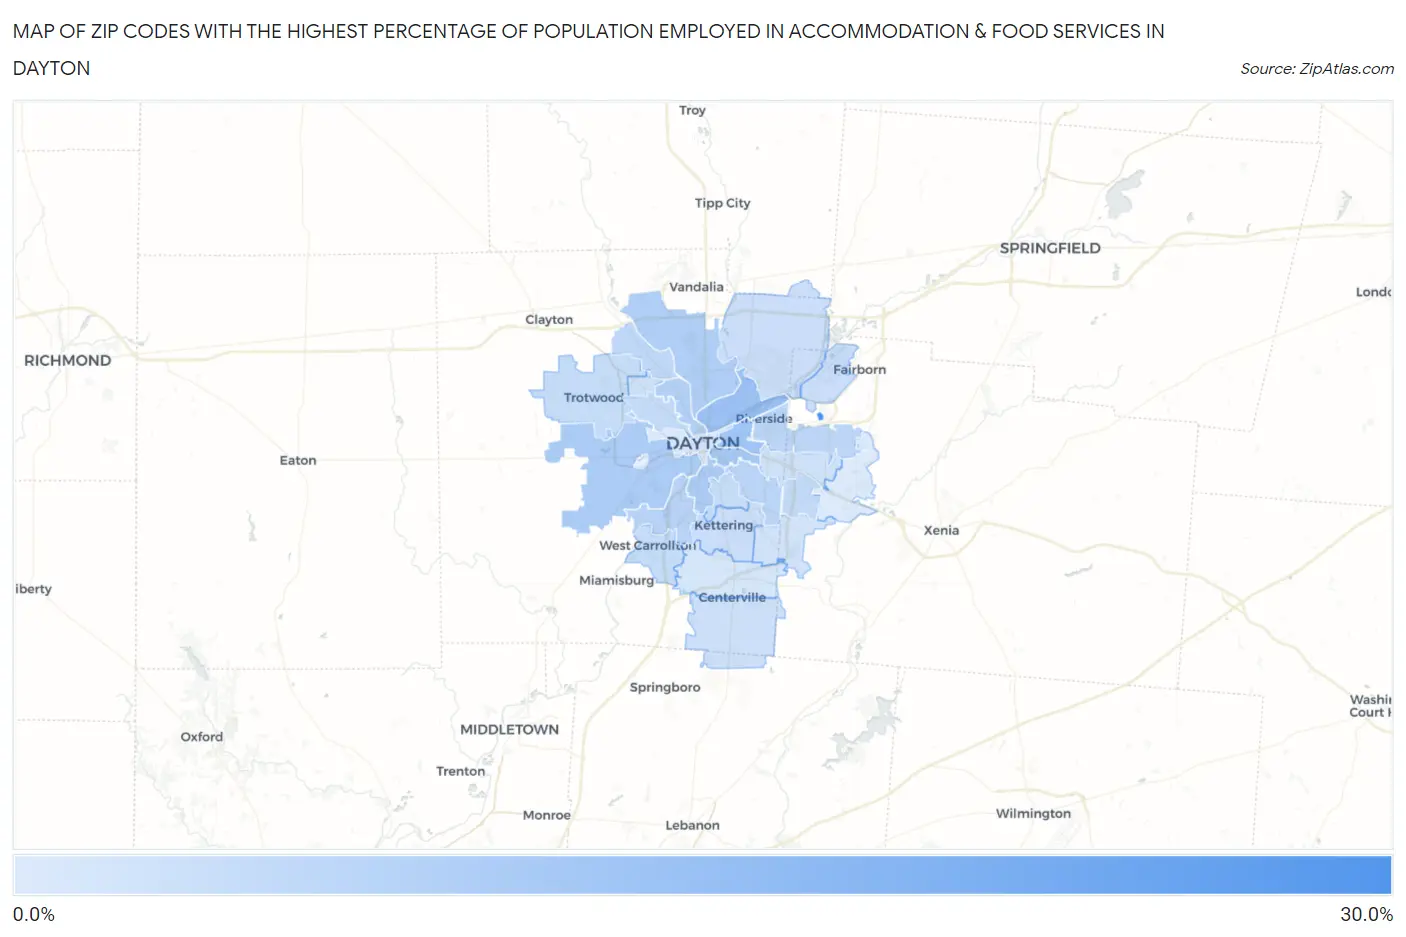
Map of Zip Codes with the Highest Percentage of Population Employed in Accommodation & Food Services in Dayton

0.0%
30.0%
Zip Codes with the Highest Percentage of Population Employed in Accommodation & Food Services in Dayton Map

Zip Codes with the Highest Percentage of Population Employed in Accommodation & Food Services in Dayton, OH

Zip Code % Employed vs State vs National
1.4543525.4%7.0%(+18.4)#206.9%(+18.5)#487
2.4540412.9%7.0%(+5.93)#936.9%(+6.06)#2,366
3.4540312.1%7.0%(+5.05)#1096.9%(+5.17)#2,801
4.4541011.2%7.0%(+4.24)#1356.9%(+4.37)#3,363
5.4541710.4%7.0%(+3.35)#1776.9%(+3.47)#4,146
6.4540910.3%7.0%(+3.29)#1796.9%(+3.42)#4,199
7.454149.9%7.0%(+2.93)#2026.9%(+3.06)#4,614
8.454059.5%7.0%(+2.49)#2286.9%(+2.62)#5,211
9.454398.8%7.0%(+1.77)#2896.9%(+1.90)#6,332
10.454208.4%7.0%(+1.38)#3176.9%(+1.51)#7,006
11.454318.3%7.0%(+1.29)#3276.9%(+1.42)#7,226
12.454158.0%7.0%(+0.985)#3506.9%(+1.11)#7,832
13.454067.4%7.0%(+0.420)#4116.9%(+0.547)#9,177
14.454307.4%7.0%(+0.350)#4186.9%(+0.478)#9,353
15.454497.0%7.0%(-0.043)#4636.9%(+0.084)#10,425
16.454267.0%7.0%(-0.057)#4676.9%(+0.070)#10,466
17.454196.9%7.0%(-0.140)#4716.9%(-0.012)#10,663
18.454696.8%7.0%(-0.229)#4866.9%(-0.101)#10,953
19.454296.5%7.0%(-0.535)#5376.9%(-0.407)#11,932
20.454246.4%7.0%(-0.624)#5546.9%(-0.496)#12,206
21.454336.3%7.0%(-0.726)#5656.9%(-0.598)#12,539
22.454586.0%7.0%(-1.04)#6046.9%(-0.910)#13,528
23.454325.9%7.0%(-1.15)#6216.9%(-1.02)#13,915
24.454165.8%7.0%(-1.24)#6326.9%(-1.11)#14,151
25.454405.4%7.0%(-1.59)#6766.9%(-1.46)#15,334
26.454595.0%7.0%(-2.06)#7376.9%(-1.93)#16,975
27.454024.2%7.0%(-2.82)#8386.9%(-2.70)#19,552
28.454344.0%7.0%(-3.05)#8586.9%(-2.92)#20,293

Common Questions

What are the Top 10 Zip Codes with the Highest Percentage of Population Employed in Accommodation & Food Services in Dayton, OH?
Top 10 Zip Codes with the Highest Percentage of Population Employed in Accommodation & Food Services in Dayton, OH are:
#1
25.4%
#2
12.9%
#3
12.1%
#4
11.2%
#5
10.4%
#6
10.3%
#7
9.9%
#8
9.5%
#9
8.8%
#10
8.4%
What zip code has the Highest Percentage of Population Employed in Accommodation & Food Services in Dayton, OH?
45435 has the Highest Percentage of Population Employed in Accommodation & Food Services in Dayton, OH with 25.4%.
What is the Percentage of Population Employed in Accommodation & Food Services in Dayton, OH?
Percentage of Population Employed in Accommodation & Food Services in Dayton is 9.7%.
What is the Percentage of Population Employed in Accommodation & Food Services in Ohio?
Percentage of Population Employed in Accommodation & Food Services in Ohio is 7.0%.
What is the Percentage of Population Employed in Accommodation & Food Services in the United States?
Percentage of Population Employed in Accommodation & Food Services in the United States is 6.9%.