Zip Codes with the Highest Percentage of Population Employed in Accommodation & Food Services in Cincinnati, OH
RELATED REPORTS & OPTIONS
Accommodation & Food Services
Cincinnati
Compare Zip Codes
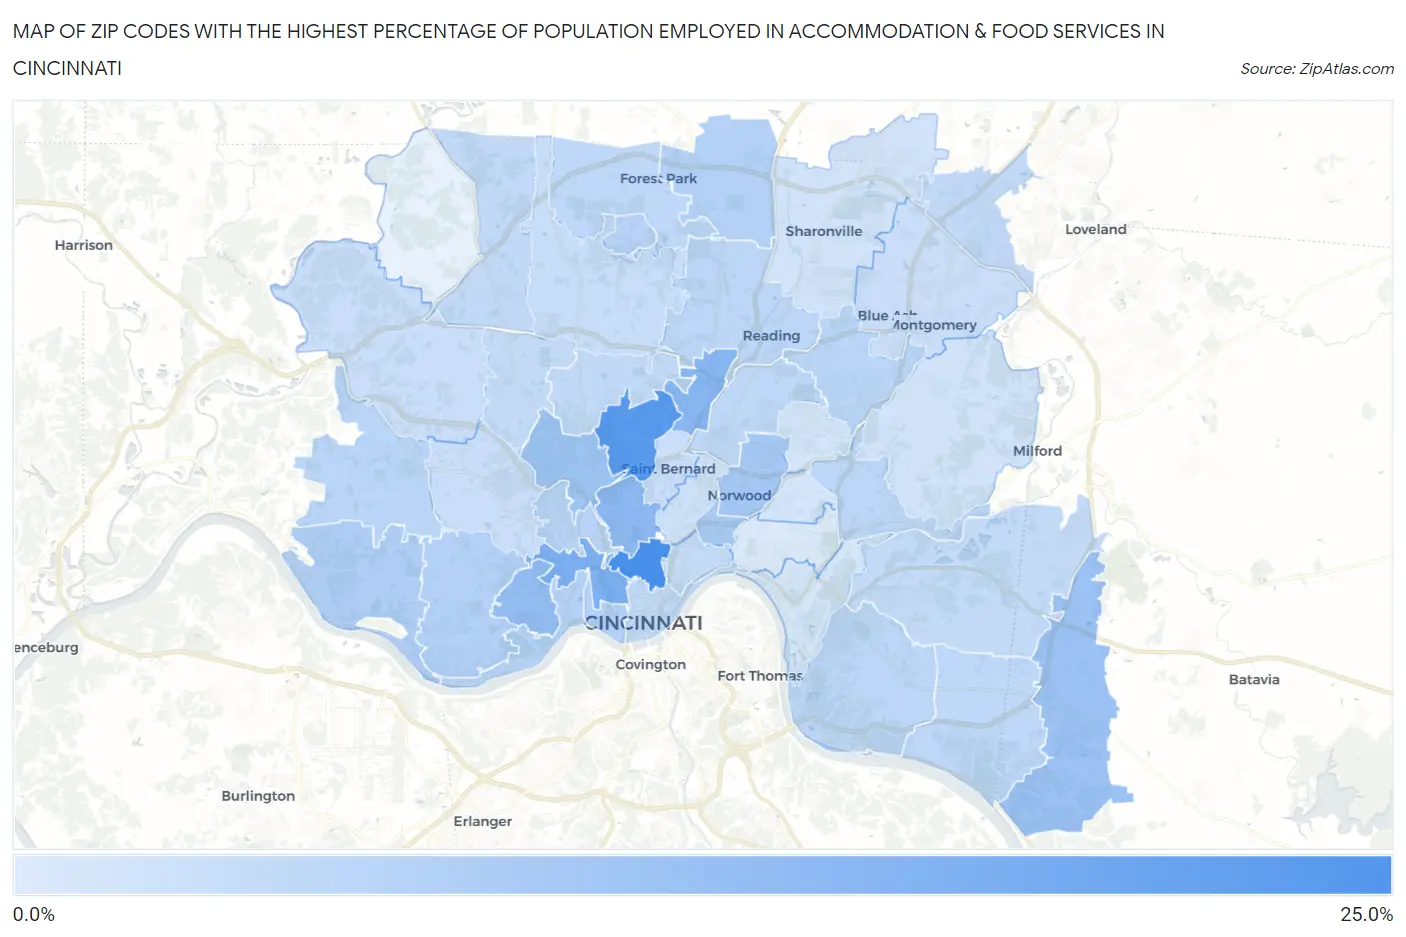
Map of Zip Codes with the Highest Percentage of Population Employed in Accommodation & Food Services in Cincinnati
0.0%
25.0%
Zip Codes with the Highest Percentage of Population Employed in Accommodation & Food Services in Cincinnati, OH
| Zip Code | % Employed | vs State | vs National | |
| 1. | 45219 | 23.9% | 7.0%(+16.9)#25 | 6.9%(+17.0)#567 |
| 2. | 45232 | 21.2% | 7.0%(+14.2)#33 | 6.9%(+14.3)#734 |
| 3. | 45214 | 15.8% | 7.0%(+8.79)#50 | 6.9%(+8.92)#1,494 |
| 4. | 45216 | 14.1% | 7.0%(+7.14)#71 | 6.9%(+7.27)#1,918 |
| 5. | 45220 | 13.6% | 7.0%(+6.61)#75 | 6.9%(+6.73)#2,085 |
| 6. | 45205 | 12.6% | 7.0%(+5.61)#98 | 6.9%(+5.74)#2,519 |
| 7. | 45245 | 11.6% | 7.0%(+4.63)#118 | 6.9%(+4.76)#3,065 |
| 8. | 45223 | 11.0% | 7.0%(+3.98)#144 | 6.9%(+4.11)#3,560 |
| 9. | 45212 | 10.0% | 7.0%(+2.98)#199 | 6.9%(+3.11)#4,561 |
| 10. | 45207 | 9.9% | 7.0%(+2.85)#208 | 6.9%(+2.98)#4,713 |
| 11. | 45233 | 8.9% | 7.0%(+1.91)#271 | 6.9%(+2.04)#6,100 |
| 12. | 45238 | 8.2% | 7.0%(+1.16)#333 | 6.9%(+1.29)#7,495 |
| 13. | 45246 | 8.2% | 7.0%(+1.14)#335 | 6.9%(+1.27)#7,529 |
| 14. | 45203 | 8.1% | 7.0%(+1.10)#338 | 6.9%(+1.22)#7,617 |
| 15. | 45204 | 7.7% | 7.0%(+0.729)#379 | 6.9%(+0.857)#8,401 |
| 16. | 45218 | 7.6% | 7.0%(+0.586)#394 | 6.9%(+0.714)#8,756 |
| 17. | 45225 | 7.5% | 7.0%(+0.491)#402 | 6.9%(+0.619)#8,991 |
| 18. | 45248 | 7.3% | 7.0%(+0.296)#424 | 6.9%(+0.423)#9,500 |
| 19. | 45236 | 7.2% | 7.0%(+0.194)#439 | 6.9%(+0.321)#9,805 |
| 20. | 45215 | 7.0% | 7.0%(+0.028)#454 | 6.9%(+0.156)#10,209 |
| 21. | 45227 | 7.0% | 7.0%(+0.020)#456 | 6.9%(+0.148)#10,231 |
| 22. | 45230 | 6.8% | 7.0%(-0.230)#487 | 6.9%(-0.103)#10,958 |
| 23. | 45237 | 6.7% | 7.0%(-0.284)#500 | 6.9%(-0.156)#11,127 |
| 24. | 45240 | 6.5% | 7.0%(-0.550)#541 | 6.9%(-0.423)#11,977 |
| 25. | 45255 | 6.5% | 7.0%(-0.557)#542 | 6.9%(-0.429)#11,992 |
| 26. | 45224 | 6.4% | 7.0%(-0.589)#549 | 6.9%(-0.461)#12,091 |
| 27. | 45251 | 6.2% | 7.0%(-0.783)#572 | 6.9%(-0.655)#12,711 |
| 28. | 45249 | 6.2% | 7.0%(-0.796)#575 | 6.9%(-0.668)#12,754 |
| 29. | 45202 | 6.2% | 7.0%(-0.851)#582 | 6.9%(-0.723)#12,941 |
| 30. | 45244 | 6.0% | 7.0%(-0.999)#599 | 6.9%(-0.872)#13,416 |
| 31. | 45239 | 5.9% | 7.0%(-1.06)#608 | 6.9%(-0.933)#13,610 |
| 32. | 45206 | 5.6% | 7.0%(-1.45)#651 | 6.9%(-1.32)#14,853 |
| 33. | 45231 | 5.5% | 7.0%(-1.56)#665 | 6.9%(-1.43)#15,214 |
| 34. | 45211 | 5.2% | 7.0%(-1.82)#706 | 6.9%(-1.69)#16,133 |
| 35. | 45217 | 5.2% | 7.0%(-1.83)#708 | 6.9%(-1.70)#16,177 |
| 36. | 45247 | 5.1% | 7.0%(-1.87)#713 | 6.9%(-1.74)#16,326 |
| 37. | 45242 | 5.1% | 7.0%(-1.91)#718 | 6.9%(-1.78)#16,478 |
| 38. | 45229 | 4.3% | 7.0%(-2.66)#815 | 6.9%(-2.54)#19,025 |
| 39. | 45243 | 4.2% | 7.0%(-2.80)#834 | 6.9%(-2.68)#19,486 |
| 40. | 45241 | 4.1% | 7.0%(-2.93)#843 | 6.9%(-2.80)#19,864 |
| 41. | 45213 | 3.8% | 7.0%(-3.19)#875 | 6.9%(-3.06)#20,734 |
| 42. | 45209 | 3.7% | 7.0%(-3.30)#886 | 6.9%(-3.17)#21,073 |
| 43. | 45226 | 3.7% | 7.0%(-3.31)#890 | 6.9%(-3.18)#21,140 |
| 44. | 45208 | 2.7% | 7.0%(-4.34)#984 | 6.9%(-4.21)#24,083 |
1
Common Questions
What are the Top 10 Zip Codes with the Highest Percentage of Population Employed in Accommodation & Food Services in Cincinnati, OH?
Top 10 Zip Codes with the Highest Percentage of Population Employed in Accommodation & Food Services in Cincinnati, OH are:
What zip code has the Highest Percentage of Population Employed in Accommodation & Food Services in Cincinnati, OH?
45219 has the Highest Percentage of Population Employed in Accommodation & Food Services in Cincinnati, OH with 23.9%.
What is the Percentage of Population Employed in Accommodation & Food Services in Cincinnati, OH?
Percentage of Population Employed in Accommodation & Food Services in Cincinnati is 8.5%.
What is the Percentage of Population Employed in Accommodation & Food Services in Ohio?
Percentage of Population Employed in Accommodation & Food Services in Ohio is 7.0%.
What is the Percentage of Population Employed in Accommodation & Food Services in the United States?
Percentage of Population Employed in Accommodation & Food Services in the United States is 6.9%.