Zip Codes with the Highest Percentage of Population Employed in Accommodation & Food Services in Lima, OH
RELATED REPORTS & OPTIONS
Accommodation & Food Services
Lima
Compare Zip Codes
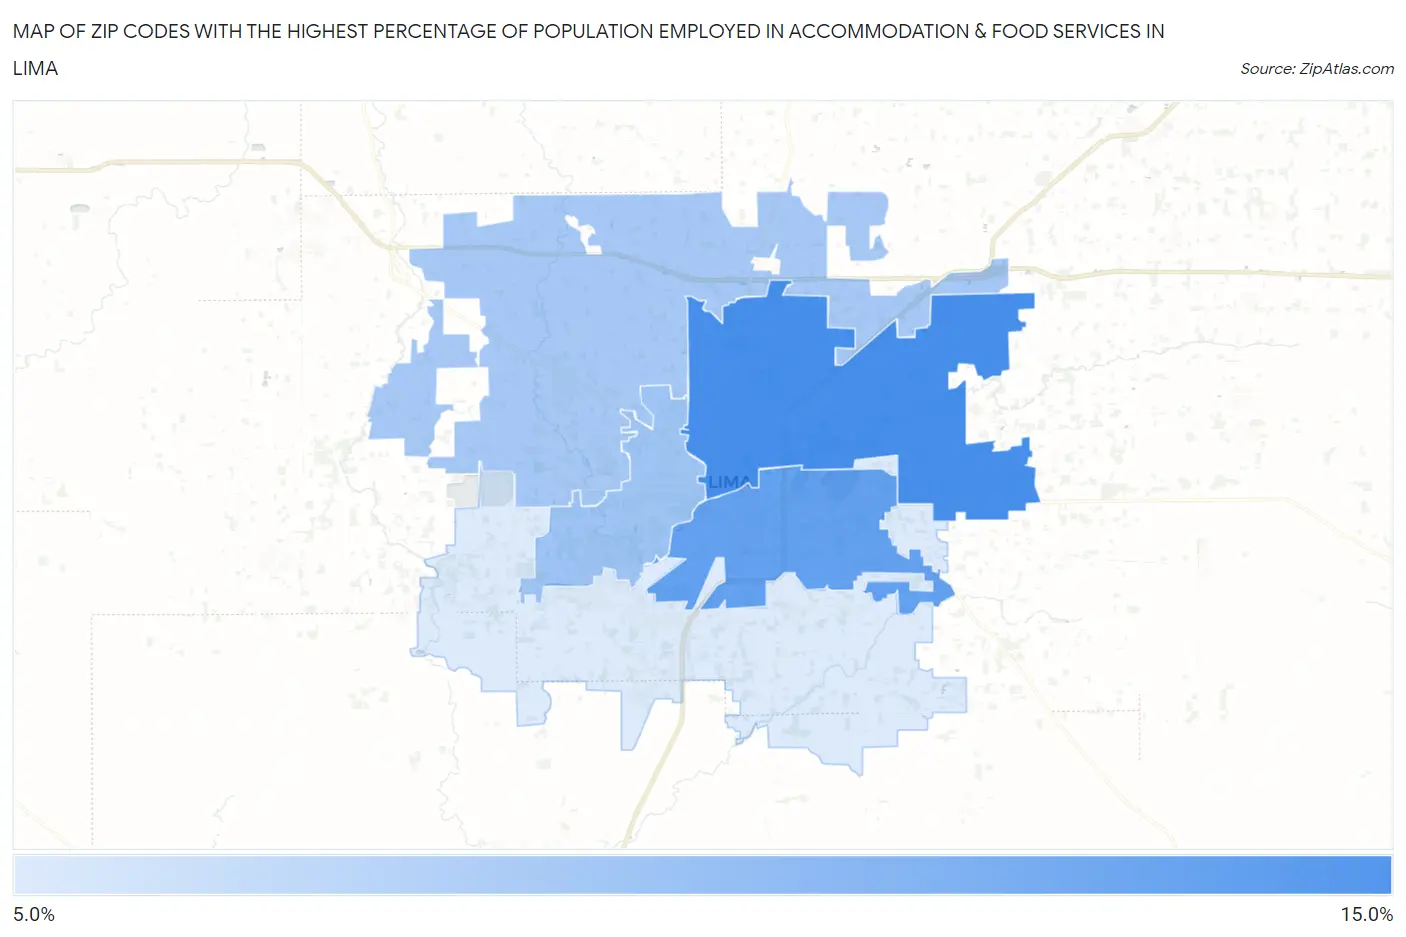
Map of Zip Codes with the Highest Percentage of Population Employed in Accommodation & Food Services in Lima
0.0%
15.0%
Zip Codes with the Highest Percentage of Population Employed in Accommodation & Food Services in Lima, OH
| Zip Code | % Employed | vs State | vs National | |
| 1. | 45801 | 11.4% | 7.0%(+4.35)#129 | 6.9%(+4.48)#3,274 |
| 2. | 45804 | 10.2% | 7.0%(+3.22)#184 | 6.9%(+3.34)#4,277 |
| 3. | 45805 | 7.7% | 7.0%(+0.669)#387 | 6.9%(+0.796)#8,557 |
| 4. | 45807 | 7.4% | 7.0%(+0.429)#410 | 6.9%(+0.556)#9,149 |
| 5. | 45806 | 5.2% | 7.0%(-1.84)#710 | 6.9%(-1.71)#16,188 |
1
Common Questions
What are the Top 3 Zip Codes with the Highest Percentage of Population Employed in Accommodation & Food Services in Lima, OH?
Top 3 Zip Codes with the Highest Percentage of Population Employed in Accommodation & Food Services in Lima, OH are:
What zip code has the Highest Percentage of Population Employed in Accommodation & Food Services in Lima, OH?
45801 has the Highest Percentage of Population Employed in Accommodation & Food Services in Lima, OH with 11.4%.
What is the Percentage of Population Employed in Accommodation & Food Services in Lima, OH?
Percentage of Population Employed in Accommodation & Food Services in Lima is 10.7%.
What is the Percentage of Population Employed in Accommodation & Food Services in Ohio?
Percentage of Population Employed in Accommodation & Food Services in Ohio is 7.0%.
What is the Percentage of Population Employed in Accommodation & Food Services in the United States?
Percentage of Population Employed in Accommodation & Food Services in the United States is 6.9%.