Glen Ullin, ND
Glen Ullin Map
Glen Ullin Overview
739
TOTAL POPULATION
318
MALE POPULATION
421
FEMALE POPULATION
75.53
MALES / 100 FEMALES
132.39
FEMALES / 100 MALES
52.7
MEDIAN AGE
2.7
AVG FAMILY SIZE
1.8
AVG HOUSEHOLD SIZE
$29,160
PER CAPITA INCOME
$68,125
AVG FAMILY INCOME
$43,214
AVG HOUSEHOLD INCOME
45.3%
WAGE / INCOME GAP [ % ]
54.7¢/ $1
WAGE / INCOME GAP [ $ ]
0.42
INEQUALITY / GINI INDEX
282
LABOR FORCE [ PEOPLE ]
46.0%
PERCENT IN LABOR FORCE
7.1%
UNEMPLOYMENT RATE
Glen Ullin Zip Codes
Glen Ullin Area Codes
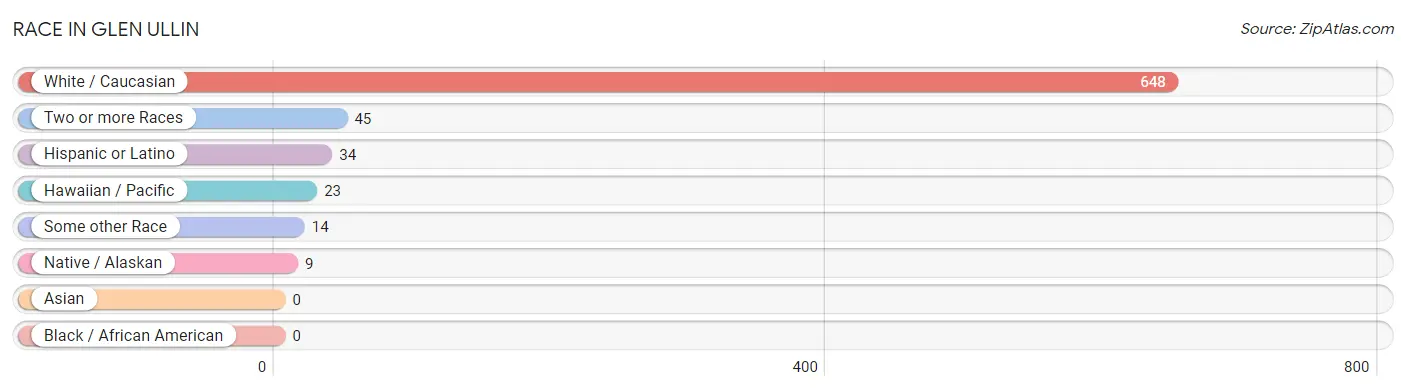
Race in Glen Ullin
The most populous races in Glen Ullin are White / Caucasian (648 | 87.7%), Two or more Races (45 | 6.1%), and Hispanic or Latino (34 | 4.6%).
| Race | # Population | % Population |
| Asian | 0 | 0.0% |
| Black / African American | 0 | 0.0% |
| Hawaiian / Pacific | 23 | 3.1% |
| Hispanic or Latino | 34 | 4.6% |
| Native / Alaskan | 9 | 1.2% |
| White / Caucasian | 648 | 87.7% |
| Two or more Races | 45 | 6.1% |
| Some other Race | 14 | 1.9% |
| Total | 739 | 100.0% |
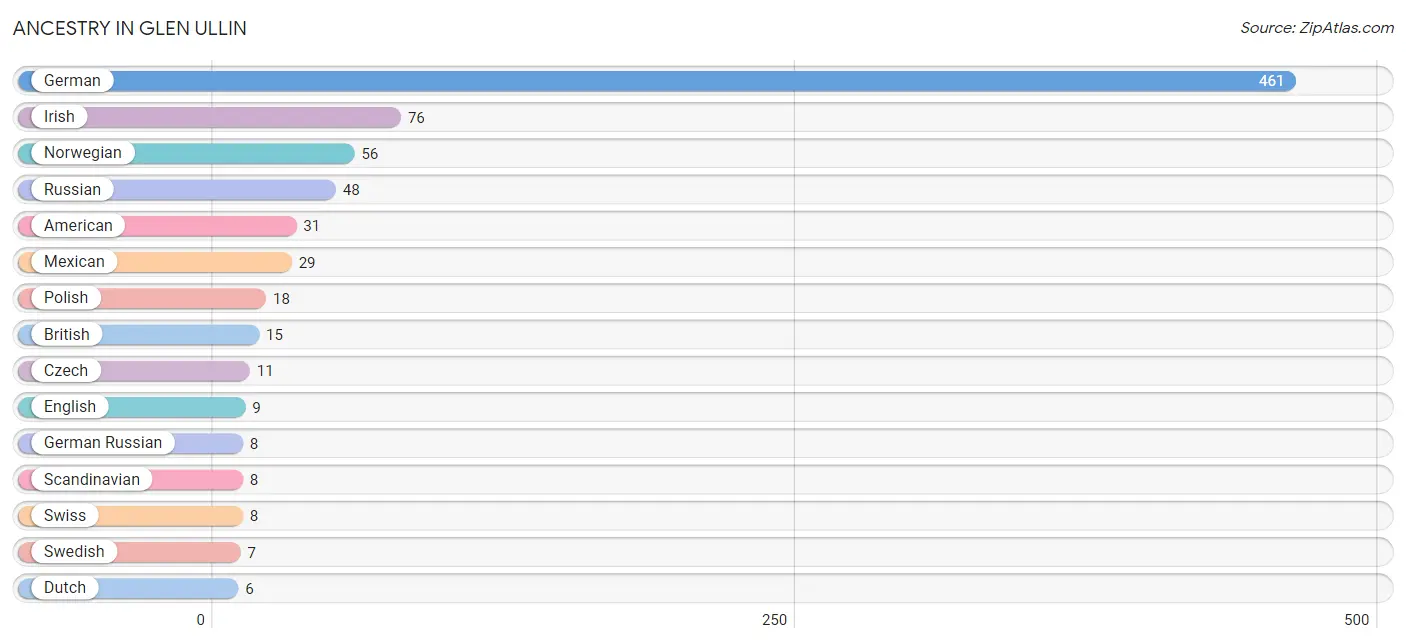
Ancestry in Glen Ullin
The most populous ancestries reported in Glen Ullin are German (461 | 62.4%), Irish (76 | 10.3%), Norwegian (56 | 7.6%), Russian (48 | 6.5%), and American (31 | 4.2%), together accounting for 90.9% of all Glen Ullin residents.
| Ancestry | # Population | % Population |
| American | 31 | 4.2% |
| British | 15 | 2.0% |
| Cherokee | 2 | 0.3% |
| Chippewa | 5 | 0.7% |
| Czech | 11 | 1.5% |
| Dutch | 6 | 0.8% |
| English | 9 | 1.2% |
| European | 1 | 0.1% |
| Finnish | 1 | 0.1% |
| French | 5 | 0.7% |
| French Canadian | 2 | 0.3% |
| German | 461 | 62.4% |
| German Russian | 8 | 1.1% |
| Hungarian | 6 | 0.8% |
| Irish | 76 | 10.3% |
| Italian | 2 | 0.3% |
| Mexican | 29 | 3.9% |
| Norwegian | 56 | 7.6% |
| Polish | 18 | 2.4% |
| Russian | 48 | 6.5% |
| Scandinavian | 8 | 1.1% |
| Scotch-Irish | 3 | 0.4% |
| Spaniard | 5 | 0.7% |
| Swedish | 7 | 0.9% |
| Swiss | 8 | 1.1% |
| Ukrainian | 3 | 0.4% | View All 26 Rows |
Immigrants in Glen Ullin
The most numerous immigrant groups reported in Glen Ullin came from , and Oceania (10 | 1.3%), together accounting for 1.3% of all Glen Ullin residents.

| Immigration Origin | # Population | % Population |
| Oceania | 10 | 1.3% | View All 1 Rows |
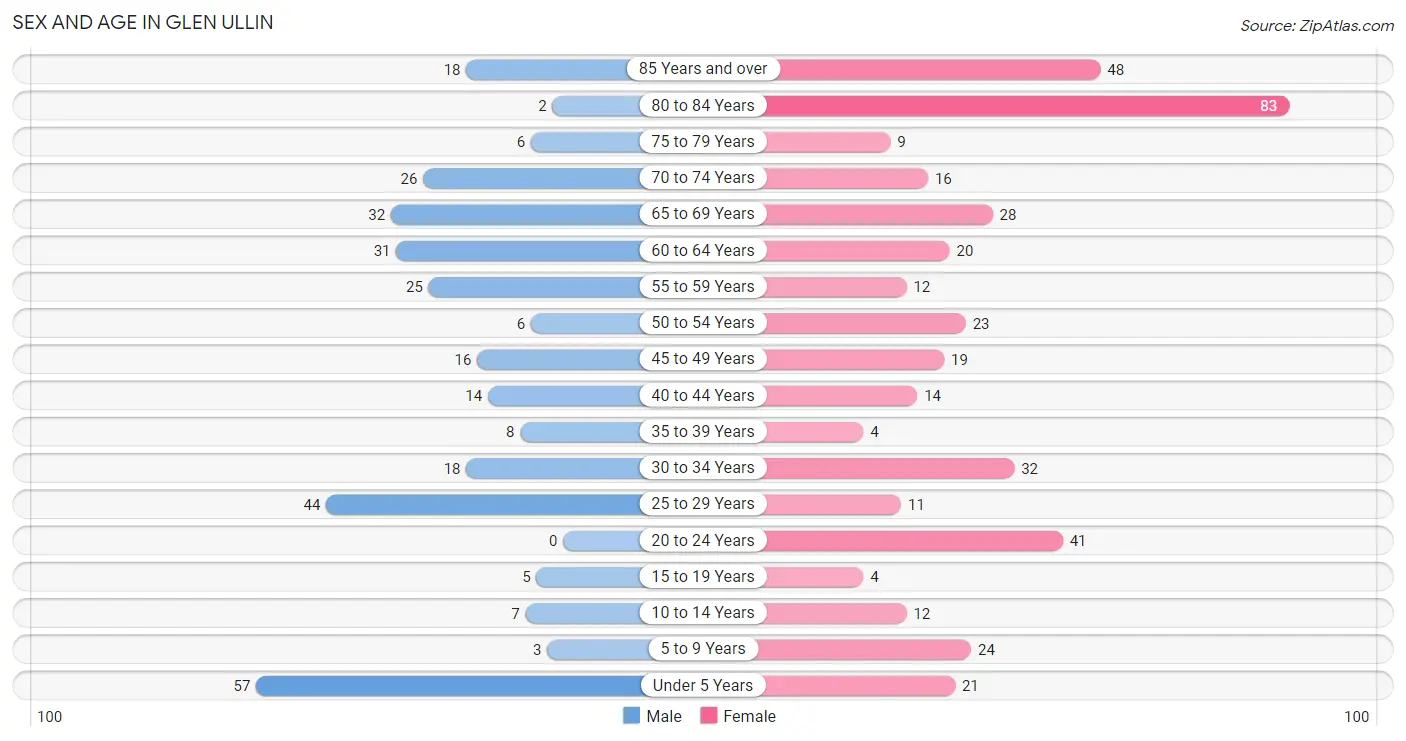
Sex and Age in Glen Ullin
Sex and Age in Glen Ullin
The most populous age groups in Glen Ullin are Under 5 Years (57 | 17.9%) for men and 80 to 84 Years (83 | 19.7%) for women.
| Age Bracket | Male | Female |
| Under 5 Years | 57 (17.9%) | 21 (5.0%) |
| 5 to 9 Years | 3 (0.9%) | 24 (5.7%) |
| 10 to 14 Years | 7 (2.2%) | 12 (2.9%) |
| 15 to 19 Years | 5 (1.6%) | 4 (0.9%) |
| 20 to 24 Years | 0 (0.0%) | 41 (9.7%) |
| 25 to 29 Years | 44 (13.8%) | 11 (2.6%) |
| 30 to 34 Years | 18 (5.7%) | 32 (7.6%) |
| 35 to 39 Years | 8 (2.5%) | 4 (0.9%) |
| 40 to 44 Years | 14 (4.4%) | 14 (3.3%) |
| 45 to 49 Years | 16 (5.0%) | 19 (4.5%) |
| 50 to 54 Years | 6 (1.9%) | 23 (5.5%) |
| 55 to 59 Years | 25 (7.9%) | 12 (2.9%) |
| 60 to 64 Years | 31 (9.8%) | 20 (4.8%) |
| 65 to 69 Years | 32 (10.1%) | 28 (6.7%) |
| 70 to 74 Years | 26 (8.2%) | 16 (3.8%) |
| 75 to 79 Years | 6 (1.9%) | 9 (2.1%) |
| 80 to 84 Years | 2 (0.6%) | 83 (19.7%) |
| 85 Years and over | 18 (5.7%) | 48 (11.4%) |
| Total | 318 (100.0%) | 421 (100.0%) |
Families and Households in Glen Ullin
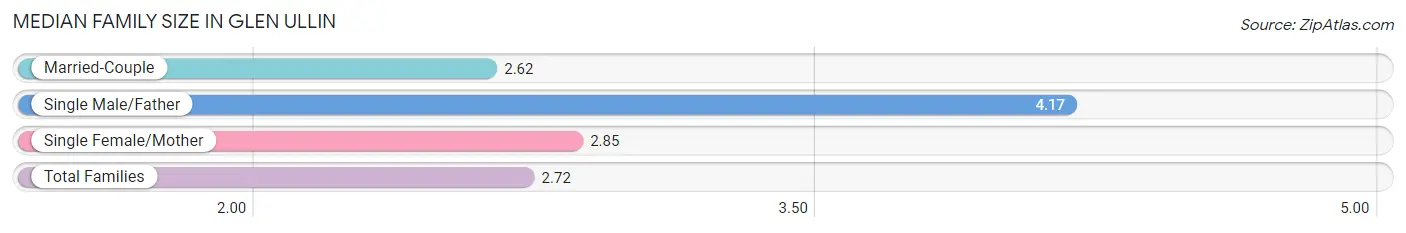
Median Family Size in Glen Ullin
The median family size in Glen Ullin is 2.72 persons per family, with single male/father families (6 | 4.0%) accounting for the largest median family size of 4.17 persons per family. On the other hand, married-couple families (116 | 77.8%) represent the smallest median family size with 2.62 persons per family.
| Family Type | # Families | Family Size |
| Married-Couple | 116 (77.8%) | 2.62 |
| Single Male/Father | 6 (4.0%) | 4.17 |
| Single Female/Mother | 27 (18.1%) | 2.85 |
| Total Families | 149 (100.0%) | 2.72 |
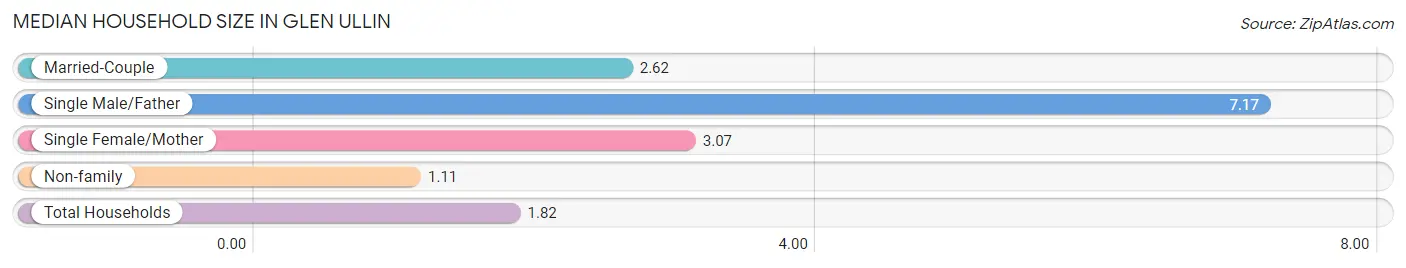
Median Household Size in Glen Ullin
The median household size in Glen Ullin is 1.82 persons per household, with single male/father households (6 | 1.6%) accounting for the largest median household size of 7.17 persons per household. non-family households (223 | 60.0%) represent the smallest median household size with 1.11 persons per household.
| Household Type | # Households | Household Size |
| Married-Couple | 116 (31.2%) | 2.62 |
| Single Male/Father | 6 (1.6%) | 7.17 |
| Single Female/Mother | 27 (7.3%) | 3.07 |
| Non-family | 223 (60.0%) | 1.11 |
| Total Households | 372 (100.0%) | 1.82 |
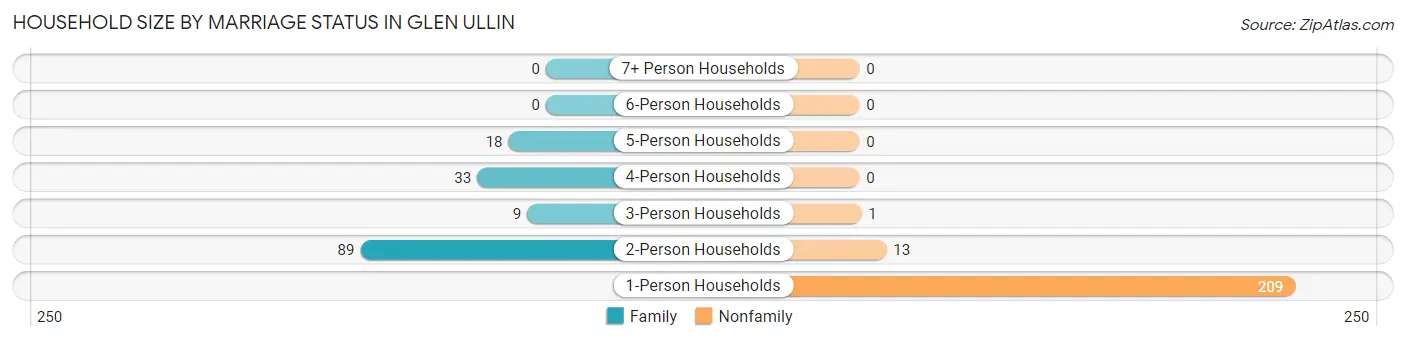
Household Size by Marriage Status in Glen Ullin
Out of a total of 372 households in Glen Ullin, 149 (40.1%) are family households, while 223 (60.0%) are nonfamily households. The most numerous type of family households are 2-person households, comprising 89, and the most common type of nonfamily households are 1-person households, comprising 209.
| Household Size | Family Households | Nonfamily Households |
| 1-Person Households | - | 209 (56.2%) |
| 2-Person Households | 89 (23.9%) | 13 (3.5%) |
| 3-Person Households | 9 (2.4%) | 1 (0.3%) |
| 4-Person Households | 33 (8.9%) | 0 (0.0%) |
| 5-Person Households | 18 (4.8%) | 0 (0.0%) |
| 6-Person Households | 0 (0.0%) | 0 (0.0%) |
| 7+ Person Households | 0 (0.0%) | 0 (0.0%) |
| Total | 149 (40.1%) | 223 (60.0%) |
Female Fertility in Glen Ullin
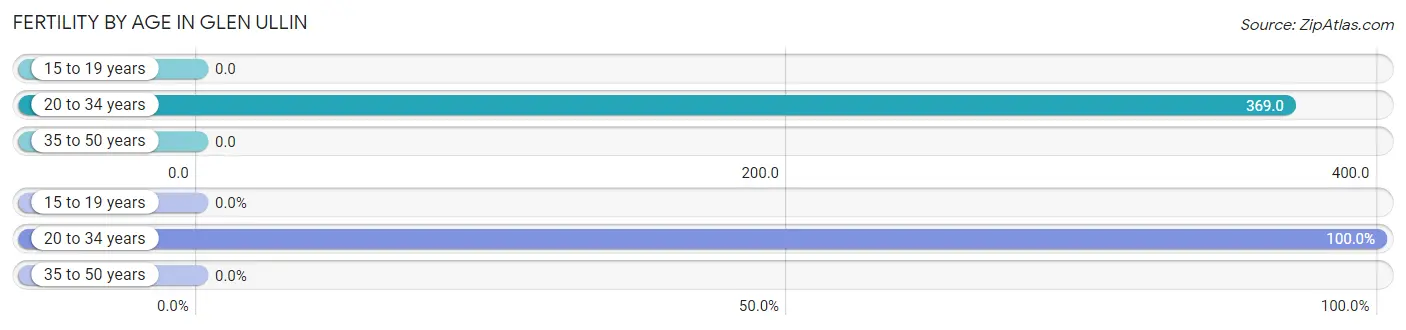
Fertility by Age in Glen Ullin
Average fertility rate in Glen Ullin is 244.0 births per 1,000 women. Women in the age bracket of 20 to 34 years have the highest fertility rate with 369.0 births per 1,000 women. Women in the age bracket of 20 to 34 years acount for 100.0% of all women with births.
| Age Bracket | Women with Births | Births / 1,000 Women |
| 15 to 19 years | 0 (0.0%) | 0.0 |
| 20 to 34 years | 31 (100.0%) | 369.0 |
| 35 to 50 years | 0 (0.0%) | 0.0 |
| Total | 31 (100.0%) | 244.0 |
Fertility by Age by Marriage Status in Glen Ullin
54.8% of women with births (31) in Glen Ullin are married. The highest percentage of unmarried women with births falls into 20 to 34 years age bracket with 45.2% of them unmarried at the time of birth, while the lowest percentage of unmarried women with births belong to 20 to 34 years age bracket with 45.2% of them unmarried.
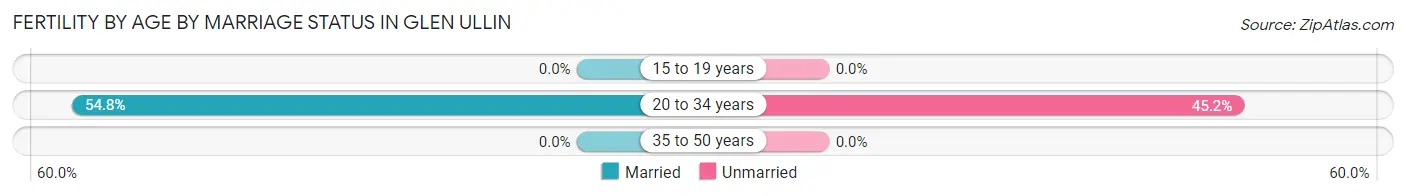
| Age Bracket | Married | Unmarried |
| 15 to 19 years | 0 (0.0%) | 0 (0.0%) |
| 20 to 34 years | 17 (54.8%) | 14 (45.2%) |
| 35 to 50 years | 0 (0.0%) | 0 (0.0%) |
| Total | 17 (54.8%) | 14 (45.2%) |
Fertility by Education in Glen Ullin
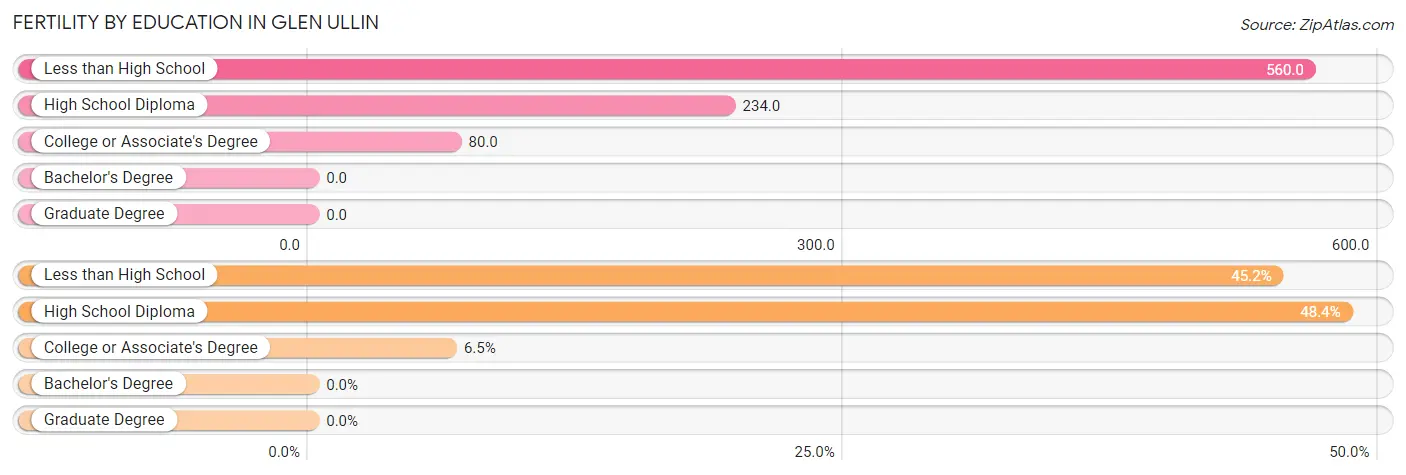
| Educational Attainment | Women with Births | Births / 1,000 Women |
| Less than High School | 14 (45.2%) | 560.0 |
| High School Diploma | 15 (48.4%) | 234.0 |
| College or Associate's Degree | 2 (6.5%) | 80.0 |
| Bachelor's Degree | 0 (0.0%) | 0.0 |
| Graduate Degree | 0 (0.0%) | 0.0 |
| Total | 31 (100.0%) | 244.0 |
Fertility by Education by Marriage Status in Glen Ullin
45.2% of women with births in Glen Ullin are unmarried. Women with the educational attainment of high school diploma are most likely to be married with 100.0% of them married at childbirth, while women with the educational attainment of less than high school are least likely to be married with 100.0% of them unmarried at childbirth.
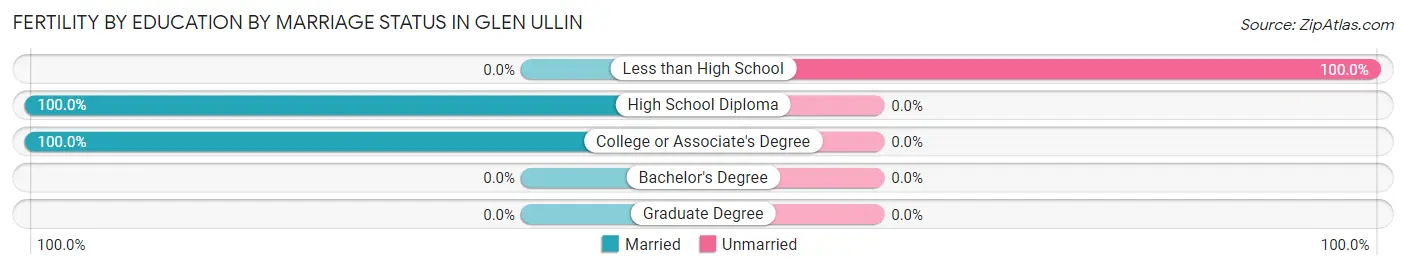
| Educational Attainment | Married | Unmarried |
| Less than High School | 0 (0.0%) | 14 (100.0%) |
| High School Diploma | 15 (100.0%) | 0 (0.0%) |
| College or Associate's Degree | 2 (100.0%) | 0 (0.0%) |
| Bachelor's Degree | 0 (0.0%) | 0 (0.0%) |
| Graduate Degree | 0 (0.0%) | 0 (0.0%) |
| Total | 17 (54.8%) | 14 (45.2%) |
Income in Glen Ullin
Income Overview in Glen Ullin
Per Capita Income in Glen Ullin is $29,160, while median incomes of families and households are $68,125 and $43,214 respectively.
| Characteristic | Number | Measure |
| Per Capita Income | 739 | $29,160 |
| Median Family Income | 149 | $68,125 |
| Mean Family Income | 149 | $81,399 |
| Median Household Income | 372 | $43,214 |
| Mean Household Income | 372 | $57,313 |
| Income Deficit | 149 | $0 |
| Wage / Income Gap (%) | 739 | 45.33% |
| Wage / Income Gap ($) | 739 | 54.67¢ per $1 |
| Gini / Inequality Index | 739 | 0.42 |
Earnings by Sex in Glen Ullin
Average Earnings in Glen Ullin are $34,188, $52,813 for men and $28,875 for women, a difference of 45.3%.
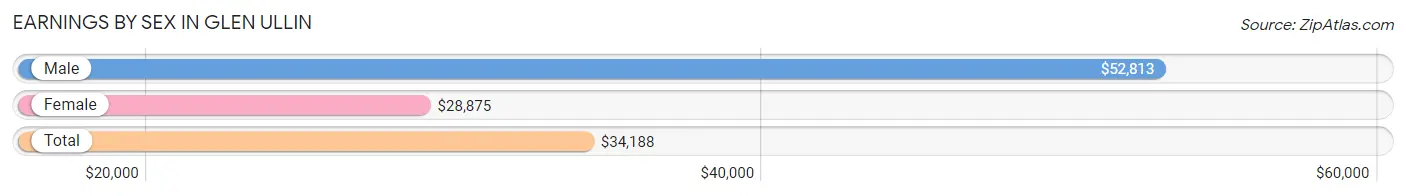
| Sex | Number | Average Earnings |
| Male | 151 (48.5%) | $52,813 |
| Female | 160 (51.4%) | $28,875 |
| Total | 311 (100.0%) | $34,188 |
Earnings by Sex by Income Bracket in Glen Ullin
The most common earnings brackets in Glen Ullin are $100,000+ for men (25 | 16.6%) and $25,000 to $29,999 for women (29 | 18.1%).
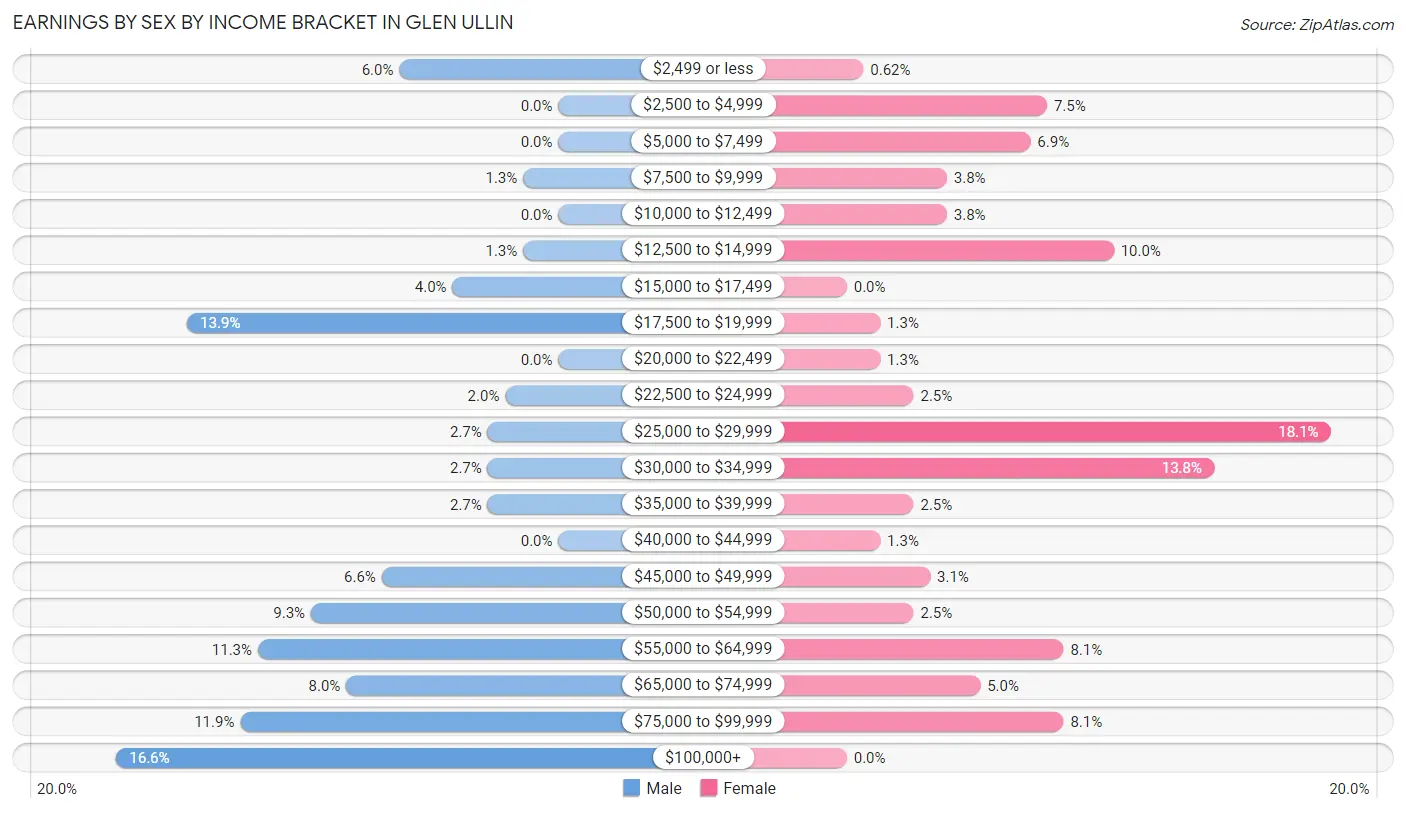
| Income | Male | Female |
| $2,499 or less | 9 (6.0%) | 1 (0.6%) |
| $2,500 to $4,999 | 0 (0.0%) | 12 (7.5%) |
| $5,000 to $7,499 | 0 (0.0%) | 11 (6.9%) |
| $7,500 to $9,999 | 2 (1.3%) | 6 (3.7%) |
| $10,000 to $12,499 | 0 (0.0%) | 6 (3.7%) |
| $12,500 to $14,999 | 2 (1.3%) | 16 (10.0%) |
| $15,000 to $17,499 | 6 (4.0%) | 0 (0.0%) |
| $17,500 to $19,999 | 21 (13.9%) | 2 (1.3%) |
| $20,000 to $22,499 | 0 (0.0%) | 2 (1.3%) |
| $22,500 to $24,999 | 3 (2.0%) | 4 (2.5%) |
| $25,000 to $29,999 | 4 (2.6%) | 29 (18.1%) |
| $30,000 to $34,999 | 4 (2.6%) | 22 (13.8%) |
| $35,000 to $39,999 | 4 (2.6%) | 4 (2.5%) |
| $40,000 to $44,999 | 0 (0.0%) | 2 (1.3%) |
| $45,000 to $49,999 | 10 (6.6%) | 5 (3.1%) |
| $50,000 to $54,999 | 14 (9.3%) | 4 (2.5%) |
| $55,000 to $64,999 | 17 (11.3%) | 13 (8.1%) |
| $65,000 to $74,999 | 12 (8.0%) | 8 (5.0%) |
| $75,000 to $99,999 | 18 (11.9%) | 13 (8.1%) |
| $100,000+ | 25 (16.6%) | 0 (0.0%) |
| Total | 151 (100.0%) | 160 (100.0%) |
Earnings by Sex by Educational Attainment in Glen Ullin
Average earnings in Glen Ullin are $53,125 for men and $30,625 for women, a difference of 42.3%. Men with an educational attainment of college or associate's degree enjoy the highest average annual earnings of $65,000, while those with less than high school education earn the least with $18,393. Women with an educational attainment of college or associate's degree earn the most with the average annual earnings of $38,750, while those with high school diploma education have the smallest earnings of $29,375.
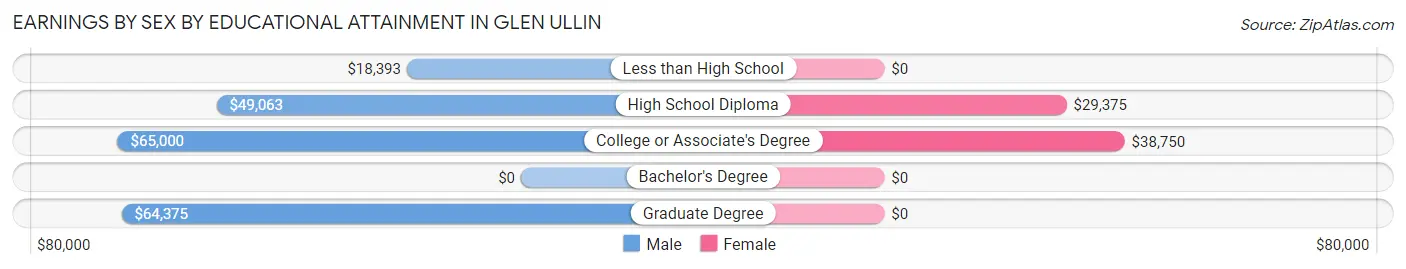
| Educational Attainment | Male Income | Female Income |
| Less than High School | $18,393 | $0 |
| High School Diploma | $49,063 | $29,375 |
| College or Associate's Degree | $65,000 | $38,750 |
| Bachelor's Degree | - | - |
| Graduate Degree | $64,375 | $0 |
| Total | $53,125 | $30,625 |
Family Income in Glen Ullin
Family Income Brackets in Glen Ullin
According to the Glen Ullin family income data, there are 43 families falling into the $100,000 to $149,999 income range, which is the most common income bracket and makes up 28.9% of all families. Conversely, the less than $10,000 income bracket is the least frequent group with only 1 families (0.7%) belonging to this category.
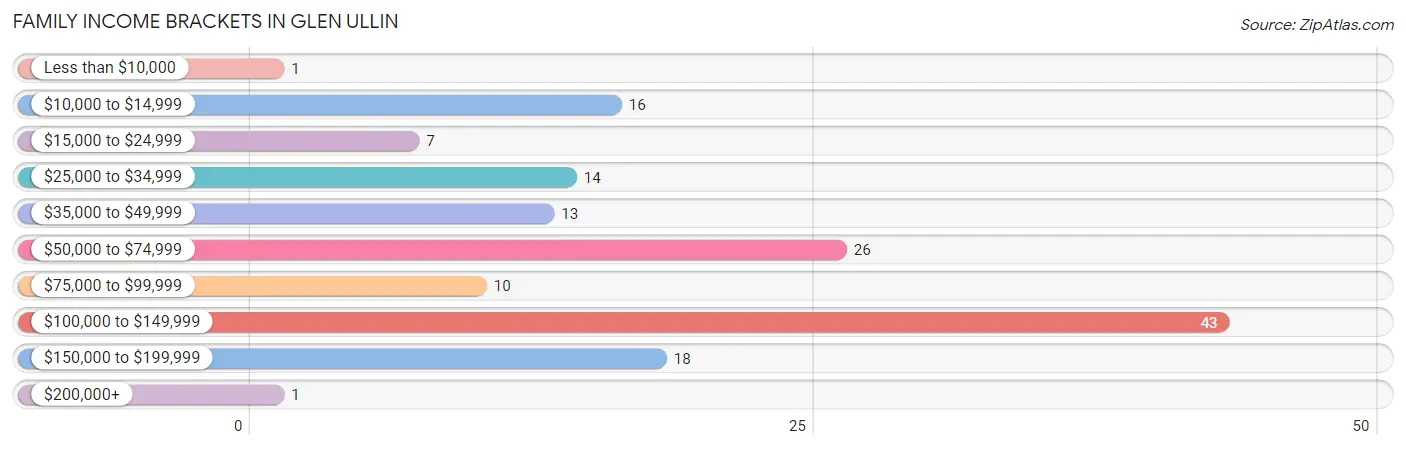
| Income Bracket | # Families | % Families |
| Less than $10,000 | 1 | 0.7% |
| $10,000 to $14,999 | 16 | 10.7% |
| $15,000 to $24,999 | 7 | 4.7% |
| $25,000 to $34,999 | 14 | 9.4% |
| $35,000 to $49,999 | 13 | 8.7% |
| $50,000 to $74,999 | 26 | 17.4% |
| $75,000 to $99,999 | 10 | 6.7% |
| $100,000 to $149,999 | 43 | 28.9% |
| $150,000 to $199,999 | 18 | 12.1% |
| $200,000+ | 1 | 0.7% |
Family Income by Famaliy Size in Glen Ullin
4-person families (19 | 12.8%) account for the highest median family income in Glen Ullin with $138,750 per family, while 4-person families (19 | 12.8%) have the highest median income of $34,688 per family member.
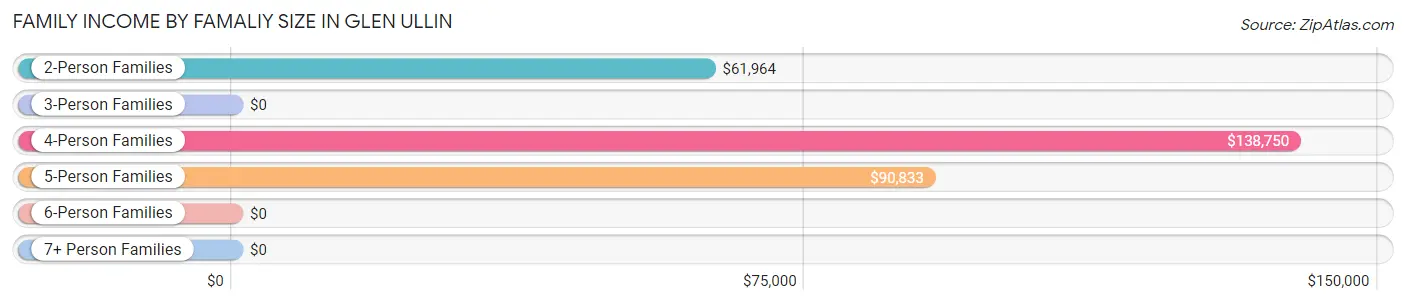
| Income Bracket | # Families | Median Income |
| 2-Person Families | 89 (59.7%) | $61,964 |
| 3-Person Families | 29 (19.5%) | $0 |
| 4-Person Families | 19 (12.8%) | $138,750 |
| 5-Person Families | 12 (8.1%) | $90,833 |
| 6-Person Families | 0 (0.0%) | $0 |
| 7+ Person Families | 0 (0.0%) | $0 |
| Total | 149 (100.0%) | $68,125 |
Family Income by Number of Earners in Glen Ullin
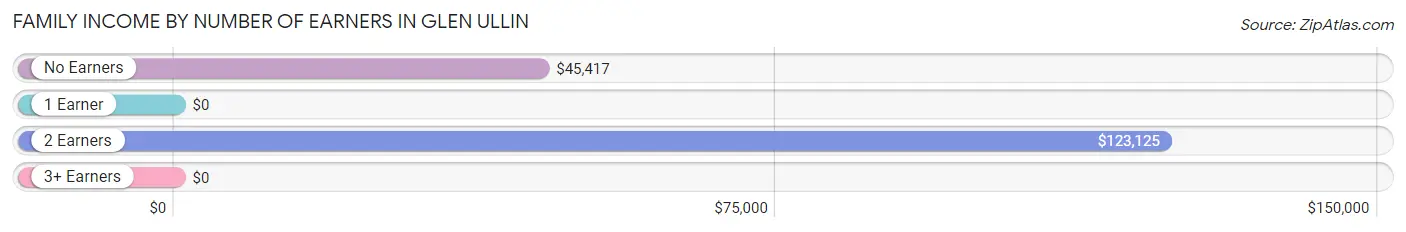
| Number of Earners | # Families | Median Income |
| No Earners | 32 (21.5%) | $45,417 |
| 1 Earner | 52 (34.9%) | $0 |
| 2 Earners | 65 (43.6%) | $123,125 |
| 3+ Earners | 0 (0.0%) | $0 |
| Total | 149 (100.0%) | $68,125 |
Household Income in Glen Ullin
Household Income Brackets in Glen Ullin
With 100 households falling in the category, the $25,000 to $34,999 income range is the most frequent in Glen Ullin, accounting for 26.9% of all households. In contrast, only 3 households (0.8%) fall into the $200,000+ income bracket, making it the least populous group.
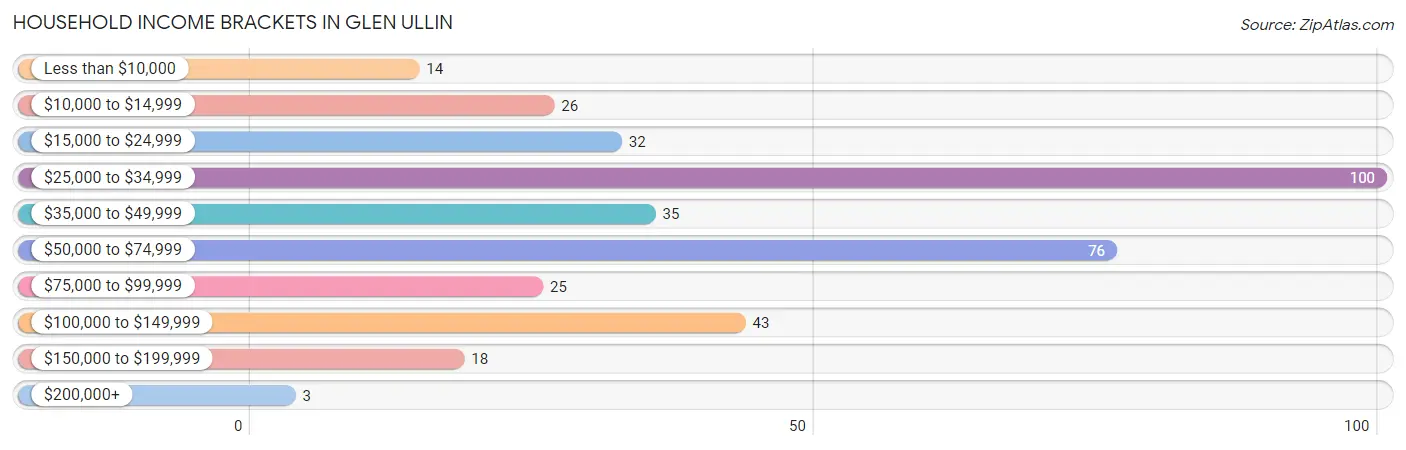
| Income Bracket | # Households | % Households |
| Less than $10,000 | 14 | 3.8% |
| $10,000 to $14,999 | 26 | 7.0% |
| $15,000 to $24,999 | 32 | 8.6% |
| $25,000 to $34,999 | 100 | 26.9% |
| $35,000 to $49,999 | 35 | 9.4% |
| $50,000 to $74,999 | 76 | 20.4% |
| $75,000 to $99,999 | 25 | 6.7% |
| $100,000 to $149,999 | 43 | 11.6% |
| $150,000 to $199,999 | 18 | 4.8% |
| $200,000+ | 3 | 0.8% |
Household Income by Householder Age in Glen Ullin
The median household income in Glen Ullin is $43,214, with the highest median household income of $68,333 found in the 45 to 64 years age bracket for the primary householder. A total of 94 households (25.3%) fall into this category. Meanwhile, the 15 to 24 years age bracket for the primary householder has the lowest median household income of $0, with 18 households (4.8%) in this group.
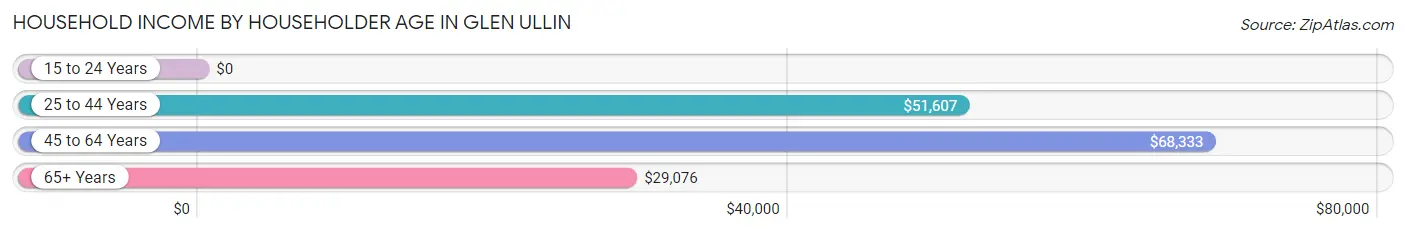
| Income Bracket | # Households | Median Income |
| 15 to 24 Years | 18 (4.8%) | $0 |
| 25 to 44 Years | 87 (23.4%) | $51,607 |
| 45 to 64 Years | 94 (25.3%) | $68,333 |
| 65+ Years | 173 (46.5%) | $29,076 |
| Total | 372 (100.0%) | $43,214 |
Poverty in Glen Ullin
Income Below Poverty by Sex and Age in Glen Ullin
With 22.2% poverty level for males and 16.7% for females among the residents of Glen Ullin, under 5 year old males and 18 to 24 year old females are the most vulnerable to poverty, with 35 males (61.4%) and 37 females (90.2%) in their respective age groups living below the poverty level.
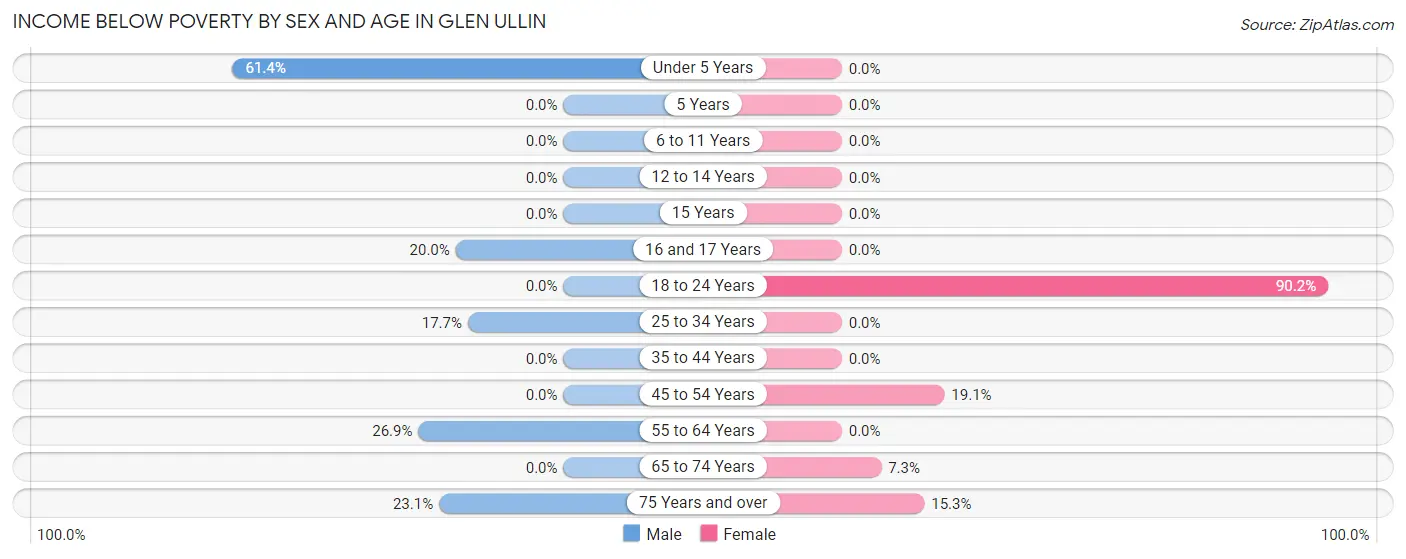
| Age Bracket | Male | Female |
| Under 5 Years | 35 (61.4%) | 0 (0.0%) |
| 5 Years | 0 (0.0%) | 0 (0.0%) |
| 6 to 11 Years | 0 (0.0%) | 0 (0.0%) |
| 12 to 14 Years | 0 (0.0%) | 0 (0.0%) |
| 15 Years | 0 (0.0%) | 0 (0.0%) |
| 16 and 17 Years | 1 (20.0%) | 0 (0.0%) |
| 18 to 24 Years | 0 (0.0%) | 37 (90.2%) |
| 25 to 34 Years | 11 (17.7%) | 0 (0.0%) |
| 35 to 44 Years | 0 (0.0%) | 0 (0.0%) |
| 45 to 54 Years | 0 (0.0%) | 8 (19.1%) |
| 55 to 64 Years | 14 (26.9%) | 0 (0.0%) |
| 65 to 74 Years | 0 (0.0%) | 3 (7.3%) |
| 75 Years and over | 3 (23.1%) | 17 (15.3%) |
| Total | 64 (22.2%) | 65 (16.7%) |
Income Above Poverty by Sex and Age in Glen Ullin
According to the poverty statistics in Glen Ullin, males aged 5 years and females aged under 5 years are the age groups that are most secure financially, with 100.0% of males and 100.0% of females in these age groups living above the poverty line.
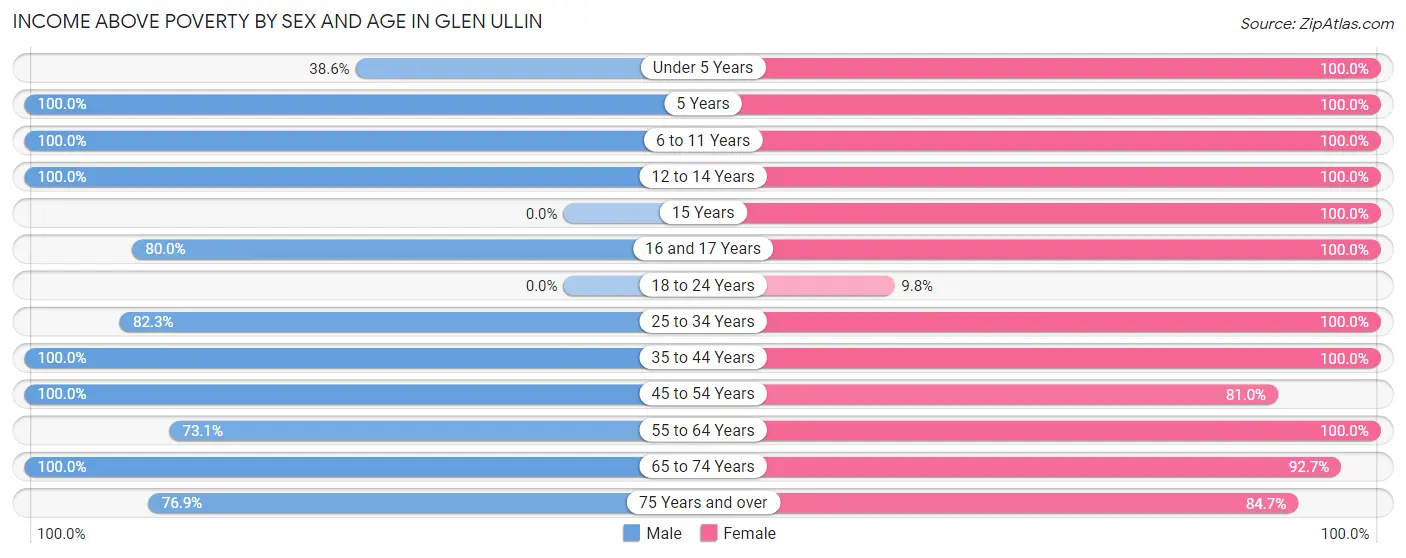
| Age Bracket | Male | Female |
| Under 5 Years | 22 (38.6%) | 21 (100.0%) |
| 5 Years | 1 (100.0%) | 3 (100.0%) |
| 6 to 11 Years | 7 (100.0%) | 26 (100.0%) |
| 12 to 14 Years | 2 (100.0%) | 7 (100.0%) |
| 15 Years | 0 (0.0%) | 2 (100.0%) |
| 16 and 17 Years | 4 (80.0%) | 2 (100.0%) |
| 18 to 24 Years | 0 (0.0%) | 4 (9.8%) |
| 25 to 34 Years | 51 (82.3%) | 43 (100.0%) |
| 35 to 44 Years | 22 (100.0%) | 18 (100.0%) |
| 45 to 54 Years | 22 (100.0%) | 34 (80.9%) |
| 55 to 64 Years | 38 (73.1%) | 32 (100.0%) |
| 65 to 74 Years | 45 (100.0%) | 38 (92.7%) |
| 75 Years and over | 10 (76.9%) | 94 (84.7%) |
| Total | 224 (77.8%) | 324 (83.3%) |
Income Below Poverty Among Married-Couple Families in Glen Ullin
The poverty statistics for married-couple families in Glen Ullin show that 2.6% or 3 of the total 116 families live below the poverty line. Families with no children have the highest poverty rate of 3.7%, comprising of 3 families. On the other hand, families with 1 or 2 children have the lowest poverty rate of 0.0%, which includes 0 families.
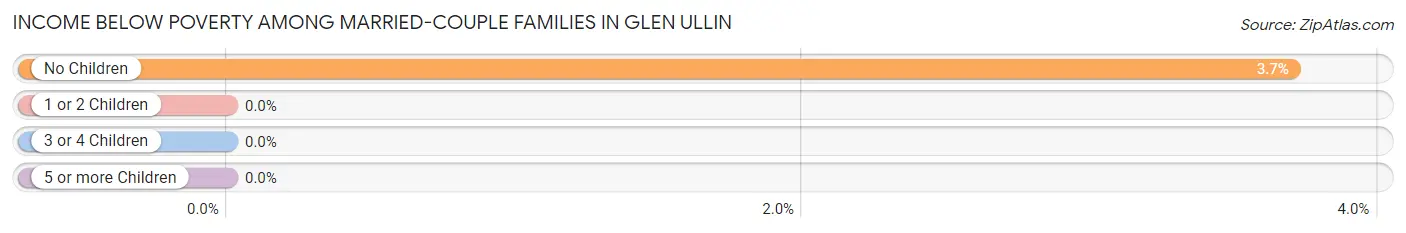
| Children | Above Poverty | Below Poverty |
| No Children | 78 (96.3%) | 3 (3.7%) |
| 1 or 2 Children | 23 (100.0%) | 0 (0.0%) |
| 3 or 4 Children | 12 (100.0%) | 0 (0.0%) |
| 5 or more Children | 0 (0.0%) | 0 (0.0%) |
| Total | 113 (97.4%) | 3 (2.6%) |
Income Below Poverty Among Single-Parent Households in Glen Ullin
According to the poverty data in Glen Ullin, 100.0% or 6 single-father households and 51.8% or 14 single-mother households are living below the poverty line. Among single-father households, those with 1 or 2 children have the highest poverty rate, with 6 households (100.0%) experiencing poverty. Likewise, among single-mother households, those with 1 or 2 children have the highest poverty rate, with 14 households (58.3%) falling below the poverty line.
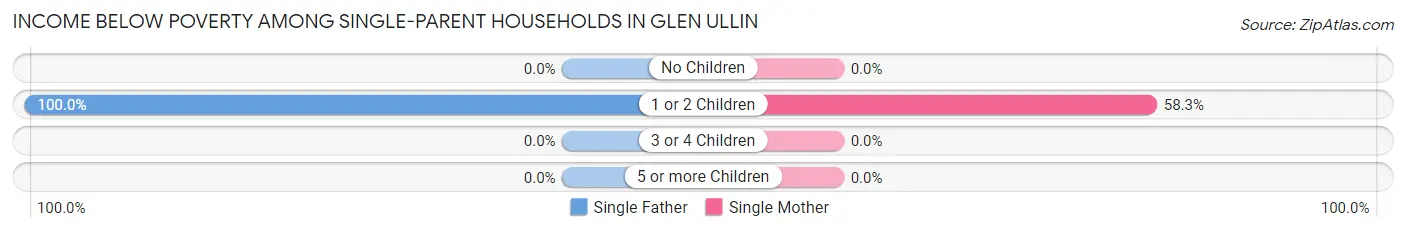
| Children | Single Father | Single Mother |
| No Children | 0 (0.0%) | 0 (0.0%) |
| 1 or 2 Children | 6 (100.0%) | 14 (58.3%) |
| 3 or 4 Children | 0 (0.0%) | 0 (0.0%) |
| 5 or more Children | 0 (0.0%) | 0 (0.0%) |
| Total | 6 (100.0%) | 14 (51.8%) |
Income Below Poverty Among Married-Couple vs Single-Parent Households in Glen Ullin
The poverty data for Glen Ullin shows that 3 of the married-couple family households (2.6%) and 20 of the single-parent households (60.6%) are living below the poverty level. Within the married-couple family households, those with no children have the highest poverty rate, with 3 households (3.7%) falling below the poverty line. Among the single-parent households, those with 1 or 2 children have the highest poverty rate, with 20 household (66.7%) living below poverty.
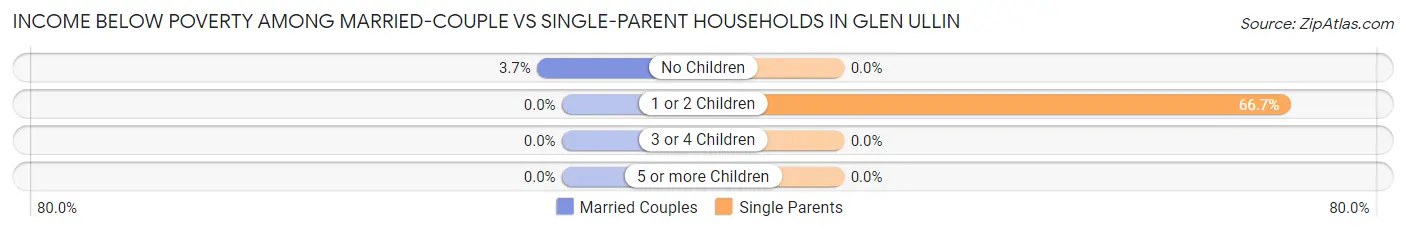
| Children | Married-Couple Families | Single-Parent Households |
| No Children | 3 (3.7%) | 0 (0.0%) |
| 1 or 2 Children | 0 (0.0%) | 20 (66.7%) |
| 3 or 4 Children | 0 (0.0%) | 0 (0.0%) |
| 5 or more Children | 0 (0.0%) | 0 (0.0%) |
| Total | 3 (2.6%) | 20 (60.6%) |
Employment Characteristics in Glen Ullin
Employment by Class of Employer in Glen Ullin
Among the 260 employed individuals in Glen Ullin, private company employees (175 | 67.3%), self-employed (not incorporated) (32 | 12.3%), and not-for-profit organizations (17 | 6.5%) make up the most common classes of employment.
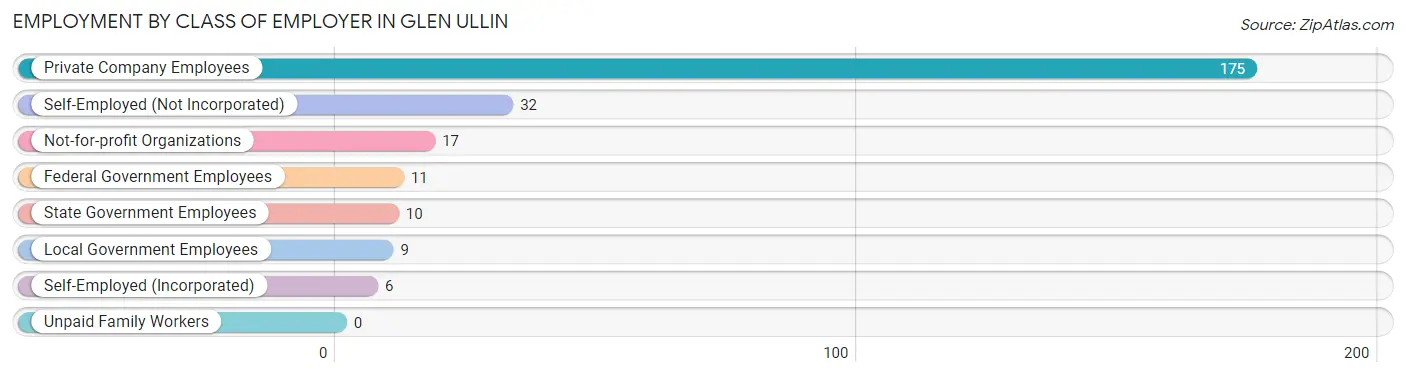
| Employer Class | # Employees | % Employees |
| Private Company Employees | 175 | 67.3% |
| Self-Employed (Incorporated) | 6 | 2.3% |
| Self-Employed (Not Incorporated) | 32 | 12.3% |
| Not-for-profit Organizations | 17 | 6.5% |
| Local Government Employees | 9 | 3.5% |
| State Government Employees | 10 | 3.8% |
| Federal Government Employees | 11 | 4.2% |
| Unpaid Family Workers | 0 | 0.0% |
| Total | 260 | 100.0% |
Employment Status by Age in Glen Ullin
According to the labor force statistics for Glen Ullin, out of the total population over 16 years of age (613), 46.0% or 282 individuals are in the labor force, with 7.1% or 20 of them unemployed. The age group with the highest labor force participation rate is 25 to 29 years, with 100.0% or 55 individuals in the labor force. Within the labor force, the 25 to 29 years age range has the highest percentage of unemployed individuals, with 36.4% or 20 of them being unemployed.
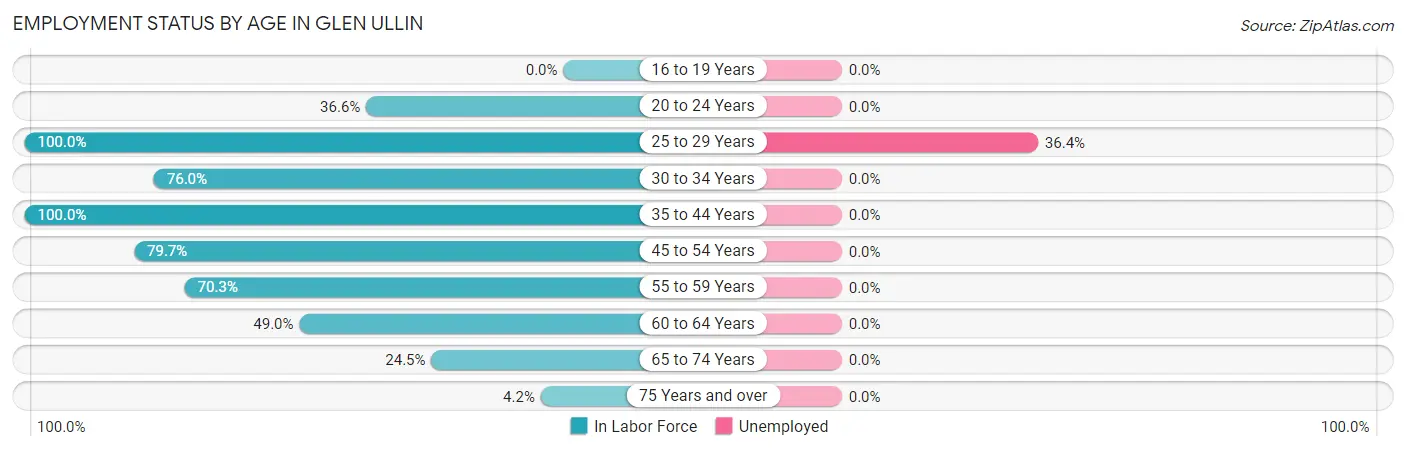
| Age Bracket | In Labor Force | Unemployed |
| 16 to 19 Years | 0 (0.0%) | 0 (0.0%) |
| 20 to 24 Years | 15 (36.6%) | 0 (0.0%) |
| 25 to 29 Years | 55 (100.0%) | 20 (36.4%) |
| 30 to 34 Years | 38 (76.0%) | 0 (0.0%) |
| 35 to 44 Years | 40 (100.0%) | 0 (0.0%) |
| 45 to 54 Years | 51 (79.7%) | 0 (0.0%) |
| 55 to 59 Years | 26 (70.3%) | 0 (0.0%) |
| 60 to 64 Years | 25 (49.0%) | 0 (0.0%) |
| 65 to 74 Years | 25 (24.5%) | 0 (0.0%) |
| 75 Years and over | 7 (4.2%) | 0 (0.0%) |
| Total | 282 (46.0%) | 20 (7.1%) |
Employment Status by Educational Attainment in Glen Ullin
According to labor force statistics for Glen Ullin, 79.1% of individuals (235) out of the total population between 25 and 64 years of age (297) are in the labor force, with 8.5% or 20 of them being unemployed. The group with the highest labor force participation rate are those with the educational attainment of college / associate degree, with 93.6% or 102 individuals in the labor force. Within the labor force, individuals with less than high school education have the highest percentage of unemployment, with 87.5% or 14 of them being unemployed.
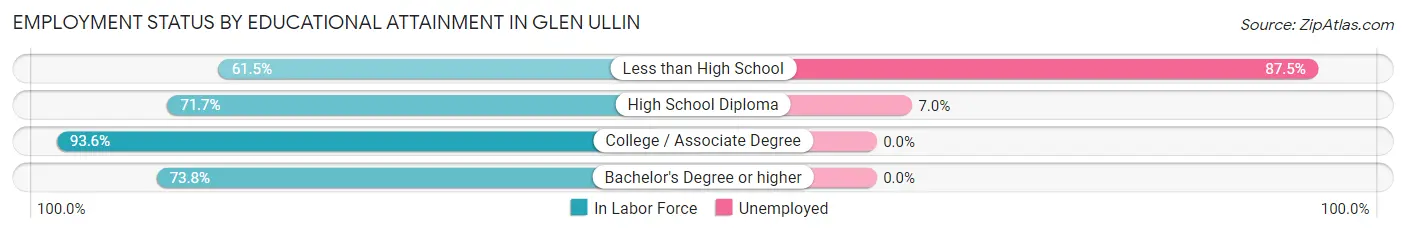
| Educational Attainment | In Labor Force | Unemployed |
| Less than High School | 16 (61.5%) | 23 (87.5%) |
| High School Diploma | 86 (71.7%) | 8 (7.0%) |
| College / Associate Degree | 102 (93.6%) | 0 (0.0%) |
| Bachelor's Degree or higher | 31 (73.8%) | 0 (0.0%) |
| Total | 235 (79.1%) | 25 (8.5%) |
Employment Occupations by Sex in Glen Ullin
Management, Business, Science and Arts Occupations
The most common Management, Business, Science and Arts occupations in Glen Ullin are Community & Social Service (34 | 13.0%), Management (13 | 5.0%), Education Instruction & Library (13 | 5.0%), Arts, Media & Entertainment (13 | 5.0%), and Health Diagnosing & Treating (12 | 4.6%).
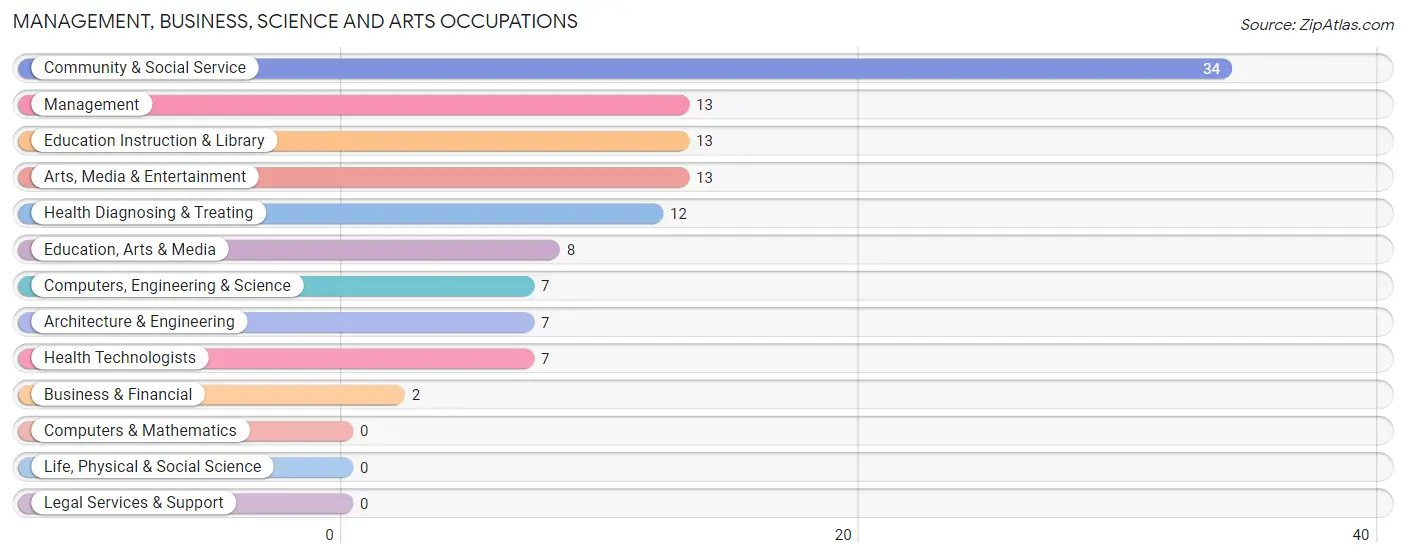
Management, Business, Science and Arts Occupations by Sex
Within the Management, Business, Science and Arts occupations in Glen Ullin, the most male-oriented occupations are Management (100.0%), Computers, Engineering & Science (100.0%), and Architecture & Engineering (100.0%), while the most female-oriented occupations are Health Diagnosing & Treating (100.0%), Health Technologists (100.0%), and Education Instruction & Library (84.6%).
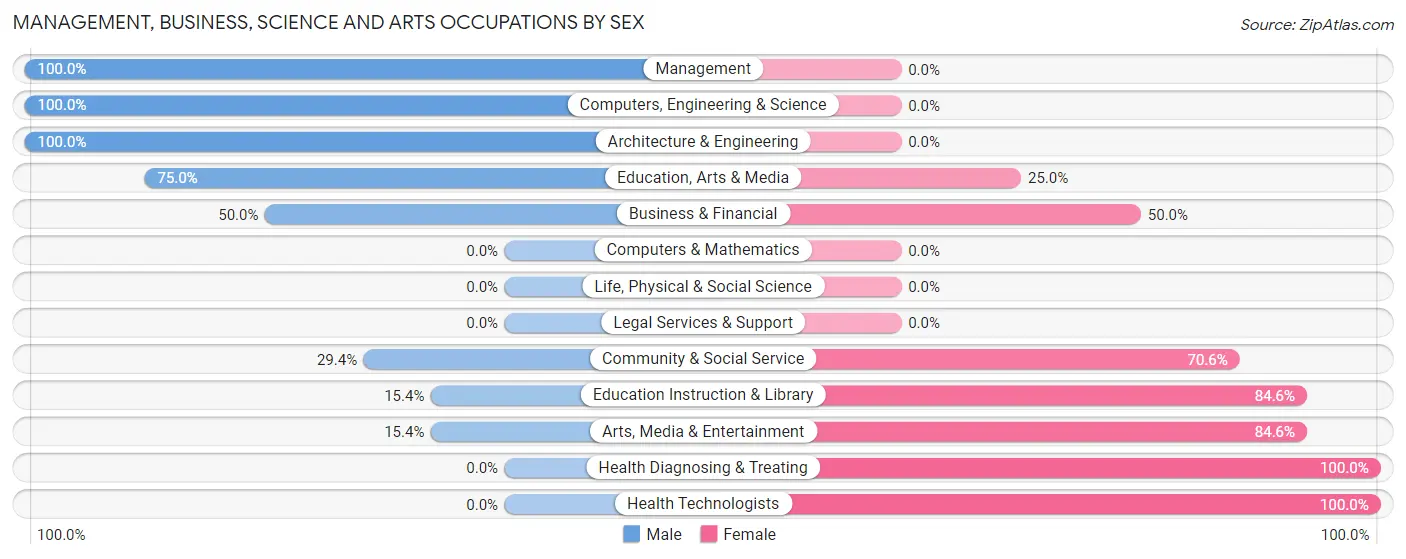
| Occupation | Male | Female |
| Management | 13 (100.0%) | 0 (0.0%) |
| Business & Financial | 1 (50.0%) | 1 (50.0%) |
| Computers, Engineering & Science | 7 (100.0%) | 0 (0.0%) |
| Computers & Mathematics | 0 (0.0%) | 0 (0.0%) |
| Architecture & Engineering | 7 (100.0%) | 0 (0.0%) |
| Life, Physical & Social Science | 0 (0.0%) | 0 (0.0%) |
| Community & Social Service | 10 (29.4%) | 24 (70.6%) |
| Education, Arts & Media | 6 (75.0%) | 2 (25.0%) |
| Legal Services & Support | 0 (0.0%) | 0 (0.0%) |
| Education Instruction & Library | 2 (15.4%) | 11 (84.6%) |
| Arts, Media & Entertainment | 2 (15.4%) | 11 (84.6%) |
| Health Diagnosing & Treating | 0 (0.0%) | 12 (100.0%) |
| Health Technologists | 0 (0.0%) | 7 (100.0%) |
| Total (Category) | 31 (45.6%) | 37 (54.4%) |
| Total (Overall) | 122 (46.6%) | 140 (53.4%) |
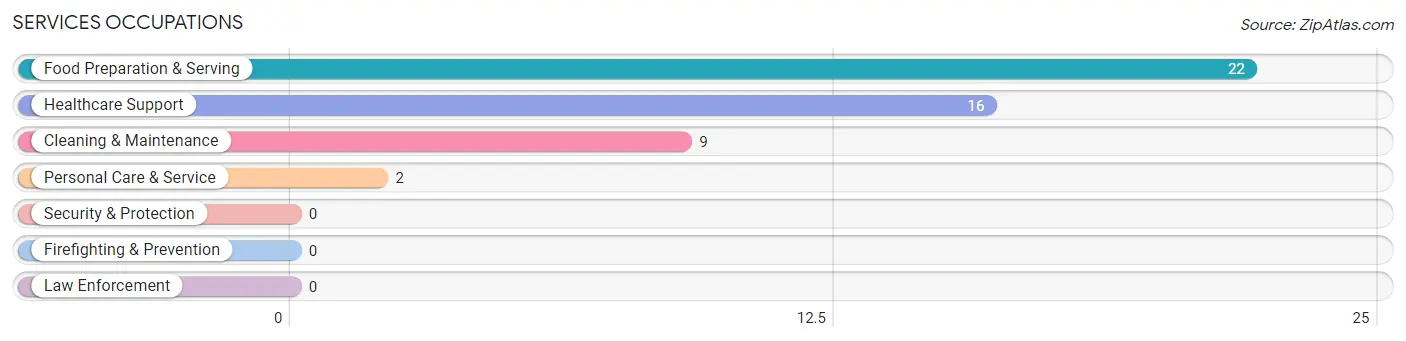
Services Occupations
The most common Services occupations in Glen Ullin are Food Preparation & Serving (22 | 8.4%), Healthcare Support (16 | 6.1%), Cleaning & Maintenance (9 | 3.4%), and Personal Care & Service (2 | 0.8%).
Services Occupations by Sex
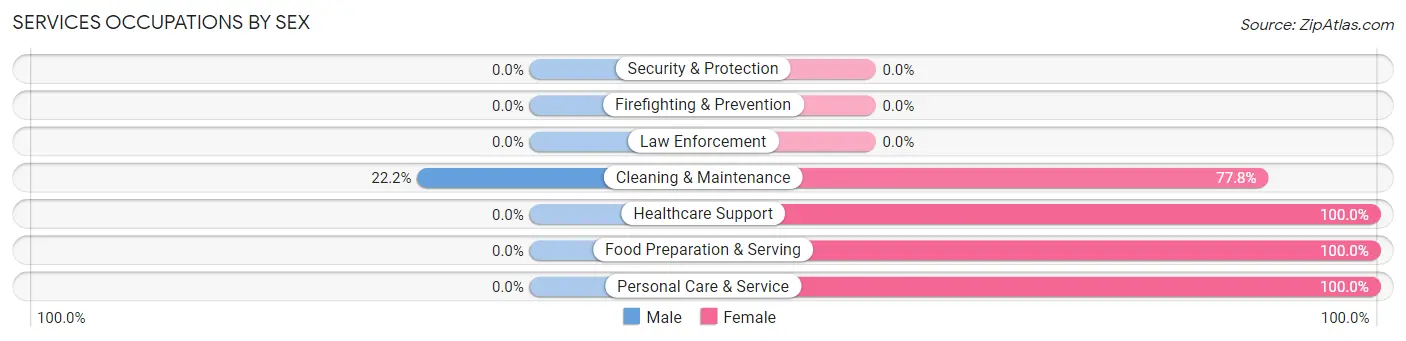
| Occupation | Male | Female |
| Healthcare Support | 0 (0.0%) | 16 (100.0%) |
| Security & Protection | 0 (0.0%) | 0 (0.0%) |
| Firefighting & Prevention | 0 (0.0%) | 0 (0.0%) |
| Law Enforcement | 0 (0.0%) | 0 (0.0%) |
| Food Preparation & Serving | 0 (0.0%) | 22 (100.0%) |
| Cleaning & Maintenance | 2 (22.2%) | 7 (77.8%) |
| Personal Care & Service | 0 (0.0%) | 2 (100.0%) |
| Total (Category) | 2 (4.1%) | 47 (95.9%) |
| Total (Overall) | 122 (46.6%) | 140 (53.4%) |
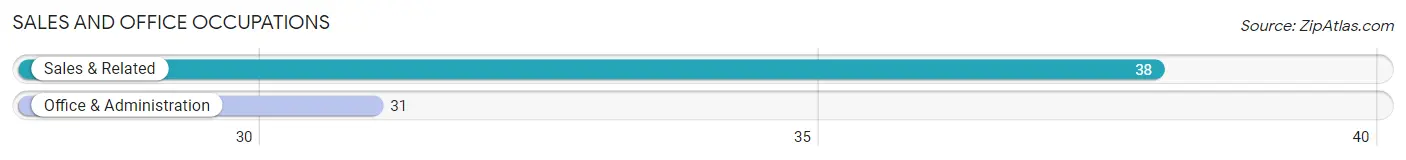
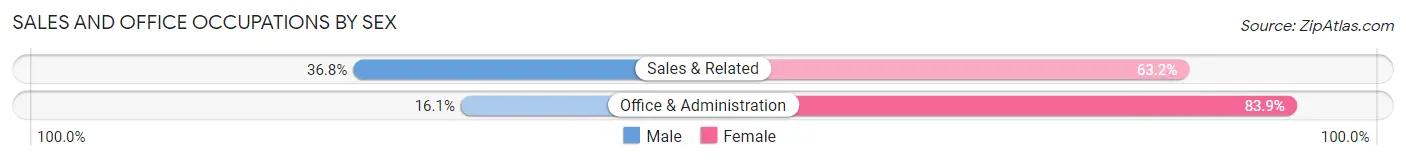
Sales and Office Occupations
The most common Sales and Office occupations in Glen Ullin are Sales & Related (38 | 14.5%), and Office & Administration (31 | 11.8%).
Sales and Office Occupations by Sex
| Occupation | Male | Female |
| Sales & Related | 14 (36.8%) | 24 (63.2%) |
| Office & Administration | 5 (16.1%) | 26 (83.9%) |
| Total (Category) | 19 (27.5%) | 50 (72.5%) |
| Total (Overall) | 122 (46.6%) | 140 (53.4%) |
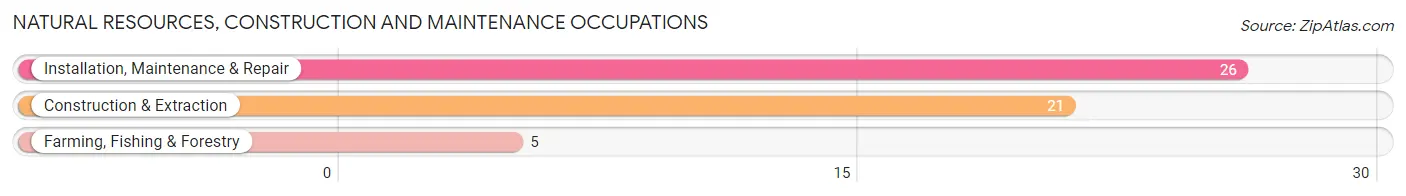
Natural Resources, Construction and Maintenance Occupations
The most common Natural Resources, Construction and Maintenance occupations in Glen Ullin are Installation, Maintenance & Repair (26 | 9.9%), Construction & Extraction (21 | 8.0%), and Farming, Fishing & Forestry (5 | 1.9%).
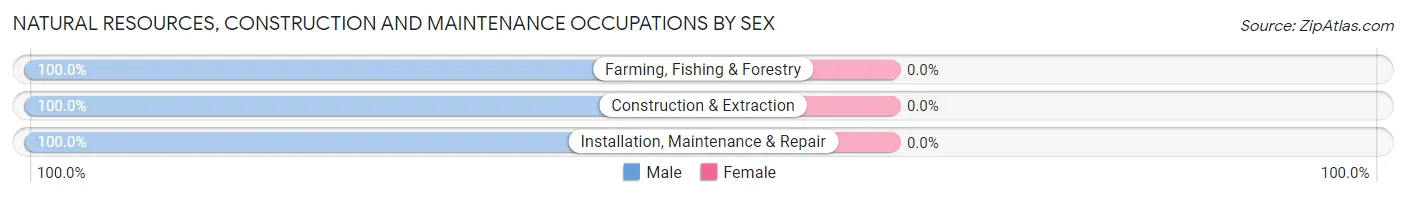
Natural Resources, Construction and Maintenance Occupations by Sex
| Occupation | Male | Female |
| Farming, Fishing & Forestry | 5 (100.0%) | 0 (0.0%) |
| Construction & Extraction | 21 (100.0%) | 0 (0.0%) |
| Installation, Maintenance & Repair | 26 (100.0%) | 0 (0.0%) |
| Total (Category) | 52 (100.0%) | 0 (0.0%) |
| Total (Overall) | 122 (46.6%) | 140 (53.4%) |
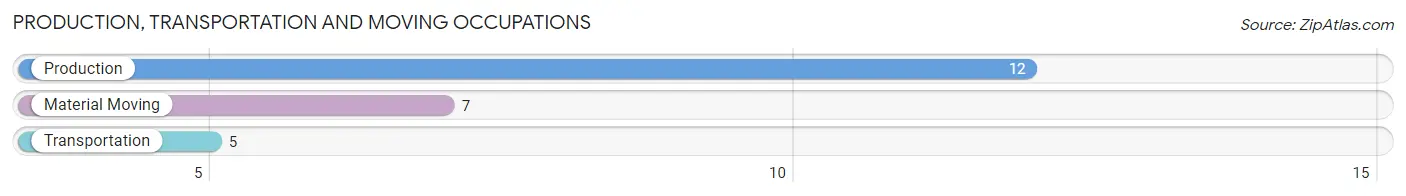
Production, Transportation and Moving Occupations
The most common Production, Transportation and Moving occupations in Glen Ullin are Production (12 | 4.6%), Material Moving (7 | 2.7%), and Transportation (5 | 1.9%).
Production, Transportation and Moving Occupations by Sex
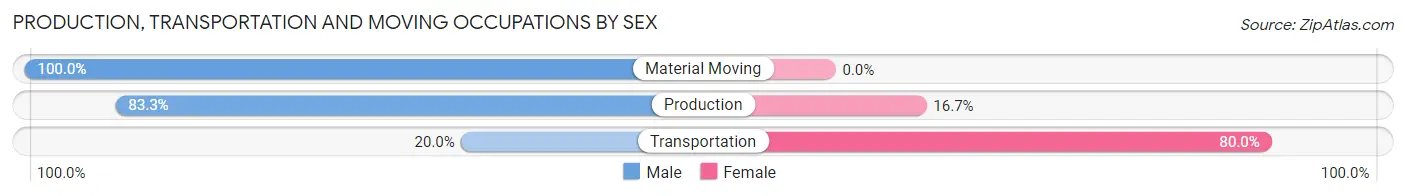
| Occupation | Male | Female |
| Production | 10 (83.3%) | 2 (16.7%) |
| Transportation | 1 (20.0%) | 4 (80.0%) |
| Material Moving | 7 (100.0%) | 0 (0.0%) |
| Total (Category) | 18 (75.0%) | 6 (25.0%) |
| Total (Overall) | 122 (46.6%) | 140 (53.4%) |
Employment Industries by Sex in Glen Ullin
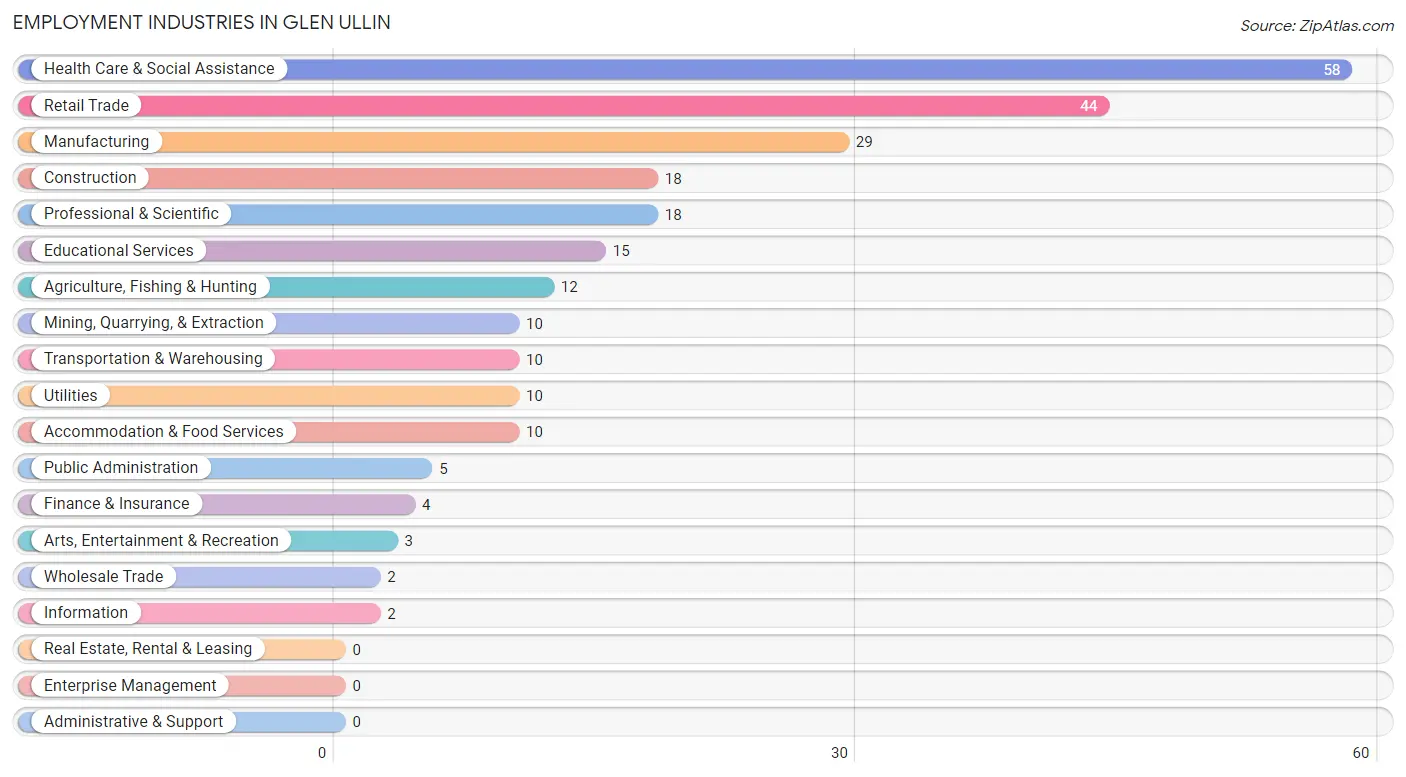
Employment Industries in Glen Ullin
The major employment industries in Glen Ullin include Health Care & Social Assistance (58 | 22.1%), Retail Trade (44 | 16.8%), Manufacturing (29 | 11.1%), Construction (18 | 6.9%), and Professional & Scientific (18 | 6.9%).
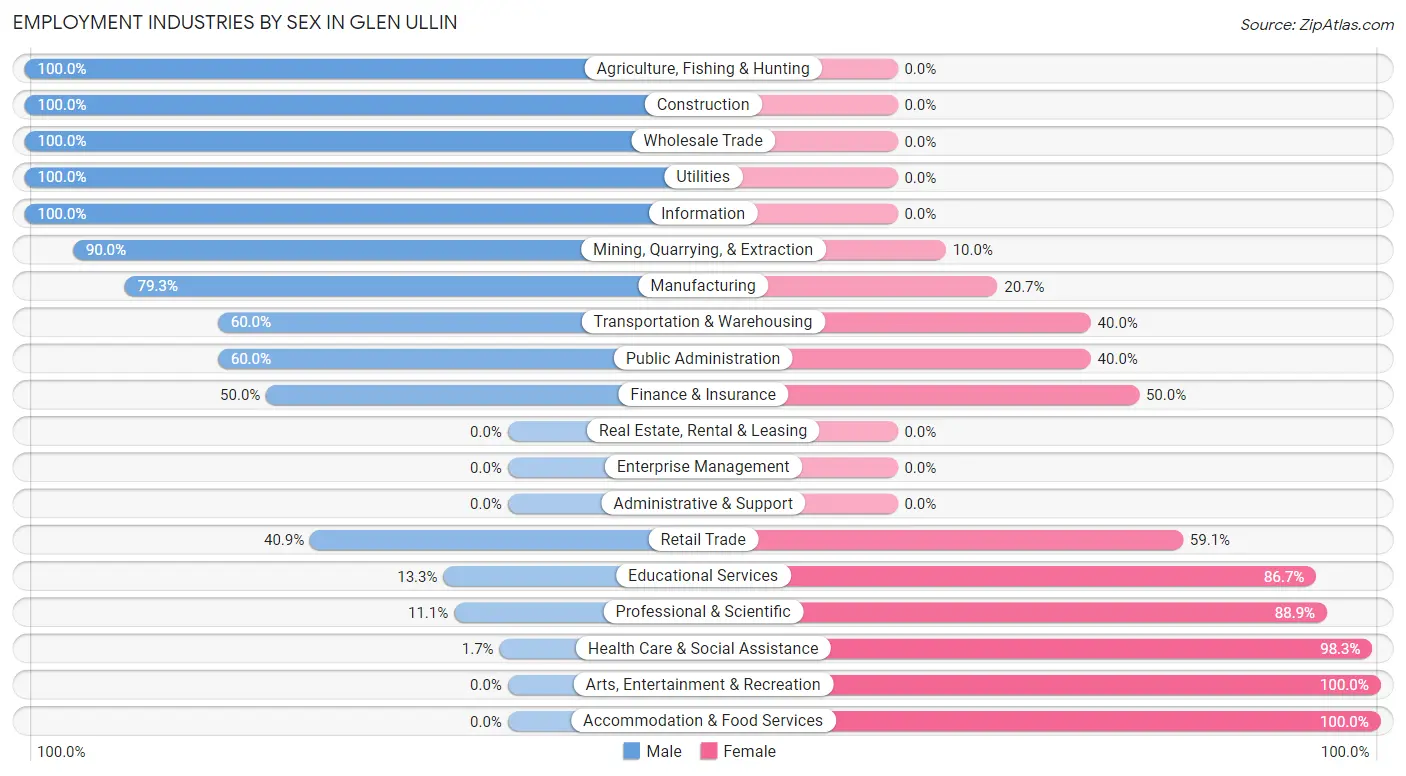
Employment Industries by Sex in Glen Ullin
The Glen Ullin industries that see more men than women are Agriculture, Fishing & Hunting (100.0%), Construction (100.0%), and Wholesale Trade (100.0%), whereas the industries that tend to have a higher number of women are Arts, Entertainment & Recreation (100.0%), Accommodation & Food Services (100.0%), and Health Care & Social Assistance (98.3%).
| Industry | Male | Female |
| Agriculture, Fishing & Hunting | 12 (100.0%) | 0 (0.0%) |
| Mining, Quarrying, & Extraction | 9 (90.0%) | 1 (10.0%) |
| Construction | 18 (100.0%) | 0 (0.0%) |
| Manufacturing | 23 (79.3%) | 6 (20.7%) |
| Wholesale Trade | 2 (100.0%) | 0 (0.0%) |
| Retail Trade | 18 (40.9%) | 26 (59.1%) |
| Transportation & Warehousing | 6 (60.0%) | 4 (40.0%) |
| Utilities | 10 (100.0%) | 0 (0.0%) |
| Information | 2 (100.0%) | 0 (0.0%) |
| Finance & Insurance | 2 (50.0%) | 2 (50.0%) |
| Real Estate, Rental & Leasing | 0 (0.0%) | 0 (0.0%) |
| Professional & Scientific | 2 (11.1%) | 16 (88.9%) |
| Enterprise Management | 0 (0.0%) | 0 (0.0%) |
| Administrative & Support | 0 (0.0%) | 0 (0.0%) |
| Educational Services | 2 (13.3%) | 13 (86.7%) |
| Health Care & Social Assistance | 1 (1.7%) | 57 (98.3%) |
| Arts, Entertainment & Recreation | 0 (0.0%) | 3 (100.0%) |
| Accommodation & Food Services | 0 (0.0%) | 10 (100.0%) |
| Public Administration | 3 (60.0%) | 2 (40.0%) |
| Total | 122 (46.6%) | 140 (53.4%) |
Education in Glen Ullin
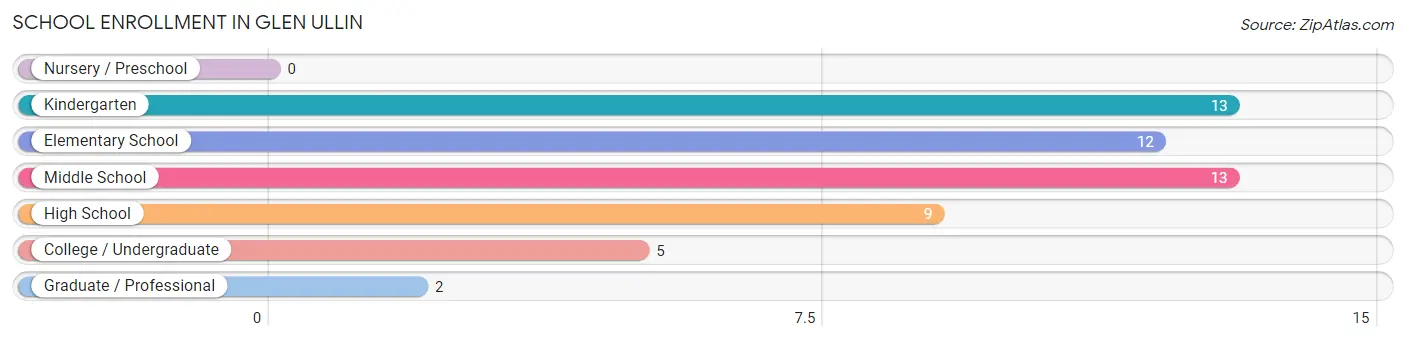
School Enrollment in Glen Ullin
The most common levels of schooling among the 54 students in Glen Ullin are kindergarten (13 | 24.1%), middle school (13 | 24.1%), and elementary school (12 | 22.2%).
| School Level | # Students | % Students |
| Nursery / Preschool | 0 | 0.0% |
| Kindergarten | 13 | 24.1% |
| Elementary School | 12 | 22.2% |
| Middle School | 13 | 24.1% |
| High School | 9 | 16.7% |
| College / Undergraduate | 5 | 9.3% |
| Graduate / Professional | 2 | 3.7% |
| Total | 54 | 100.0% |
School Enrollment by Age by Funding Source in Glen Ullin
Out of a total of 54 students who are enrolled in schools in Glen Ullin, 3 (5.6%) attend a private institution, while the remaining 51 (94.4%) are enrolled in public schools. The age group of 25 to 34 year olds has the highest likelihood of being enrolled in private schools, with 2 (40.0% in the age bracket) enrolled. Conversely, the age group of 5 to 9 year old has the lowest likelihood of being enrolled in a private school, with 21 (100.0% in the age bracket) attending a public institution.
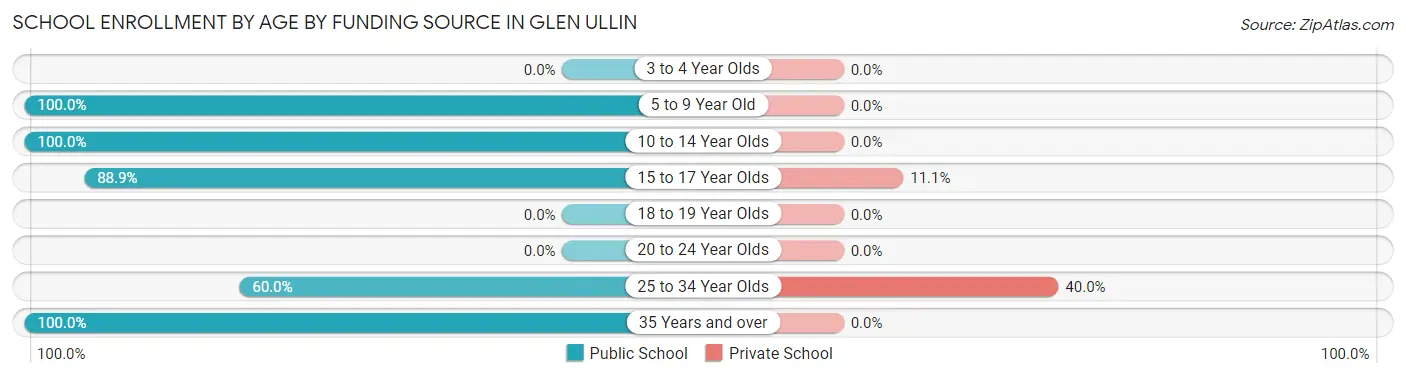
| Age Bracket | Public School | Private School |
| 3 to 4 Year Olds | 0 (0.0%) | 0 (0.0%) |
| 5 to 9 Year Old | 21 (100.0%) | 0 (0.0%) |
| 10 to 14 Year Olds | 17 (100.0%) | 0 (0.0%) |
| 15 to 17 Year Olds | 8 (88.9%) | 1 (11.1%) |
| 18 to 19 Year Olds | 0 (0.0%) | 0 (0.0%) |
| 20 to 24 Year Olds | 0 (0.0%) | 0 (0.0%) |
| 25 to 34 Year Olds | 3 (60.0%) | 2 (40.0%) |
| 35 Years and over | 2 (100.0%) | 0 (0.0%) |
| Total | 51 (94.4%) | 3 (5.6%) |
Educational Attainment by Field of Study in Glen Ullin
Education (26 | 38.8%), science & technology (12 | 17.9%), bio, nature & agricultural (6 | 9.0%), liberal arts & history (6 | 9.0%), and business (4 | 6.0%) are the most common fields of study among 67 individuals in Glen Ullin who have obtained a bachelor's degree or higher.
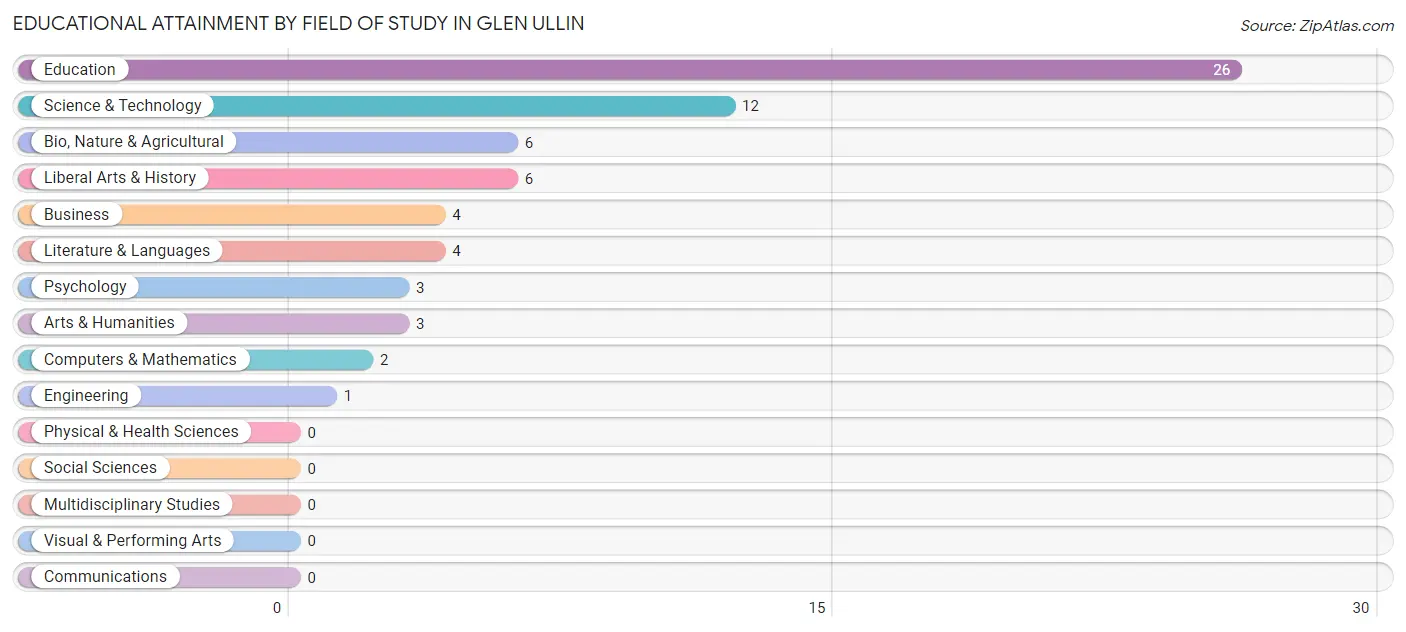
| Field of Study | # Graduates | % Graduates |
| Computers & Mathematics | 2 | 3.0% |
| Bio, Nature & Agricultural | 6 | 9.0% |
| Physical & Health Sciences | 0 | 0.0% |
| Psychology | 3 | 4.5% |
| Social Sciences | 0 | 0.0% |
| Engineering | 1 | 1.5% |
| Multidisciplinary Studies | 0 | 0.0% |
| Science & Technology | 12 | 17.9% |
| Business | 4 | 6.0% |
| Education | 26 | 38.8% |
| Literature & Languages | 4 | 6.0% |
| Liberal Arts & History | 6 | 9.0% |
| Visual & Performing Arts | 0 | 0.0% |
| Communications | 0 | 0.0% |
| Arts & Humanities | 3 | 4.5% |
| Total | 67 | 100.0% |
Transportation & Commute in Glen Ullin
Vehicle Availability by Sex in Glen Ullin
The most prevalent vehicle ownership categories in Glen Ullin are males with 3 vehicles (35, accounting for 28.7%) and females with 3 vehicles (41, making up 25.4%).
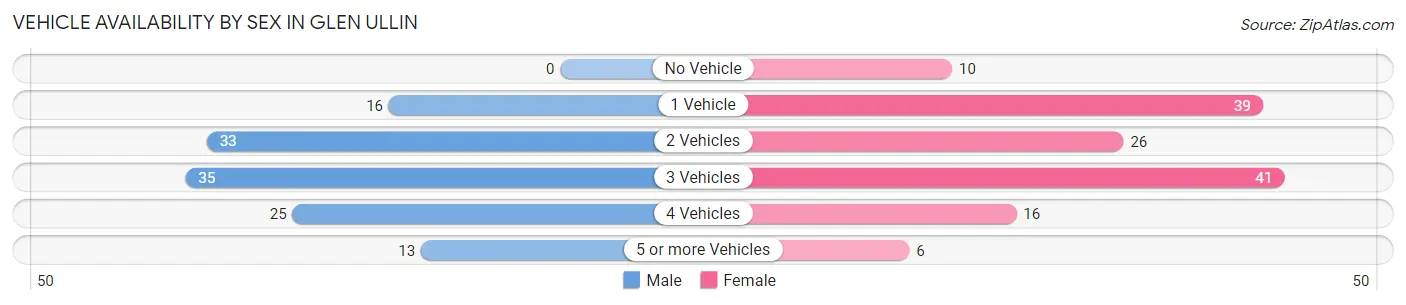
| Vehicles Available | Male | Female |
| No Vehicle | 0 (0.0%) | 10 (7.2%) |
| 1 Vehicle | 16 (13.1%) | 39 (28.3%) |
| 2 Vehicles | 33 (27.1%) | 26 (18.8%) |
| 3 Vehicles | 35 (28.7%) | 41 (29.7%) |
| 4 Vehicles | 25 (20.5%) | 16 (11.6%) |
| 5 or more Vehicles | 13 (10.7%) | 6 (4.3%) |
| Total | 122 (100.0%) | 138 (100.0%) |
Commute Time in Glen Ullin
The most frequently occuring commute durations in Glen Ullin are 5 to 9 minutes (71 commuters, 29.3%), 45 to 59 minutes (42 commuters, 17.4%), and less than 5 minutes (29 commuters, 12.0%).
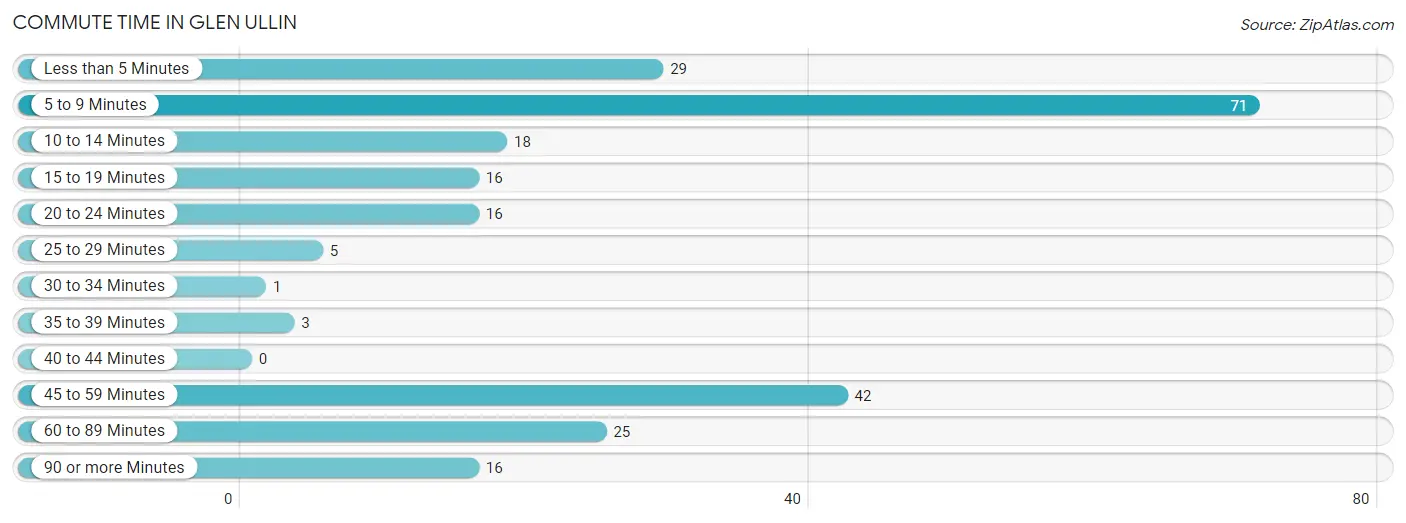
| Commute Time | # Commuters | % Commuters |
| Less than 5 Minutes | 29 | 12.0% |
| 5 to 9 Minutes | 71 | 29.3% |
| 10 to 14 Minutes | 18 | 7.4% |
| 15 to 19 Minutes | 16 | 6.6% |
| 20 to 24 Minutes | 16 | 6.6% |
| 25 to 29 Minutes | 5 | 2.1% |
| 30 to 34 Minutes | 1 | 0.4% |
| 35 to 39 Minutes | 3 | 1.2% |
| 40 to 44 Minutes | 0 | 0.0% |
| 45 to 59 Minutes | 42 | 17.4% |
| 60 to 89 Minutes | 25 | 10.3% |
| 90 or more Minutes | 16 | 6.6% |
Commute Time by Sex in Glen Ullin
The most common commute times in Glen Ullin are 45 to 59 minutes (32 commuters, 27.1%) for males and 5 to 9 minutes (52 commuters, 41.9%) for females.
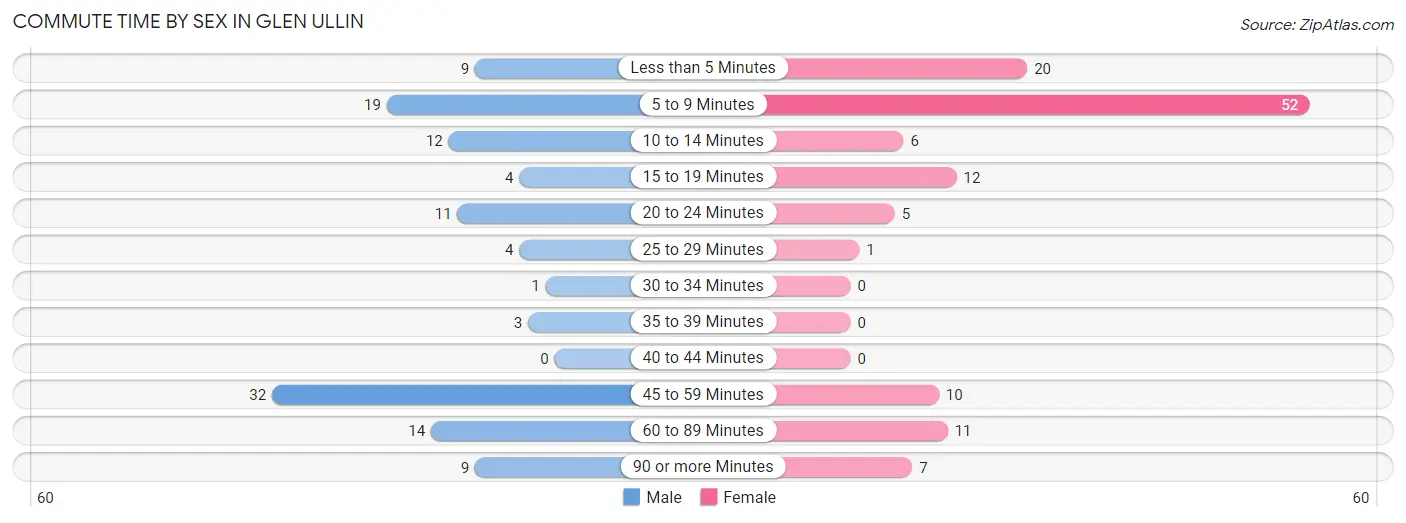
| Commute Time | Male | Female |
| Less than 5 Minutes | 9 (7.6%) | 20 (16.1%) |
| 5 to 9 Minutes | 19 (16.1%) | 52 (41.9%) |
| 10 to 14 Minutes | 12 (10.2%) | 6 (4.8%) |
| 15 to 19 Minutes | 4 (3.4%) | 12 (9.7%) |
| 20 to 24 Minutes | 11 (9.3%) | 5 (4.0%) |
| 25 to 29 Minutes | 4 (3.4%) | 1 (0.8%) |
| 30 to 34 Minutes | 1 (0.9%) | 0 (0.0%) |
| 35 to 39 Minutes | 3 (2.5%) | 0 (0.0%) |
| 40 to 44 Minutes | 0 (0.0%) | 0 (0.0%) |
| 45 to 59 Minutes | 32 (27.1%) | 10 (8.1%) |
| 60 to 89 Minutes | 14 (11.9%) | 11 (8.9%) |
| 90 or more Minutes | 9 (7.6%) | 7 (5.7%) |
Time of Departure to Work by Sex in Glen Ullin
The most frequent times of departure to work in Glen Ullin are 7:30 AM to 7:59 AM (40, 33.9%) for males and 7:30 AM to 7:59 AM (24, 19.4%) for females.
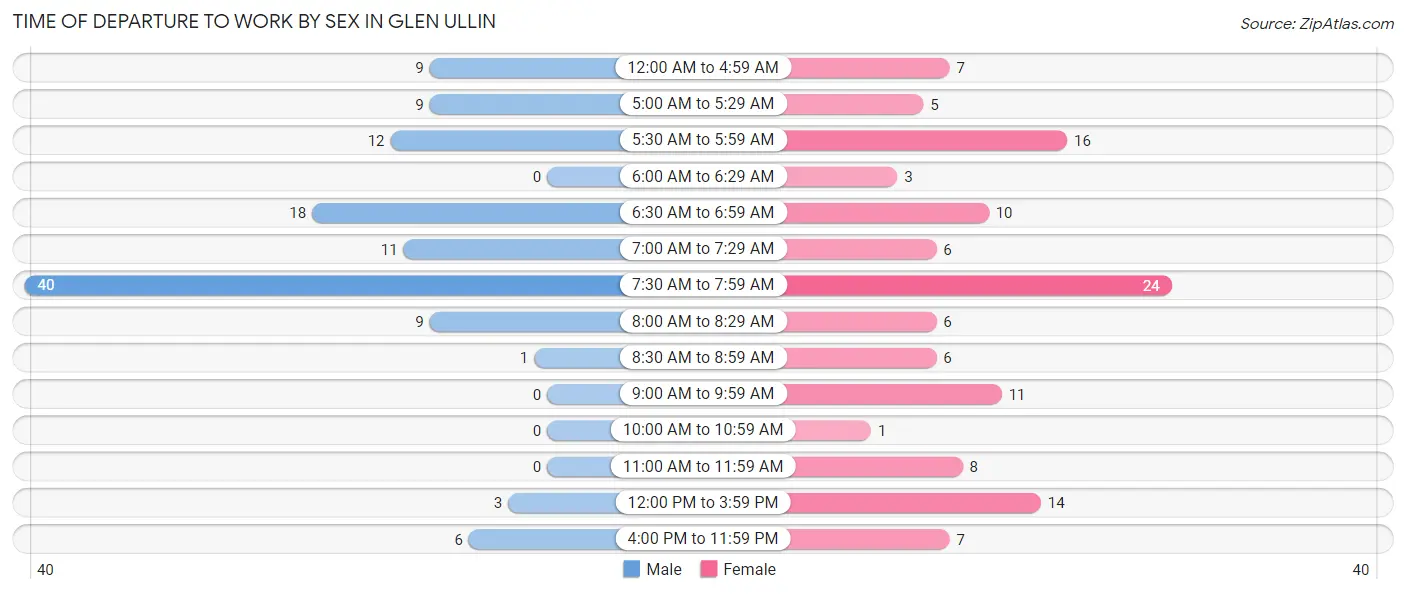
| Time of Departure | Male | Female |
| 12:00 AM to 4:59 AM | 9 (7.6%) | 7 (5.7%) |
| 5:00 AM to 5:29 AM | 9 (7.6%) | 5 (4.0%) |
| 5:30 AM to 5:59 AM | 12 (10.2%) | 16 (12.9%) |
| 6:00 AM to 6:29 AM | 0 (0.0%) | 3 (2.4%) |
| 6:30 AM to 6:59 AM | 18 (15.2%) | 10 (8.1%) |
| 7:00 AM to 7:29 AM | 11 (9.3%) | 6 (4.8%) |
| 7:30 AM to 7:59 AM | 40 (33.9%) | 24 (19.4%) |
| 8:00 AM to 8:29 AM | 9 (7.6%) | 6 (4.8%) |
| 8:30 AM to 8:59 AM | 1 (0.9%) | 6 (4.8%) |
| 9:00 AM to 9:59 AM | 0 (0.0%) | 11 (8.9%) |
| 10:00 AM to 10:59 AM | 0 (0.0%) | 1 (0.8%) |
| 11:00 AM to 11:59 AM | 0 (0.0%) | 8 (6.5%) |
| 12:00 PM to 3:59 PM | 3 (2.5%) | 14 (11.3%) |
| 4:00 PM to 11:59 PM | 6 (5.1%) | 7 (5.7%) |
| Total | 118 (100.0%) | 124 (100.0%) |
Housing Occupancy in Glen Ullin
Occupancy by Ownership in Glen Ullin
Of the total 372 dwellings in Glen Ullin, owner-occupied units account for 288 (77.4%), while renter-occupied units make up 84 (22.6%).
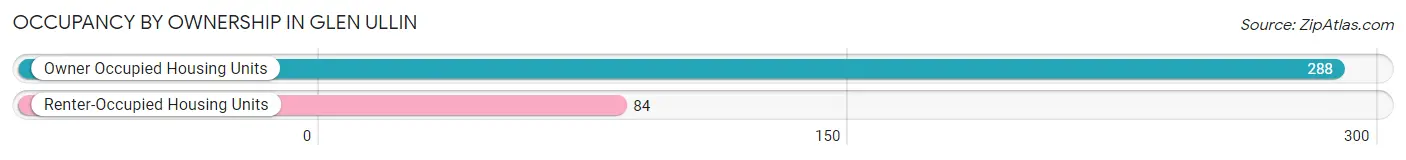
| Occupancy | # Housing Units | % Housing Units |
| Owner Occupied Housing Units | 288 | 77.4% |
| Renter-Occupied Housing Units | 84 | 22.6% |
| Total Occupied Housing Units | 372 | 100.0% |
Occupancy by Household Size in Glen Ullin
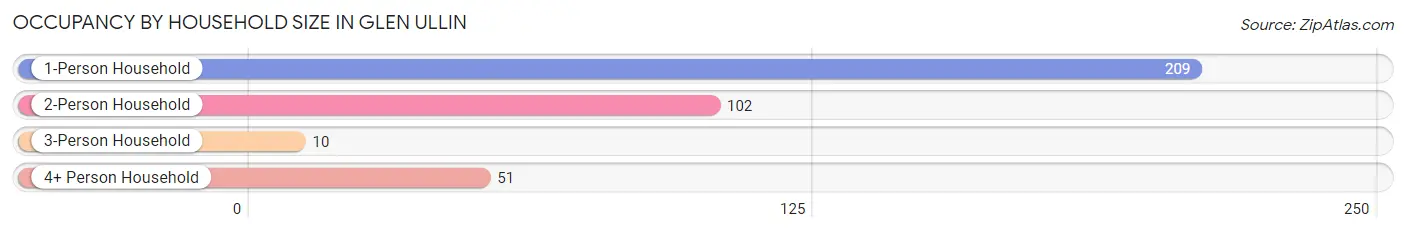
| Household Size | # Housing Units | % Housing Units |
| 1-Person Household | 209 | 56.2% |
| 2-Person Household | 102 | 27.4% |
| 3-Person Household | 10 | 2.7% |
| 4+ Person Household | 51 | 13.7% |
| Total Housing Units | 372 | 100.0% |
Occupancy by Ownership by Household Size in Glen Ullin
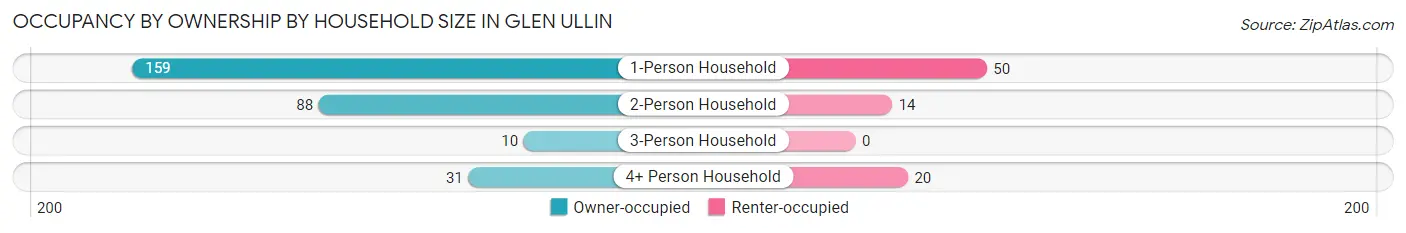
| Household Size | Owner-occupied | Renter-occupied |
| 1-Person Household | 159 (76.1%) | 50 (23.9%) |
| 2-Person Household | 88 (86.3%) | 14 (13.7%) |
| 3-Person Household | 10 (100.0%) | 0 (0.0%) |
| 4+ Person Household | 31 (60.8%) | 20 (39.2%) |
| Total Housing Units | 288 (77.4%) | 84 (22.6%) |
Occupancy by Educational Attainment in Glen Ullin
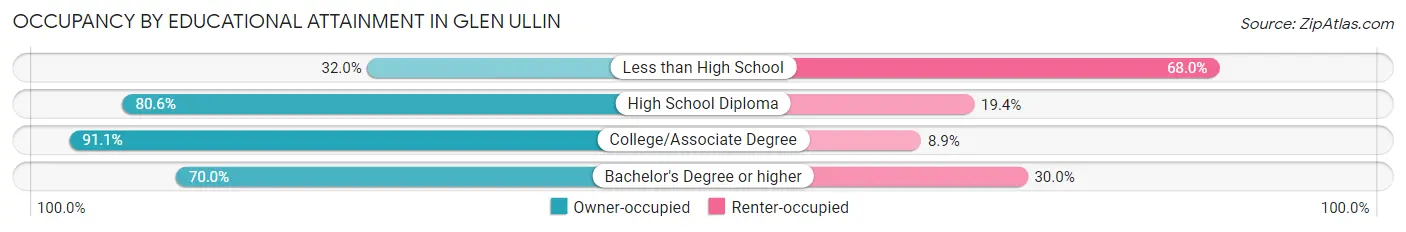
| Household Size | Owner-occupied | Renter-occupied |
| Less than High School | 16 (32.0%) | 34 (68.0%) |
| High School Diploma | 83 (80.6%) | 20 (19.4%) |
| College/Associate Degree | 154 (91.1%) | 15 (8.9%) |
| Bachelor's Degree or higher | 35 (70.0%) | 15 (30.0%) |
Occupancy by Age of Householder in Glen Ullin
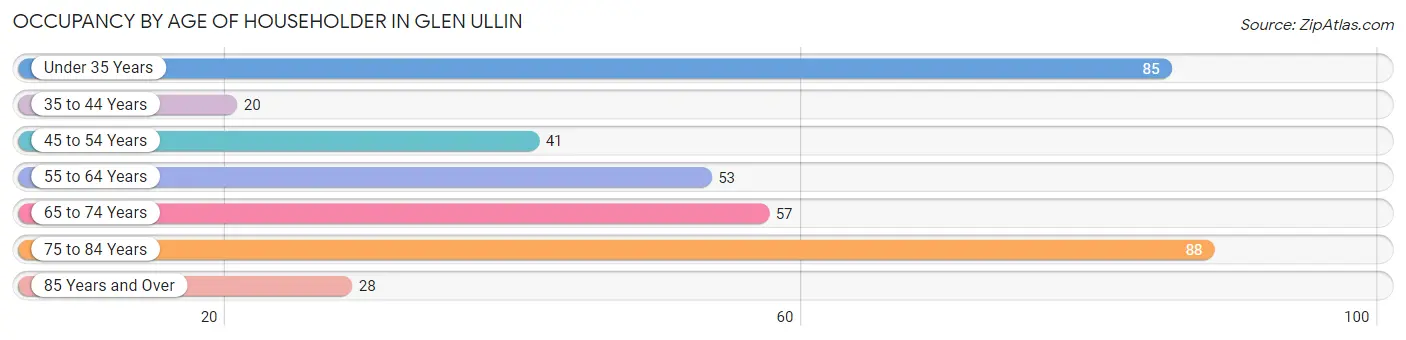
| Age Bracket | # Households | % Households |
| Under 35 Years | 85 | 22.9% |
| 35 to 44 Years | 20 | 5.4% |
| 45 to 54 Years | 41 | 11.0% |
| 55 to 64 Years | 53 | 14.2% |
| 65 to 74 Years | 57 | 15.3% |
| 75 to 84 Years | 88 | 23.7% |
| 85 Years and Over | 28 | 7.5% |
| Total | 372 | 100.0% |
Housing Finances in Glen Ullin
Median Income by Occupancy in Glen Ullin
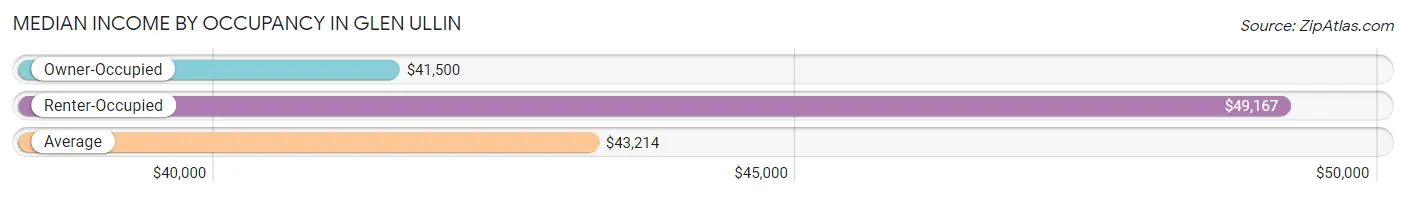
| Occupancy Type | # Households | Median Income |
| Owner-Occupied | 288 (77.4%) | $41,500 |
| Renter-Occupied | 84 (22.6%) | $49,167 |
| Average | 372 (100.0%) | $43,214 |
Occupancy by Householder Income Bracket in Glen Ullin
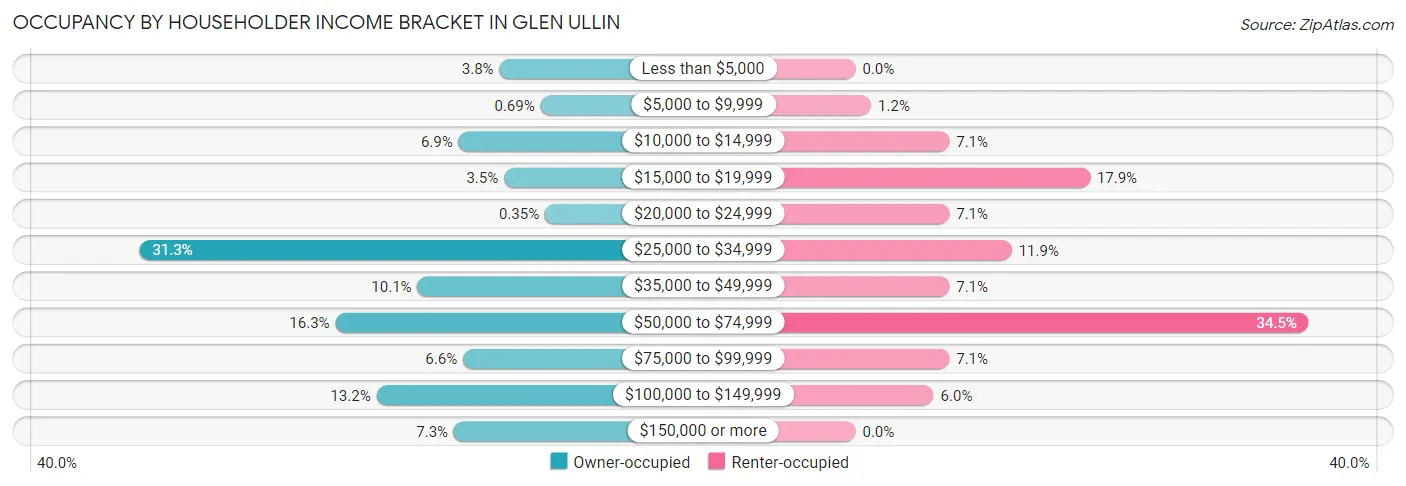
| Income Bracket | Owner-occupied | Renter-occupied |
| Less than $5,000 | 11 (3.8%) | 0 (0.0%) |
| $5,000 to $9,999 | 2 (0.7%) | 1 (1.2%) |
| $10,000 to $14,999 | 20 (6.9%) | 6 (7.1%) |
| $15,000 to $19,999 | 10 (3.5%) | 15 (17.9%) |
| $20,000 to $24,999 | 1 (0.4%) | 6 (7.1%) |
| $25,000 to $34,999 | 90 (31.2%) | 10 (11.9%) |
| $35,000 to $49,999 | 29 (10.1%) | 6 (7.1%) |
| $50,000 to $74,999 | 47 (16.3%) | 29 (34.5%) |
| $75,000 to $99,999 | 19 (6.6%) | 6 (7.1%) |
| $100,000 to $149,999 | 38 (13.2%) | 5 (5.9%) |
| $150,000 or more | 21 (7.3%) | 0 (0.0%) |
| Total | 288 (100.0%) | 84 (100.0%) |
Monthly Housing Cost Tiers in Glen Ullin
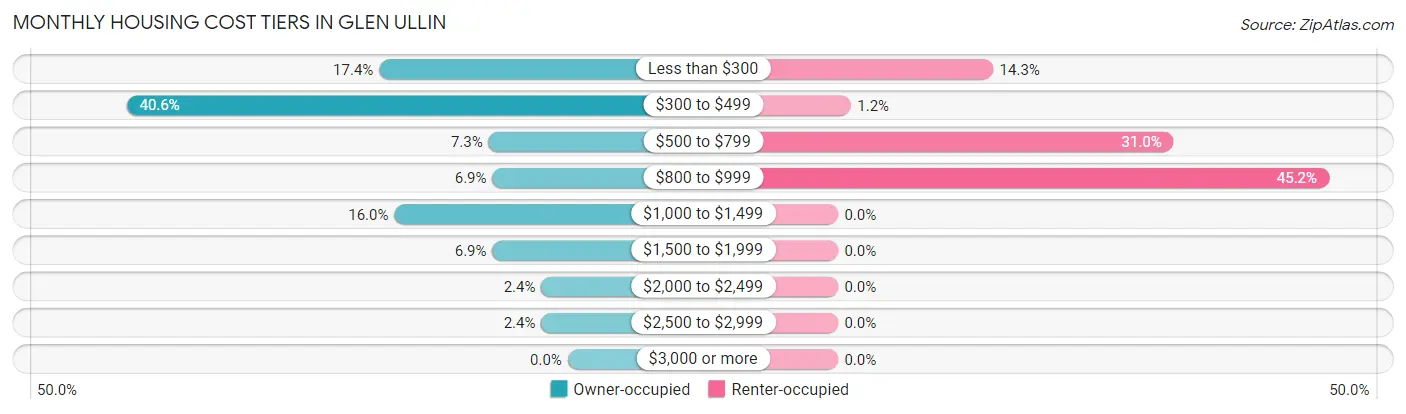
| Monthly Cost | Owner-occupied | Renter-occupied |
| Less than $300 | 50 (17.4%) | 12 (14.3%) |
| $300 to $499 | 117 (40.6%) | 1 (1.2%) |
| $500 to $799 | 21 (7.3%) | 26 (30.9%) |
| $800 to $999 | 20 (6.9%) | 38 (45.2%) |
| $1,000 to $1,499 | 46 (16.0%) | 0 (0.0%) |
| $1,500 to $1,999 | 20 (6.9%) | 0 (0.0%) |
| $2,000 to $2,499 | 7 (2.4%) | 0 (0.0%) |
| $2,500 to $2,999 | 7 (2.4%) | 0 (0.0%) |
| $3,000 or more | 0 (0.0%) | 0 (0.0%) |
| Total | 288 (100.0%) | 84 (100.0%) |
Physical Housing Characteristics in Glen Ullin
Housing Structures in Glen Ullin
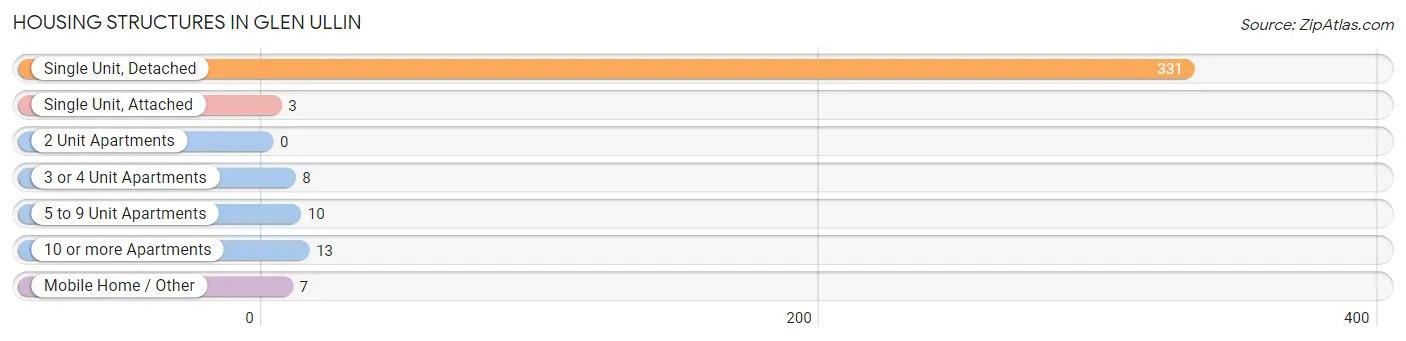
| Structure Type | # Housing Units | % Housing Units |
| Single Unit, Detached | 331 | 89.0% |
| Single Unit, Attached | 3 | 0.8% |
| 2 Unit Apartments | 0 | 0.0% |
| 3 or 4 Unit Apartments | 8 | 2.1% |
| 5 to 9 Unit Apartments | 10 | 2.7% |
| 10 or more Apartments | 13 | 3.5% |
| Mobile Home / Other | 7 | 1.9% |
| Total | 372 | 100.0% |
Housing Structures by Occupancy in Glen Ullin
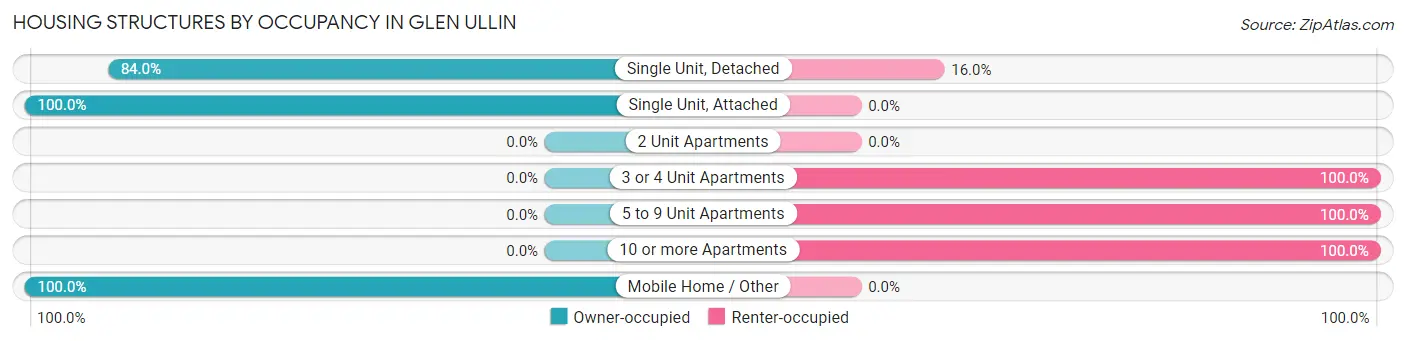
| Structure Type | Owner-occupied | Renter-occupied |
| Single Unit, Detached | 278 (84.0%) | 53 (16.0%) |
| Single Unit, Attached | 3 (100.0%) | 0 (0.0%) |
| 2 Unit Apartments | 0 (0.0%) | 0 (0.0%) |
| 3 or 4 Unit Apartments | 0 (0.0%) | 8 (100.0%) |
| 5 to 9 Unit Apartments | 0 (0.0%) | 10 (100.0%) |
| 10 or more Apartments | 0 (0.0%) | 13 (100.0%) |
| Mobile Home / Other | 7 (100.0%) | 0 (0.0%) |
| Total | 288 (77.4%) | 84 (22.6%) |
Housing Structures by Number of Rooms in Glen Ullin
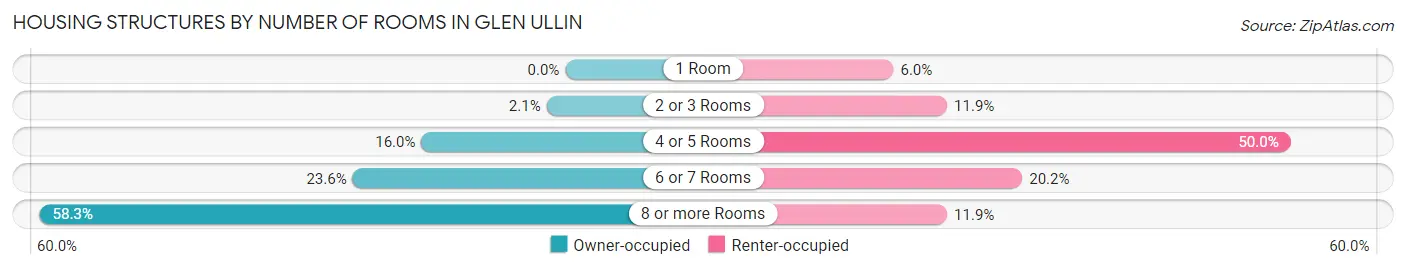
| Number of Rooms | Owner-occupied | Renter-occupied |
| 1 Room | 0 (0.0%) | 5 (5.9%) |
| 2 or 3 Rooms | 6 (2.1%) | 10 (11.9%) |
| 4 or 5 Rooms | 46 (16.0%) | 42 (50.0%) |
| 6 or 7 Rooms | 68 (23.6%) | 17 (20.2%) |
| 8 or more Rooms | 168 (58.3%) | 10 (11.9%) |
| Total | 288 (100.0%) | 84 (100.0%) |
Housing Structure by Heating Type in Glen Ullin
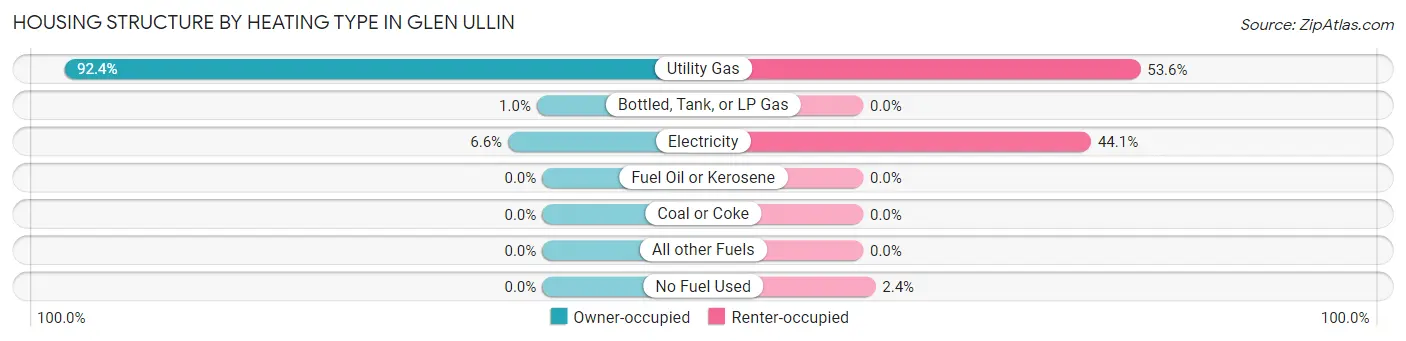
| Heating Type | Owner-occupied | Renter-occupied |
| Utility Gas | 266 (92.4%) | 45 (53.6%) |
| Bottled, Tank, or LP Gas | 3 (1.0%) | 0 (0.0%) |
| Electricity | 19 (6.6%) | 37 (44.1%) |
| Fuel Oil or Kerosene | 0 (0.0%) | 0 (0.0%) |
| Coal or Coke | 0 (0.0%) | 0 (0.0%) |
| All other Fuels | 0 (0.0%) | 0 (0.0%) |
| No Fuel Used | 0 (0.0%) | 2 (2.4%) |
| Total | 288 (100.0%) | 84 (100.0%) |
Household Vehicle Usage in Glen Ullin
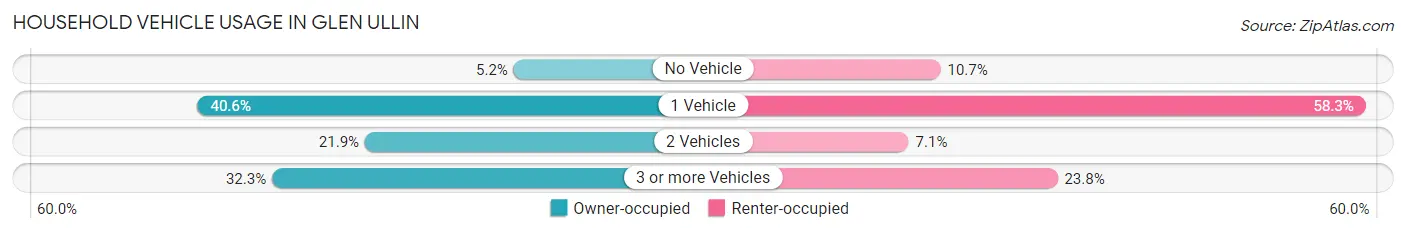
| Vehicles per Household | Owner-occupied | Renter-occupied |
| No Vehicle | 15 (5.2%) | 9 (10.7%) |
| 1 Vehicle | 117 (40.6%) | 49 (58.3%) |
| 2 Vehicles | 63 (21.9%) | 6 (7.1%) |
| 3 or more Vehicles | 93 (32.3%) | 20 (23.8%) |
| Total | 288 (100.0%) | 84 (100.0%) |
Real Estate & Mortgages in Glen Ullin
Real Estate and Mortgage Overview in Glen Ullin
| Characteristic | Without Mortgage | With Mortgage |
| Housing Units | 190 | 98 |
| Median Property Value | $66,900 | $156,300 |
| Median Household Income | $29,239 | $13 |
| Monthly Housing Costs | $422 | $0 |
| Real Estate Taxes | $1,144 | $0 |
Property Value by Mortgage Status in Glen Ullin
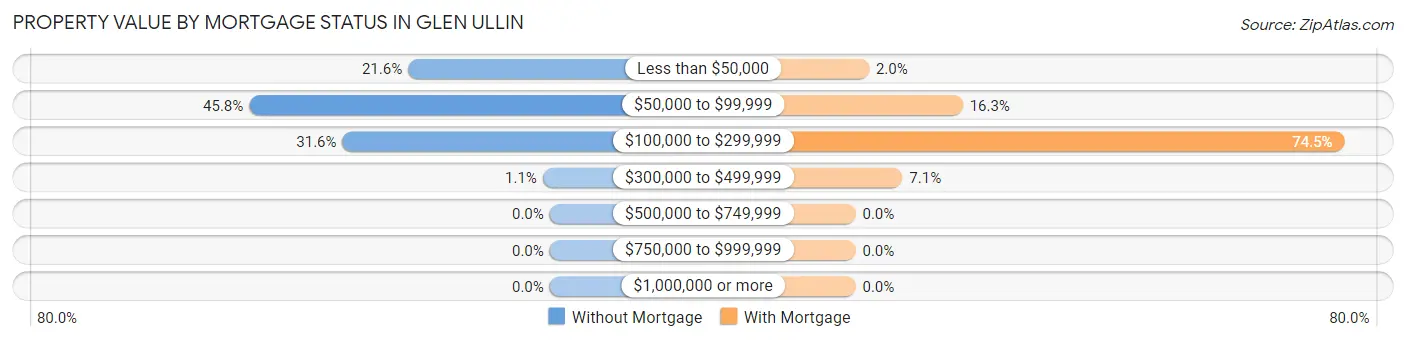
| Property Value | Without Mortgage | With Mortgage |
| Less than $50,000 | 41 (21.6%) | 2 (2.0%) |
| $50,000 to $99,999 | 87 (45.8%) | 16 (16.3%) |
| $100,000 to $299,999 | 60 (31.6%) | 73 (74.5%) |
| $300,000 to $499,999 | 2 (1.1%) | 7 (7.1%) |
| $500,000 to $749,999 | 0 (0.0%) | 0 (0.0%) |
| $750,000 to $999,999 | 0 (0.0%) | 0 (0.0%) |
| $1,000,000 or more | 0 (0.0%) | 0 (0.0%) |
| Total | 190 (100.0%) | 98 (100.0%) |
Household Income by Mortgage Status in Glen Ullin
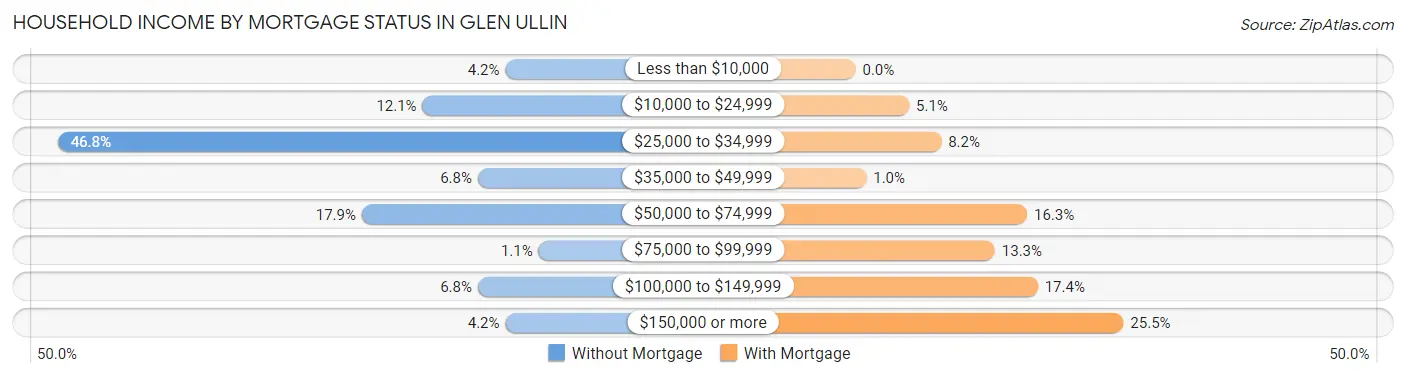
| Household Income | Without Mortgage | With Mortgage |
| Less than $10,000 | 8 (4.2%) | 0 (0.0%) |
| $10,000 to $24,999 | 23 (12.1%) | 5 (5.1%) |
| $25,000 to $34,999 | 89 (46.8%) | 8 (8.2%) |
| $35,000 to $49,999 | 13 (6.8%) | 1 (1.0%) |
| $50,000 to $74,999 | 34 (17.9%) | 16 (16.3%) |
| $75,000 to $99,999 | 2 (1.1%) | 13 (13.3%) |
| $100,000 to $149,999 | 13 (6.8%) | 17 (17.3%) |
| $150,000 or more | 8 (4.2%) | 25 (25.5%) |
| Total | 190 (100.0%) | 98 (100.0%) |
Property Value to Household Income Ratio in Glen Ullin
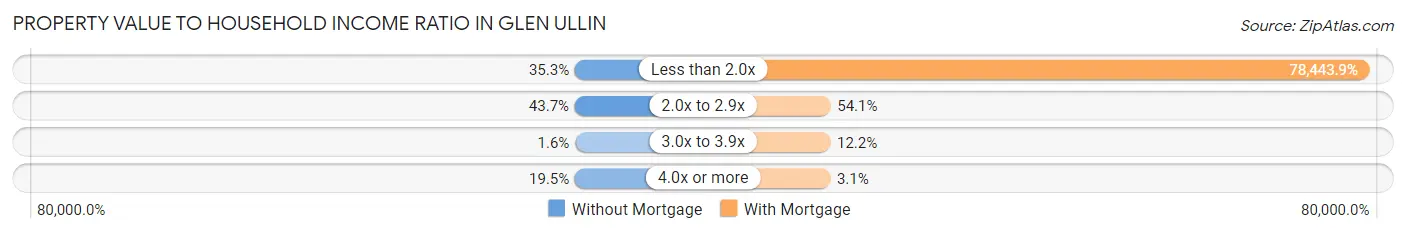
| Value-to-Income Ratio | Without Mortgage | With Mortgage |
| Less than 2.0x | 67 (35.3%) | 76,875 (78,443.9%) |
| 2.0x to 2.9x | 83 (43.7%) | 53 (54.1%) |
| 3.0x to 3.9x | 3 (1.6%) | 12 (12.2%) |
| 4.0x or more | 37 (19.5%) | 3 (3.1%) |
| Total | 190 (100.0%) | 98 (100.0%) |
Real Estate Taxes by Mortgage Status in Glen Ullin
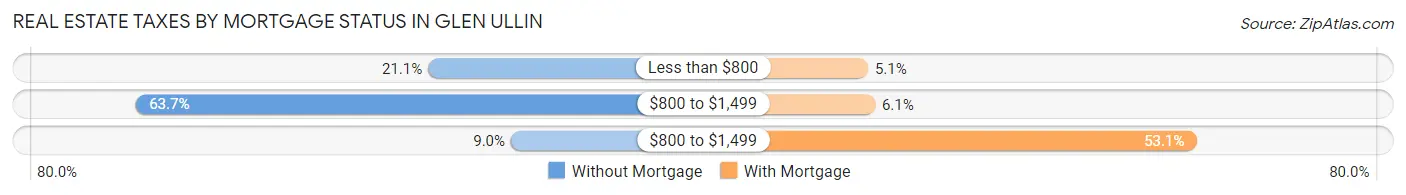
| Property Taxes | Without Mortgage | With Mortgage |
| Less than $800 | 40 (21.0%) | 5 (5.1%) |
| $800 to $1,499 | 121 (63.7%) | 6 (6.1%) |
| $800 to $1,499 | 17 (8.9%) | 52 (53.1%) |
| Total | 190 (100.0%) | 98 (100.0%) |
Health & Disability in Glen Ullin
Health Insurance Coverage by Age in Glen Ullin
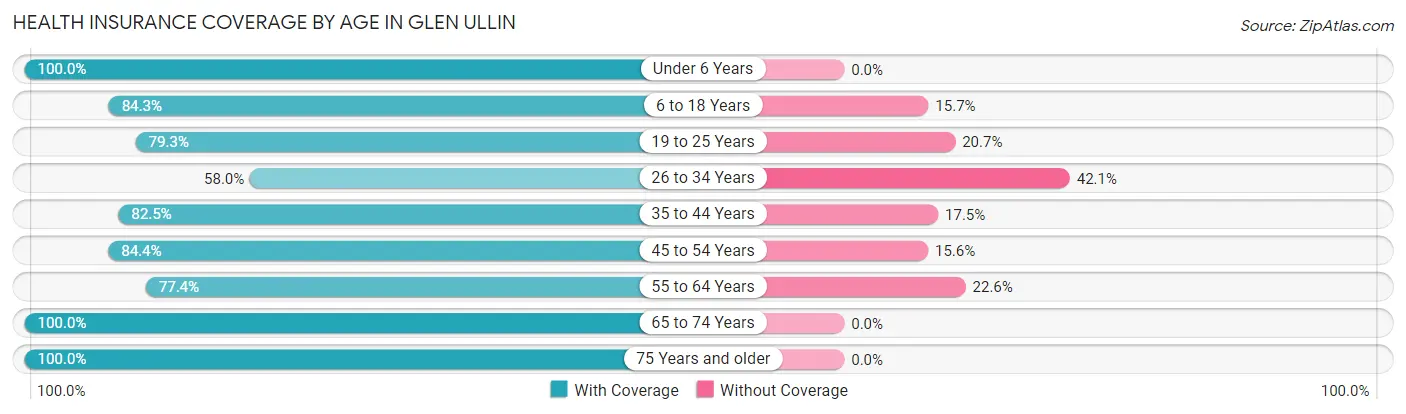
| Age Bracket | With Coverage | Without Coverage |
| Under 6 Years | 82 (100.0%) | 0 (0.0%) |
| 6 to 18 Years | 43 (84.3%) | 8 (15.7%) |
| 19 to 25 Years | 46 (79.3%) | 12 (20.7%) |
| 26 to 34 Years | 51 (58.0%) | 37 (42.0%) |
| 35 to 44 Years | 33 (82.5%) | 7 (17.5%) |
| 45 to 54 Years | 54 (84.4%) | 10 (15.6%) |
| 55 to 64 Years | 65 (77.4%) | 19 (22.6%) |
| 65 to 74 Years | 86 (100.0%) | 0 (0.0%) |
| 75 Years and older | 124 (100.0%) | 0 (0.0%) |
| Total | 584 (86.3%) | 93 (13.7%) |
Health Insurance Coverage by Citizenship Status in Glen Ullin
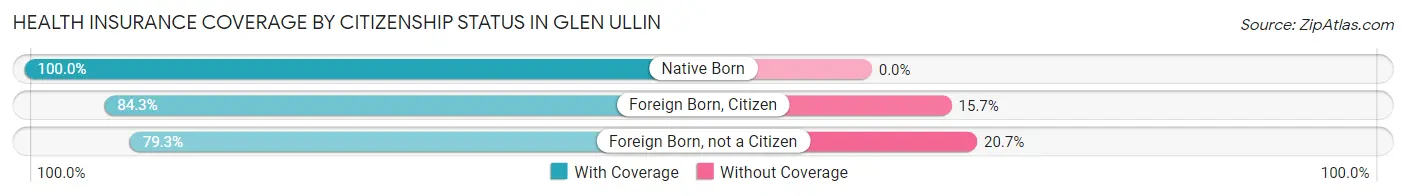
| Citizenship Status | With Coverage | Without Coverage |
| Native Born | 82 (100.0%) | 0 (0.0%) |
| Foreign Born, Citizen | 43 (84.3%) | 8 (15.7%) |
| Foreign Born, not a Citizen | 46 (79.3%) | 12 (20.7%) |
Health Insurance Coverage by Household Income in Glen Ullin
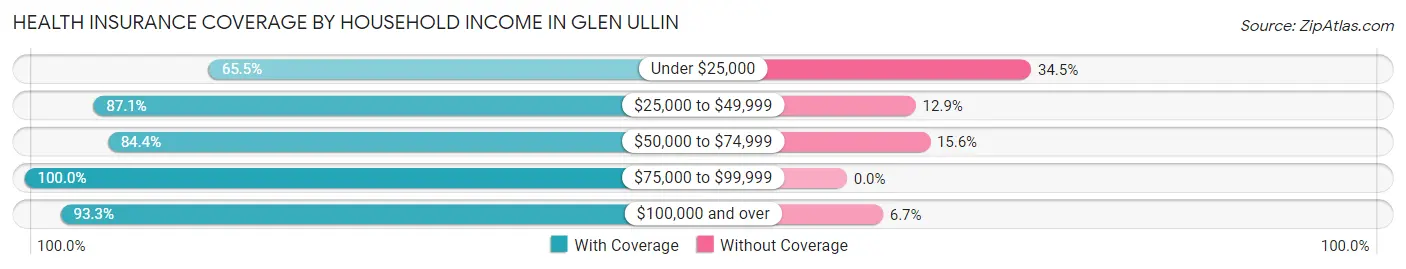
| Household Income | With Coverage | Without Coverage |
| Under $25,000 | 55 (65.5%) | 29 (34.5%) |
| $25,000 to $49,999 | 189 (87.1%) | 28 (12.9%) |
| $50,000 to $74,999 | 130 (84.4%) | 24 (15.6%) |
| $75,000 to $99,999 | 44 (100.0%) | 0 (0.0%) |
| $100,000 and over | 166 (93.3%) | 12 (6.7%) |
Public vs Private Health Insurance Coverage by Age in Glen Ullin
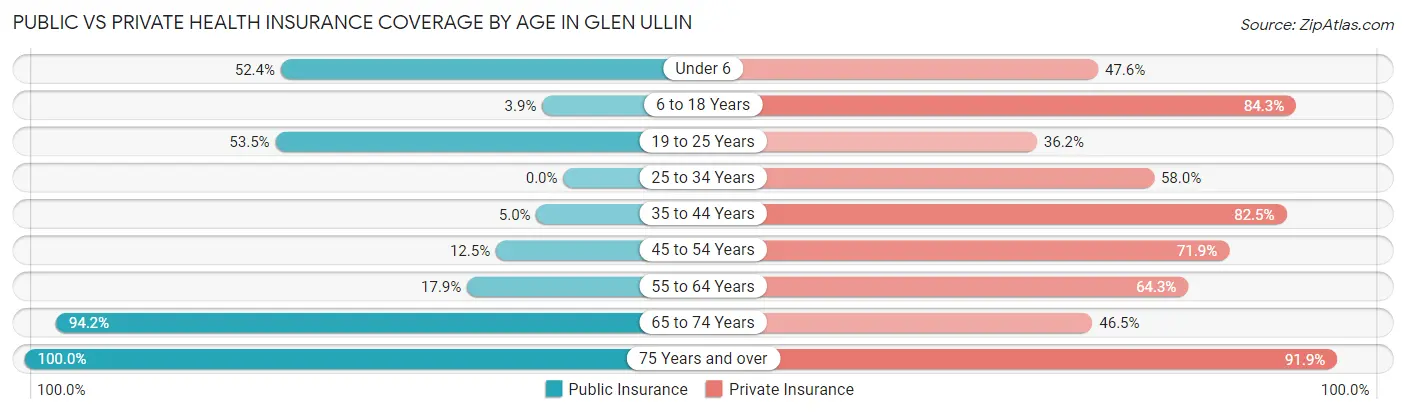
| Age Bracket | Public Insurance | Private Insurance |
| Under 6 | 43 (52.4%) | 39 (47.6%) |
| 6 to 18 Years | 2 (3.9%) | 43 (84.3%) |
| 19 to 25 Years | 31 (53.4%) | 21 (36.2%) |
| 25 to 34 Years | 0 (0.0%) | 51 (58.0%) |
| 35 to 44 Years | 2 (5.0%) | 33 (82.5%) |
| 45 to 54 Years | 8 (12.5%) | 46 (71.9%) |
| 55 to 64 Years | 15 (17.9%) | 54 (64.3%) |
| 65 to 74 Years | 81 (94.2%) | 40 (46.5%) |
| 75 Years and over | 124 (100.0%) | 114 (91.9%) |
| Total | 306 (45.2%) | 441 (65.1%) |
Disability Status by Sex by Age in Glen Ullin
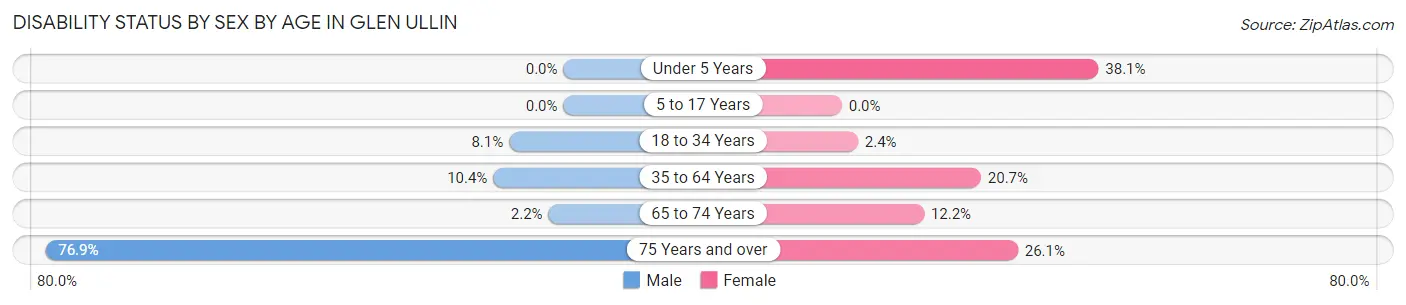
| Age Bracket | Male | Female |
| Under 5 Years | 0 (0.0%) | 8 (38.1%) |
| 5 to 17 Years | 0 (0.0%) | 0 (0.0%) |
| 18 to 34 Years | 5 (8.1%) | 2 (2.4%) |
| 35 to 64 Years | 10 (10.4%) | 19 (20.6%) |
| 65 to 74 Years | 1 (2.2%) | 5 (12.2%) |
| 75 Years and over | 10 (76.9%) | 29 (26.1%) |
Disability Class by Sex by Age in Glen Ullin
Disability Class: Hearing Difficulty
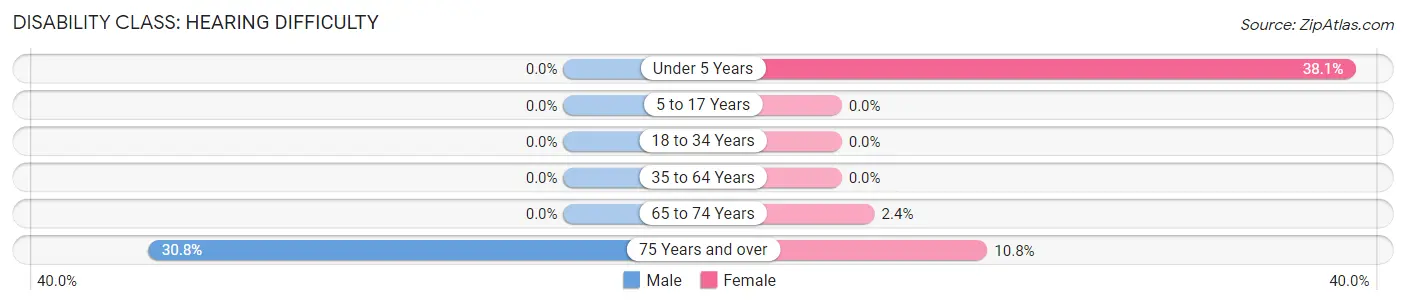
| Age Bracket | Male | Female |
| Under 5 Years | 0 (0.0%) | 8 (38.1%) |
| 5 to 17 Years | 0 (0.0%) | 0 (0.0%) |
| 18 to 34 Years | 0 (0.0%) | 0 (0.0%) |
| 35 to 64 Years | 0 (0.0%) | 0 (0.0%) |
| 65 to 74 Years | 0 (0.0%) | 1 (2.4%) |
| 75 Years and over | 4 (30.8%) | 12 (10.8%) |
Disability Class: Vision Difficulty
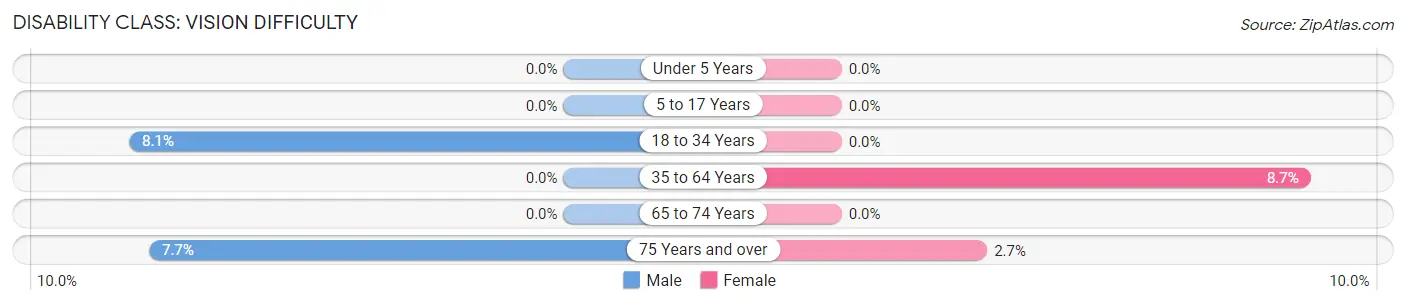
| Age Bracket | Male | Female |
| Under 5 Years | 0 (0.0%) | 0 (0.0%) |
| 5 to 17 Years | 0 (0.0%) | 0 (0.0%) |
| 18 to 34 Years | 5 (8.1%) | 0 (0.0%) |
| 35 to 64 Years | 0 (0.0%) | 8 (8.7%) |
| 65 to 74 Years | 0 (0.0%) | 0 (0.0%) |
| 75 Years and over | 1 (7.7%) | 3 (2.7%) |
Disability Class: Cognitive Difficulty
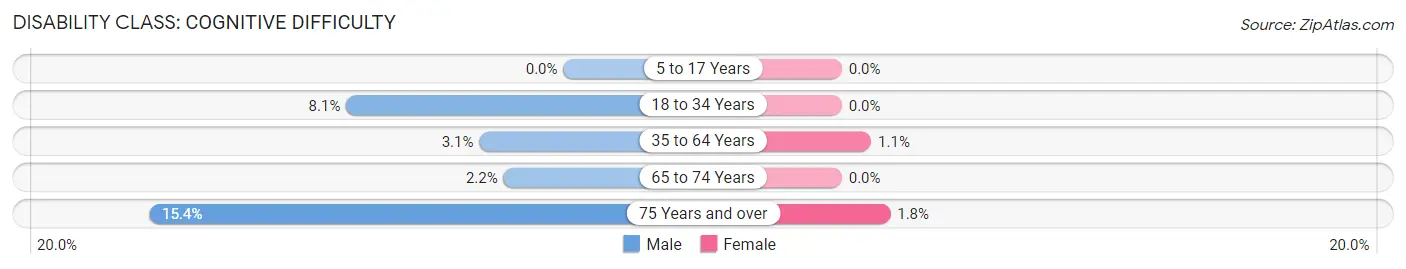
| Age Bracket | Male | Female |
| 5 to 17 Years | 0 (0.0%) | 0 (0.0%) |
| 18 to 34 Years | 5 (8.1%) | 0 (0.0%) |
| 35 to 64 Years | 3 (3.1%) | 1 (1.1%) |
| 65 to 74 Years | 1 (2.2%) | 0 (0.0%) |
| 75 Years and over | 2 (15.4%) | 2 (1.8%) |
Disability Class: Ambulatory Difficulty
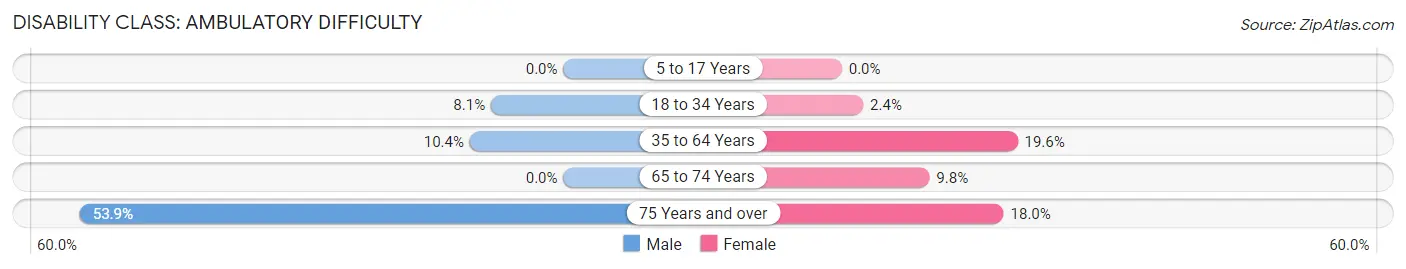
| Age Bracket | Male | Female |
| 5 to 17 Years | 0 (0.0%) | 0 (0.0%) |
| 18 to 34 Years | 5 (8.1%) | 2 (2.4%) |
| 35 to 64 Years | 10 (10.4%) | 18 (19.6%) |
| 65 to 74 Years | 0 (0.0%) | 4 (9.8%) |
| 75 Years and over | 7 (53.8%) | 20 (18.0%) |
Disability Class: Self-Care Difficulty
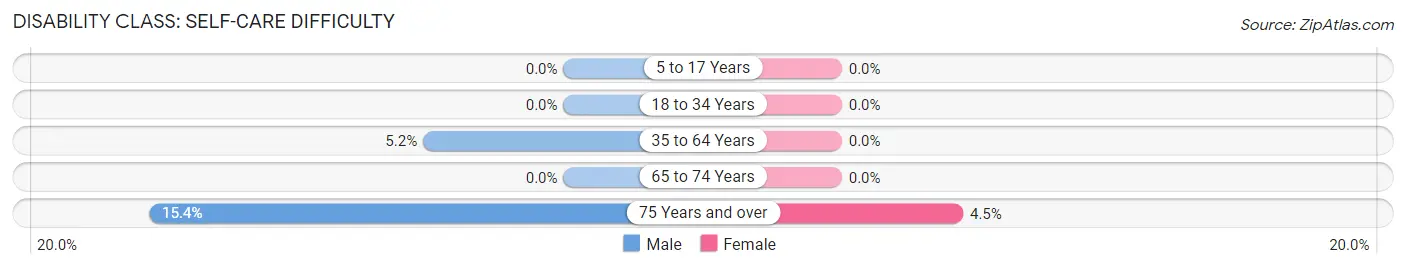
| Age Bracket | Male | Female |
| 5 to 17 Years | 0 (0.0%) | 0 (0.0%) |
| 18 to 34 Years | 0 (0.0%) | 0 (0.0%) |
| 35 to 64 Years | 5 (5.2%) | 0 (0.0%) |
| 65 to 74 Years | 0 (0.0%) | 0 (0.0%) |
| 75 Years and over | 2 (15.4%) | 5 (4.5%) |
Technology Access in Glen Ullin
Computing Device Access in Glen Ullin
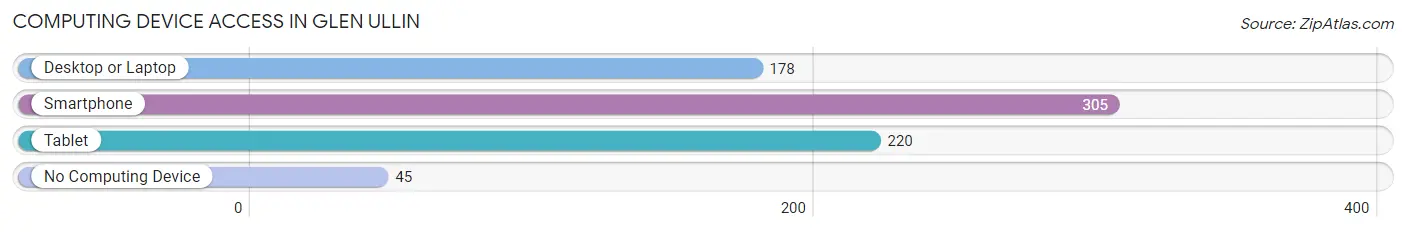
| Device Type | # Households | % Households |
| Desktop or Laptop | 178 | 47.8% |
| Smartphone | 305 | 82.0% |
| Tablet | 220 | 59.1% |
| No Computing Device | 45 | 12.1% |
| Total | 372 | 100.0% |
Internet Access in Glen Ullin
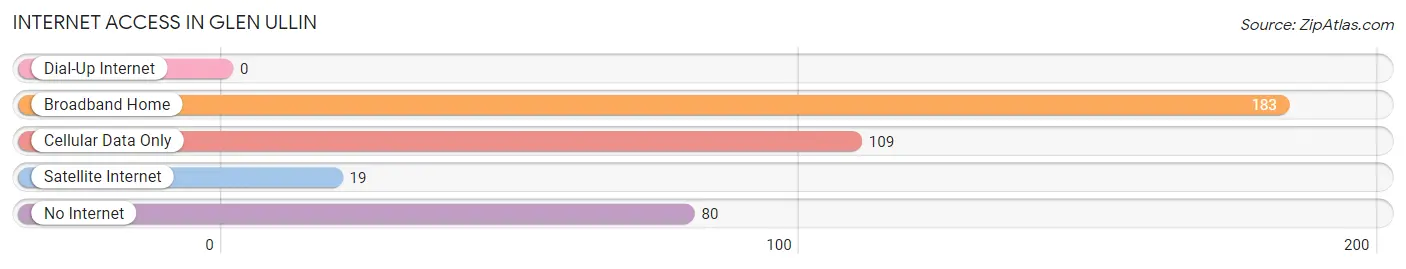
| Internet Type | # Households | % Households |
| Dial-Up Internet | 0 | 0.0% |
| Broadband Home | 183 | 49.2% |
| Cellular Data Only | 109 | 29.3% |
| Satellite Internet | 19 | 5.1% |
| No Internet | 80 | 21.5% |
| Total | 372 | 100.0% |
Glen Ullin Summary
Glen Ullin is a small city located in Morton County, North Dakota. It is situated in the heart of the Missouri Plateau, and is surrounded by rolling hills and prairies. The city has a population of 1,093 people, according to the 2010 census.
History
Glen Ullin was founded in 1883 by a group of German-Russian immigrants. The city was named after Ullin, a small village in Russia. The settlers were attracted to the area due to its fertile soil and abundant water supply. The first settlers built a log cabin and a small store, and the town quickly grew. By the early 1900s, Glen Ullin had become a thriving agricultural community.
In the early 1900s, the city was home to a variety of businesses, including a bank, a hotel, a blacksmith shop, a livery stable, and a creamery. The city also had a school, a post office, and a newspaper.
Geography
Glen Ullin is located in the Missouri Plateau, which is a region of rolling hills and prairies. The city is situated in the center of Morton County, and is surrounded by the cities of Hebron, Flasher, and New Salem. The city is located at an elevation of 1,845 feet above sea level.
The city is located in the Central Time Zone, and is approximately 40 miles from the state capital of Bismarck. The city is also located near the Missouri River, which is a major source of water for the area.
Economy
The economy of Glen Ullin is largely based on agriculture. The city is home to several farms, which produce a variety of crops, including wheat, corn, soybeans, and sunflowers. The city also has a number of businesses, including a grocery store, a hardware store, and a restaurant.
The city is also home to a number of manufacturing companies, including a furniture factory, a plastics factory, and a metal fabrication plant. The city is also home to a number of oil and gas companies, which are involved in the exploration and production of oil and gas in the area.
Demographics
According to the 2010 census, the population of Glen Ullin was 1,093 people. The population is predominantly white, with a small percentage of African Americans, Native Americans, and Asians. The median age of the population is 44.7 years, and the median household income is $41,944.
The city has a high rate of homeownership, with nearly 80% of the population owning their own homes. The city also has a high rate of educational attainment, with nearly 90% of the population having at least a high school diploma.
Conclusion
Glen Ullin is a small city located in Morton County, North Dakota. The city has a population of 1,093 people, and is largely based on agriculture. The city is home to a variety of businesses, and has a high rate of homeownership and educational attainment. Glen Ullin is a thriving community, and is a great place to live and work.
Common Questions
What is the Total Population of Glen Ullin?
Total Population of Glen Ullin is 739.
What is the Total Male Population of Glen Ullin?
Total Male Population of Glen Ullin is 318.
What is the Total Female Population of Glen Ullin?
Total Female Population of Glen Ullin is 421.
What is the Ratio of Males per 100 Females in Glen Ullin?
There are 75.53 Males per 100 Females in Glen Ullin.
What is the Ratio of Females per 100 Males in Glen Ullin?
There are 132.39 Females per 100 Males in Glen Ullin.
What is the Median Population Age in Glen Ullin?
Median Population Age in Glen Ullin is 52.7 Years.
What is the Average Family Size in Glen Ullin
Average Family Size in Glen Ullin is 2.7 People.
What is the Average Household Size in Glen Ullin
Average Household Size in Glen Ullin is 1.8 People.
What is Per Capita Income in Glen Ullin?
Per Capita income in Glen Ullin is $29,160.
What is the Median Family Income in Glen Ullin?
Median Family Income in Glen Ullin is $68,125.
What is the Median Household income in Glen Ullin?
Median Household Income in Glen Ullin is $43,214.
What is Income or Wage Gap in Glen Ullin?
Income or Wage Gap in Glen Ullin is 45.3%.
Women in Glen Ullin earn 54.7 cents for every dollar earned by a man.
What is Inequality or Gini Index in Glen Ullin?
Inequality or Gini Index in Glen Ullin is 0.42.
How Large is the Labor Force in Glen Ullin?
There are 282 People in the Labor Forcein in Glen Ullin.
What is the Percentage of People in the Labor Force in Glen Ullin?
46.0% of People are in the Labor Force in Glen Ullin.
What is the Unemployment Rate in Glen Ullin?
Unemployment Rate in Glen Ullin is 7.1%.