Towner, ND
Towner Map
Towner Overview
456
TOTAL POPULATION
248
MALE POPULATION
208
FEMALE POPULATION
119.23
MALES / 100 FEMALES
83.87
FEMALES / 100 MALES
38.0
MEDIAN AGE
2.6
AVG FAMILY SIZE
2.1
AVG HOUSEHOLD SIZE
$32,684
PER CAPITA INCOME
$59,531
AVG FAMILY INCOME
$51,500
AVG HOUSEHOLD INCOME
29.2%
WAGE / INCOME GAP [ % ]
70.8¢/ $1
WAGE / INCOME GAP [ $ ]
$16,955
FAMILY INCOME DEFICIT
0.42
INEQUALITY / GINI INDEX
230
LABOR FORCE [ PEOPLE ]
68.7%
PERCENT IN LABOR FORCE
13.0%
UNEMPLOYMENT RATE
Towner Zip Codes
Towner Area Codes
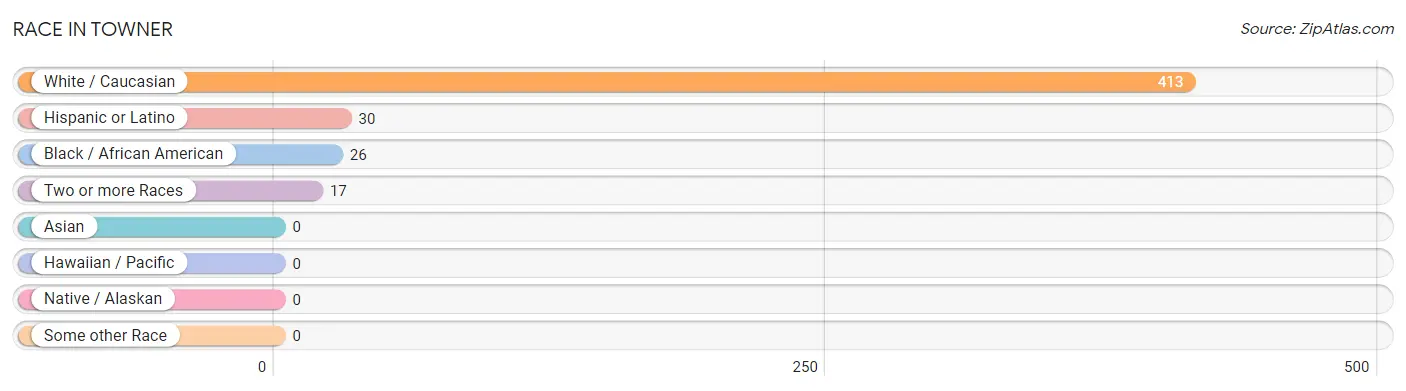
Race in Towner
The most populous races in Towner are White / Caucasian (413 | 90.6%), Hispanic or Latino (30 | 6.6%), and Black / African American (26 | 5.7%).
| Race | # Population | % Population |
| Asian | 0 | 0.0% |
| Black / African American | 26 | 5.7% |
| Hawaiian / Pacific | 0 | 0.0% |
| Hispanic or Latino | 30 | 6.6% |
| Native / Alaskan | 0 | 0.0% |
| White / Caucasian | 413 | 90.6% |
| Two or more Races | 17 | 3.7% |
| Some other Race | 0 | 0.0% |
| Total | 456 | 100.0% |
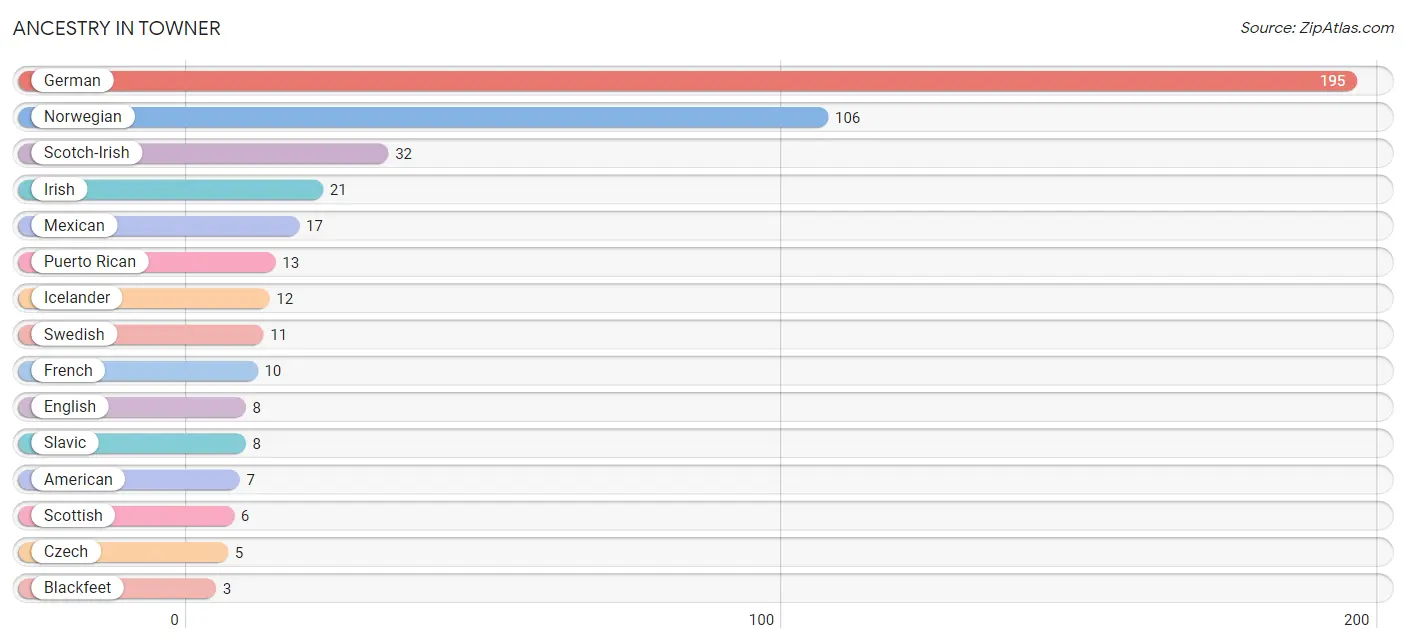
Ancestry in Towner
The most populous ancestries reported in Towner are German (195 | 42.8%), Norwegian (106 | 23.3%), Scotch-Irish (32 | 7.0%), Irish (21 | 4.6%), and Mexican (17 | 3.7%), together accounting for 81.4% of all Towner residents.
| Ancestry | # Population | % Population |
| American | 7 | 1.5% |
| Blackfeet | 3 | 0.7% |
| Canadian | 1 | 0.2% |
| Cherokee | 3 | 0.7% |
| Czech | 5 | 1.1% |
| English | 8 | 1.8% |
| French | 10 | 2.2% |
| German | 195 | 42.8% |
| Icelander | 12 | 2.6% |
| Irish | 21 | 4.6% |
| Korean | 1 | 0.2% |
| Mexican | 17 | 3.7% |
| Norwegian | 106 | 23.3% |
| Pennsylvania German | 3 | 0.7% |
| Puerto Rican | 13 | 2.9% |
| Russian | 1 | 0.2% |
| Scotch-Irish | 32 | 7.0% |
| Scottish | 6 | 1.3% |
| Slavic | 8 | 1.8% |
| Swedish | 11 | 2.4% |
| Swiss | 2 | 0.4% |
| Ukrainian | 2 | 0.4% |
| Welsh | 3 | 0.7% | View All 23 Rows |
Immigrants in Towner
The most numerous immigrant groups reported in Towner came from , and Canada (1 | 0.2%), together accounting for 0.2% of all Towner residents.

| Immigration Origin | # Population | % Population |
| Canada | 1 | 0.2% | View All 1 Rows |
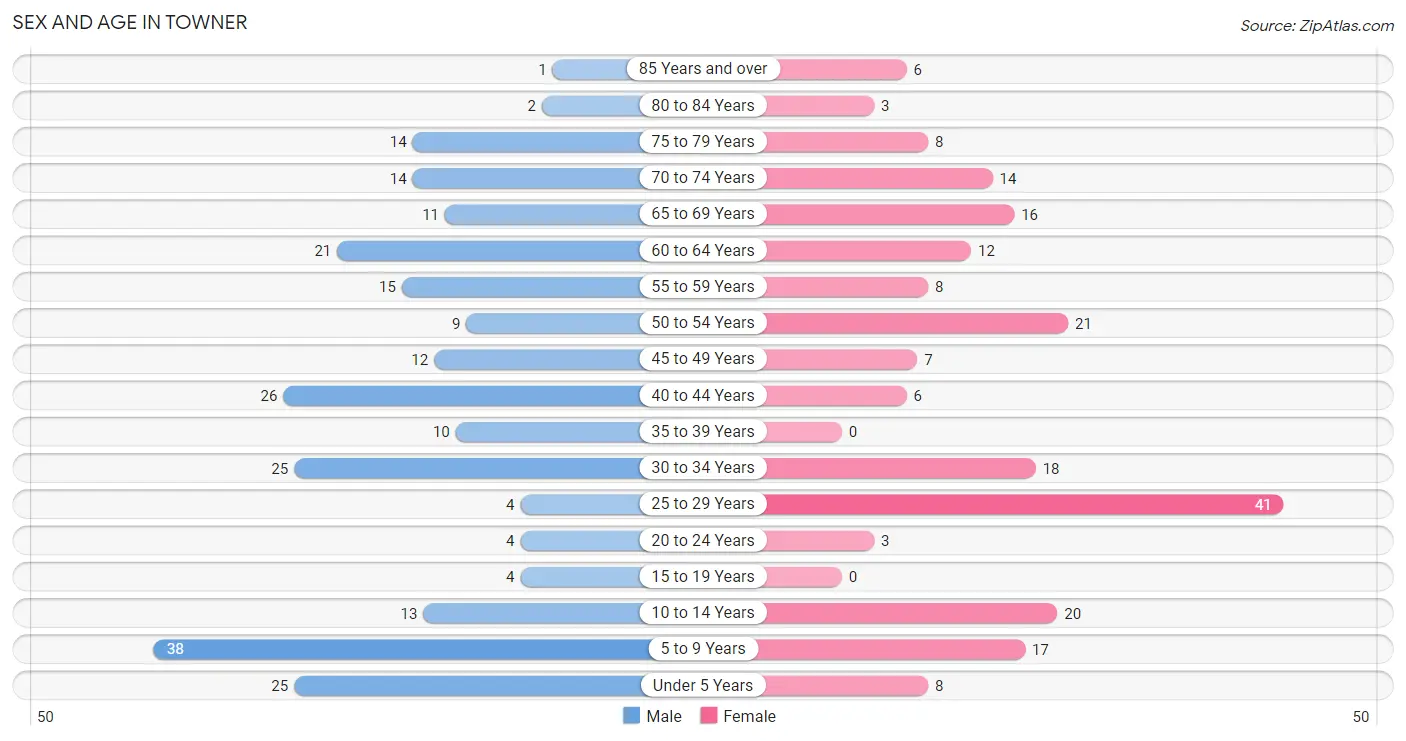
Sex and Age in Towner
Sex and Age in Towner
The most populous age groups in Towner are 5 to 9 Years (38 | 15.3%) for men and 25 to 29 Years (41 | 19.7%) for women.
| Age Bracket | Male | Female |
| Under 5 Years | 25 (10.1%) | 8 (3.8%) |
| 5 to 9 Years | 38 (15.3%) | 17 (8.2%) |
| 10 to 14 Years | 13 (5.2%) | 20 (9.6%) |
| 15 to 19 Years | 4 (1.6%) | 0 (0.0%) |
| 20 to 24 Years | 4 (1.6%) | 3 (1.4%) |
| 25 to 29 Years | 4 (1.6%) | 41 (19.7%) |
| 30 to 34 Years | 25 (10.1%) | 18 (8.6%) |
| 35 to 39 Years | 10 (4.0%) | 0 (0.0%) |
| 40 to 44 Years | 26 (10.5%) | 6 (2.9%) |
| 45 to 49 Years | 12 (4.8%) | 7 (3.4%) |
| 50 to 54 Years | 9 (3.6%) | 21 (10.1%) |
| 55 to 59 Years | 15 (6.0%) | 8 (3.8%) |
| 60 to 64 Years | 21 (8.5%) | 12 (5.8%) |
| 65 to 69 Years | 11 (4.4%) | 16 (7.7%) |
| 70 to 74 Years | 14 (5.7%) | 14 (6.7%) |
| 75 to 79 Years | 14 (5.7%) | 8 (3.8%) |
| 80 to 84 Years | 2 (0.8%) | 3 (1.4%) |
| 85 Years and over | 1 (0.4%) | 6 (2.9%) |
| Total | 248 (100.0%) | 208 (100.0%) |
Families and Households in Towner
Median Family Size in Towner
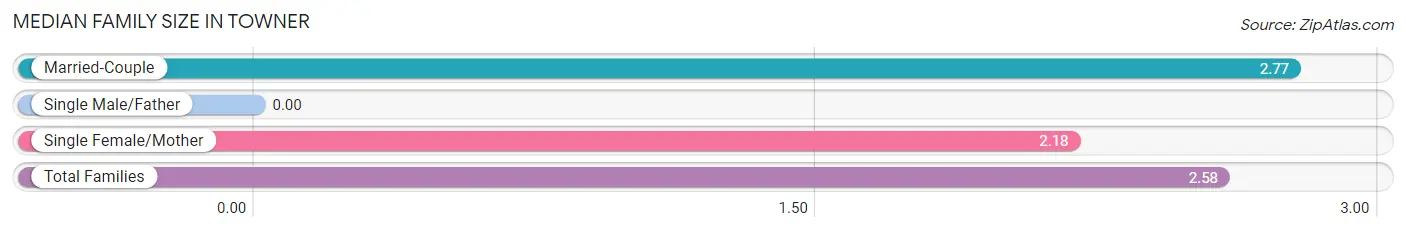
| Family Type | # Families | Family Size |
| Married-Couple | 95 (67.9%) | 2.77 |
| Single Male/Father | 0 (0.0%) | - |
| Single Female/Mother | 45 (32.1%) | 2.18 |
| Total Families | 140 (100.0%) | 2.58 |
Median Household Size in Towner
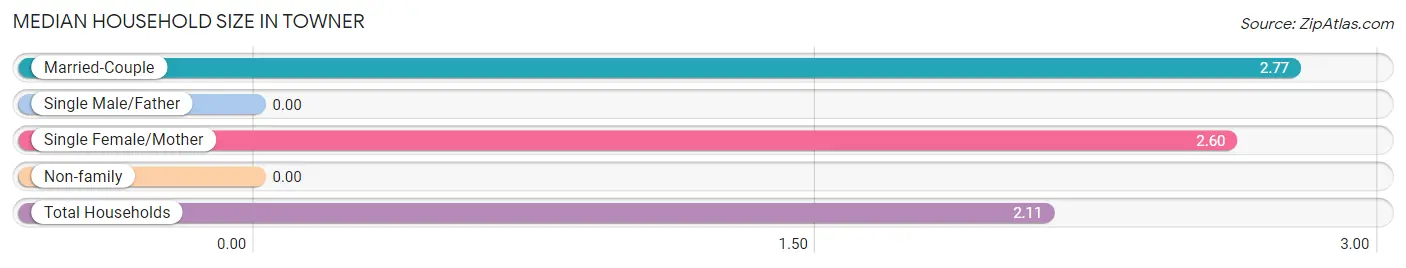
| Household Type | # Households | Household Size |
| Married-Couple | 95 (44.0%) | 2.77 |
| Single Male/Father | 0 (0.0%) | - |
| Single Female/Mother | 45 (20.8%) | 2.60 |
| Non-family | 76 (35.2%) | - |
| Total Households | 216 (100.0%) | 2.11 |
Household Size by Marriage Status in Towner
Out of a total of 216 households in Towner, 140 (64.8%) are family households, while 76 (35.2%) are nonfamily households. The most numerous type of family households are 2-person households, comprising 87, and the most common type of nonfamily households are 1-person households, comprising 76.
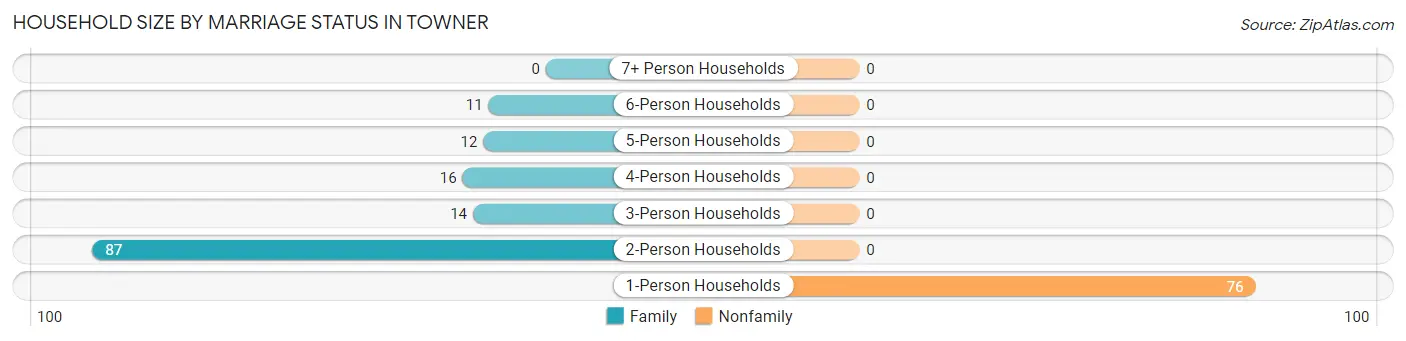
| Household Size | Family Households | Nonfamily Households |
| 1-Person Households | - | 76 (35.2%) |
| 2-Person Households | 87 (40.3%) | 0 (0.0%) |
| 3-Person Households | 14 (6.5%) | 0 (0.0%) |
| 4-Person Households | 16 (7.4%) | 0 (0.0%) |
| 5-Person Households | 12 (5.6%) | 0 (0.0%) |
| 6-Person Households | 11 (5.1%) | 0 (0.0%) |
| 7+ Person Households | 0 (0.0%) | 0 (0.0%) |
| Total | 140 (64.8%) | 76 (35.2%) |
Female Fertility in Towner
Fertility by Age in Towner
Average fertility rate in Towner is 221.0 births per 1,000 women. Women in the age bracket of 20 to 34 years have the highest fertility rate with 274.0 births per 1,000 women. Women in the age bracket of 20 to 34 years acount for 100.0% of all women with births.
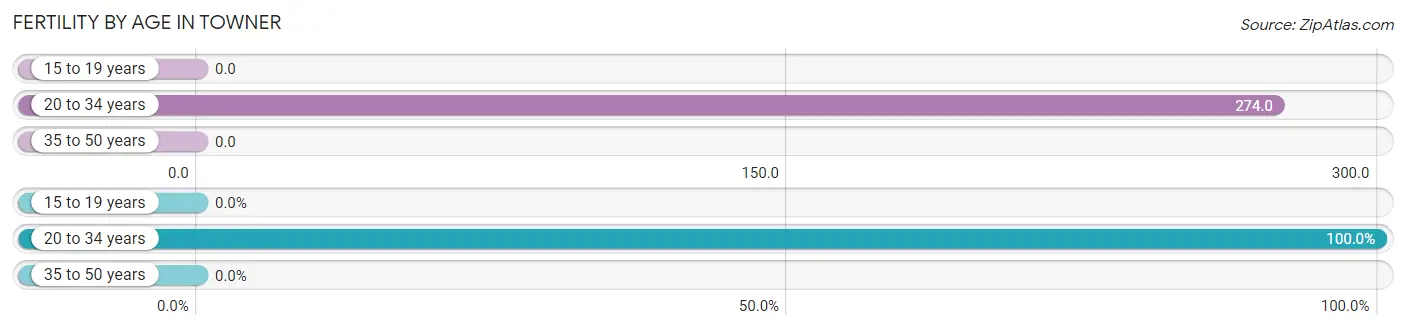
| Age Bracket | Women with Births | Births / 1,000 Women |
| 15 to 19 years | 0 (0.0%) | 0.0 |
| 20 to 34 years | 17 (100.0%) | 274.0 |
| 35 to 50 years | 0 (0.0%) | 0.0 |
| Total | 17 (100.0%) | 221.0 |
Fertility by Age by Marriage Status in Towner
17.6% of women with births (17) in Towner are married. The highest percentage of unmarried women with births falls into 20 to 34 years age bracket with 82.4% of them unmarried at the time of birth, while the lowest percentage of unmarried women with births belong to 20 to 34 years age bracket with 82.4% of them unmarried.
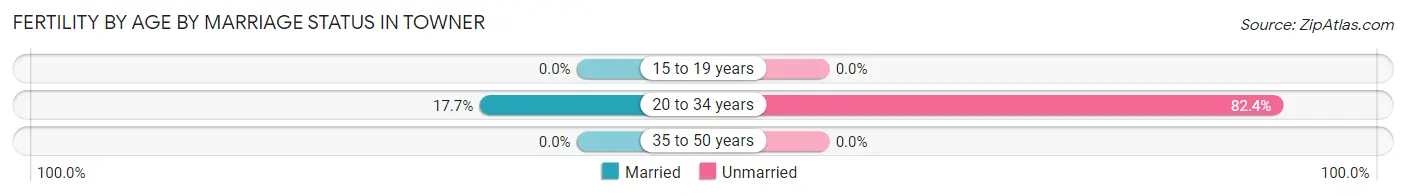
| Age Bracket | Married | Unmarried |
| 15 to 19 years | 0 (0.0%) | 0 (0.0%) |
| 20 to 34 years | 3 (17.6%) | 14 (82.4%) |
| 35 to 50 years | 0 (0.0%) | 0 (0.0%) |
| Total | 3 (17.6%) | 14 (82.4%) |
Fertility by Education in Towner
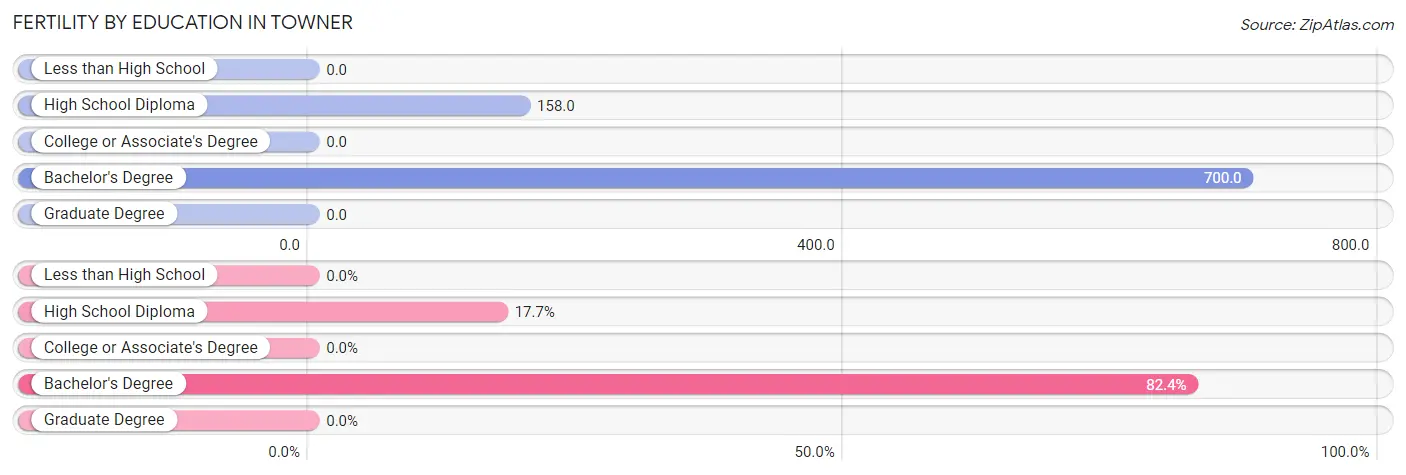
| Educational Attainment | Women with Births | Births / 1,000 Women |
| Less than High School | 0 (0.0%) | 0.0 |
| High School Diploma | 3 (17.6%) | 158.0 |
| College or Associate's Degree | 0 (0.0%) | 0.0 |
| Bachelor's Degree | 14 (82.4%) | 700.0 |
| Graduate Degree | 0 (0.0%) | 0.0 |
| Total | 17 (100.0%) | 221.0 |
Fertility by Education by Marriage Status in Towner
82.4% of women with births in Towner are unmarried. Women with the educational attainment of high school diploma are most likely to be married with 100.0% of them married at childbirth, while women with the educational attainment of bachelor's degree are least likely to be married with 100.0% of them unmarried at childbirth.
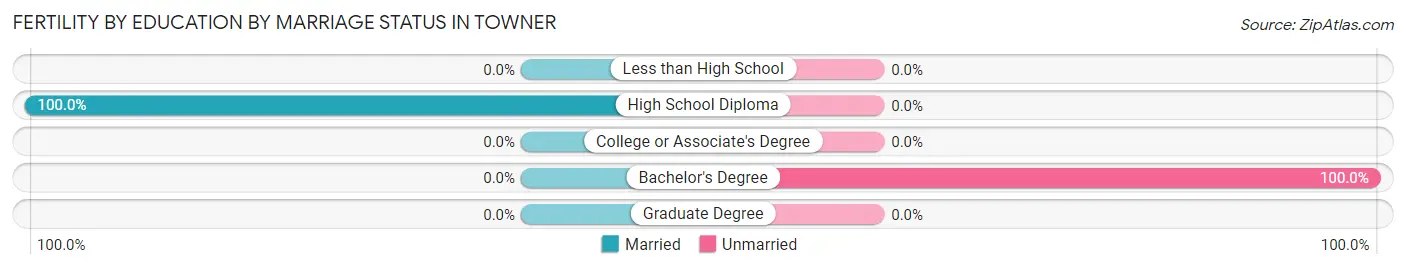
| Educational Attainment | Married | Unmarried |
| Less than High School | 0 (0.0%) | 0 (0.0%) |
| High School Diploma | 3 (100.0%) | 0 (0.0%) |
| College or Associate's Degree | 0 (0.0%) | 0 (0.0%) |
| Bachelor's Degree | 0 (0.0%) | 14 (100.0%) |
| Graduate Degree | 0 (0.0%) | 0 (0.0%) |
| Total | 3 (17.6%) | 14 (82.4%) |
Income in Towner
Income Overview in Towner
Per Capita Income in Towner is $32,684, while median incomes of families and households are $59,531 and $51,500 respectively.
| Characteristic | Number | Measure |
| Per Capita Income | 456 | $32,684 |
| Median Family Income | 140 | $59,531 |
| Mean Family Income | 140 | $77,743 |
| Median Household Income | 216 | $51,500 |
| Mean Household Income | 216 | $69,898 |
| Income Deficit | 140 | $16,955 |
| Wage / Income Gap (%) | 456 | 29.19% |
| Wage / Income Gap ($) | 456 | 70.81¢ per $1 |
| Gini / Inequality Index | 456 | 0.42 |
Earnings by Sex in Towner
Average Earnings in Towner are $37,000, $41,528 for men and $29,408 for women, a difference of 29.2%.
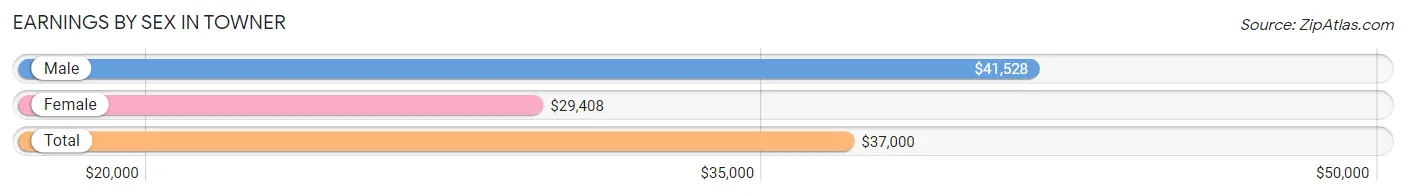
| Sex | Number | Average Earnings |
| Male | 139 (58.4%) | $41,528 |
| Female | 99 (41.6%) | $29,408 |
| Total | 238 (100.0%) | $37,000 |
Earnings by Sex by Income Bracket in Towner
The most common earnings brackets in Towner are $25,000 to $29,999 for men (26 | 18.7%) and $25,000 to $29,999 for women (25 | 25.3%).
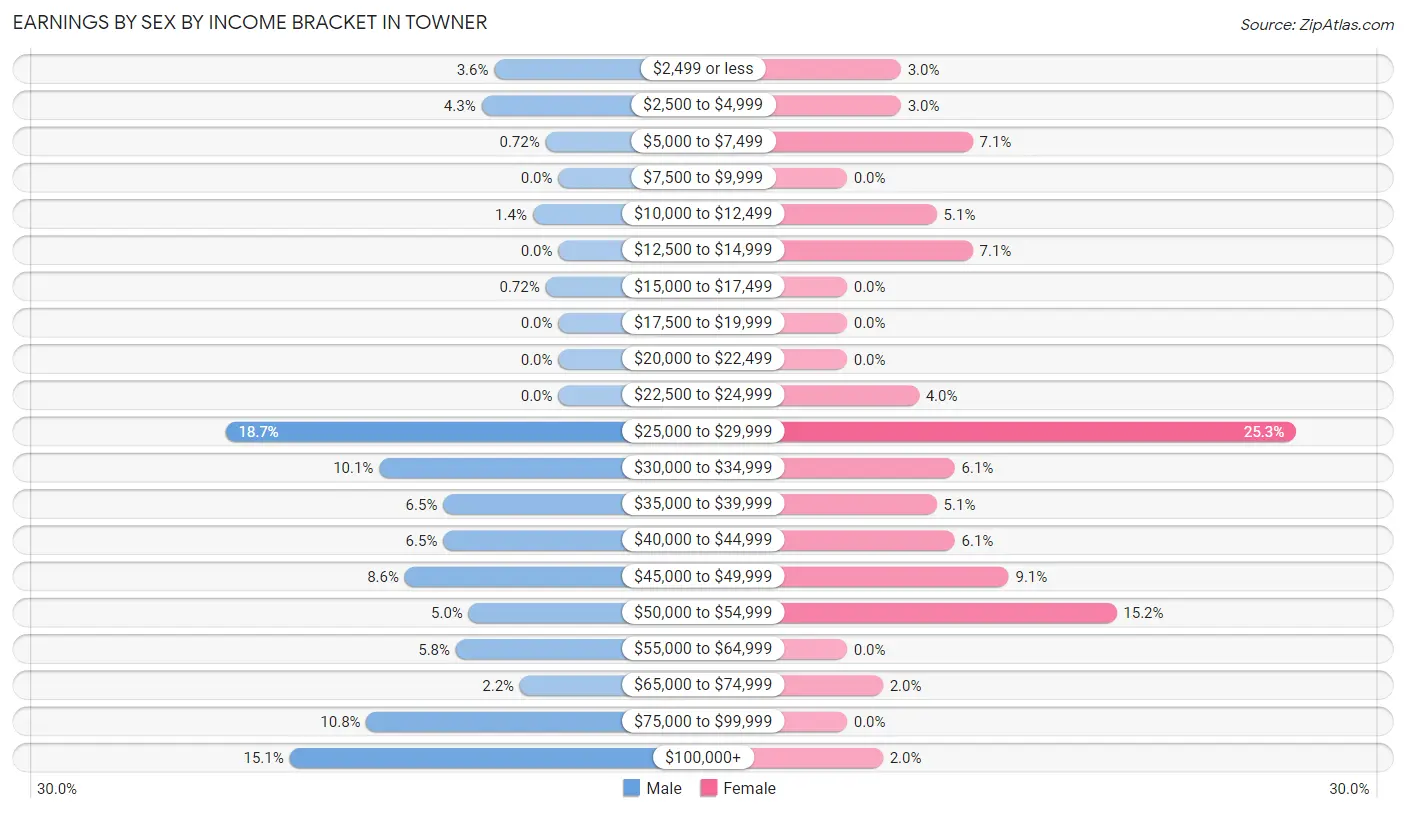
| Income | Male | Female |
| $2,499 or less | 5 (3.6%) | 3 (3.0%) |
| $2,500 to $4,999 | 6 (4.3%) | 3 (3.0%) |
| $5,000 to $7,499 | 1 (0.7%) | 7 (7.1%) |
| $7,500 to $9,999 | 0 (0.0%) | 0 (0.0%) |
| $10,000 to $12,499 | 2 (1.4%) | 5 (5.1%) |
| $12,500 to $14,999 | 0 (0.0%) | 7 (7.1%) |
| $15,000 to $17,499 | 1 (0.7%) | 0 (0.0%) |
| $17,500 to $19,999 | 0 (0.0%) | 0 (0.0%) |
| $20,000 to $22,499 | 0 (0.0%) | 0 (0.0%) |
| $22,500 to $24,999 | 0 (0.0%) | 4 (4.0%) |
| $25,000 to $29,999 | 26 (18.7%) | 25 (25.3%) |
| $30,000 to $34,999 | 14 (10.1%) | 6 (6.1%) |
| $35,000 to $39,999 | 9 (6.5%) | 5 (5.1%) |
| $40,000 to $44,999 | 9 (6.5%) | 6 (6.1%) |
| $45,000 to $49,999 | 12 (8.6%) | 9 (9.1%) |
| $50,000 to $54,999 | 7 (5.0%) | 15 (15.1%) |
| $55,000 to $64,999 | 8 (5.8%) | 0 (0.0%) |
| $65,000 to $74,999 | 3 (2.2%) | 2 (2.0%) |
| $75,000 to $99,999 | 15 (10.8%) | 0 (0.0%) |
| $100,000+ | 21 (15.1%) | 2 (2.0%) |
| Total | 139 (100.0%) | 99 (100.0%) |
Earnings by Sex by Educational Attainment in Towner
Average earnings in Towner are $45,156 for men and $29,605 for women, a difference of 34.4%. Men with an educational attainment of less than high school enjoy the highest average annual earnings of $117,679, while those with college or associate's degree education earn the least with $40,694. Women with an educational attainment of bachelor's degree earn the most with the average annual earnings of $48,250, while those with high school diploma education have the smallest earnings of $28,571.
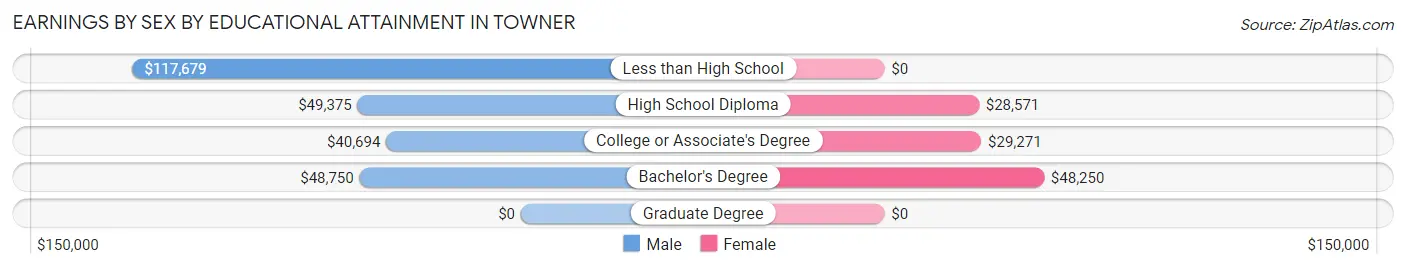
| Educational Attainment | Male Income | Female Income |
| Less than High School | $117,679 | $0 |
| High School Diploma | $49,375 | $28,571 |
| College or Associate's Degree | $40,694 | $29,271 |
| Bachelor's Degree | $48,750 | $48,250 |
| Graduate Degree | - | - |
| Total | $45,156 | $29,605 |
Family Income in Towner
Family Income Brackets in Towner
According to the Towner family income data, there are 30 families falling into the $75,000 to $99,999 income range, which is the most common income bracket and makes up 21.4% of all families.
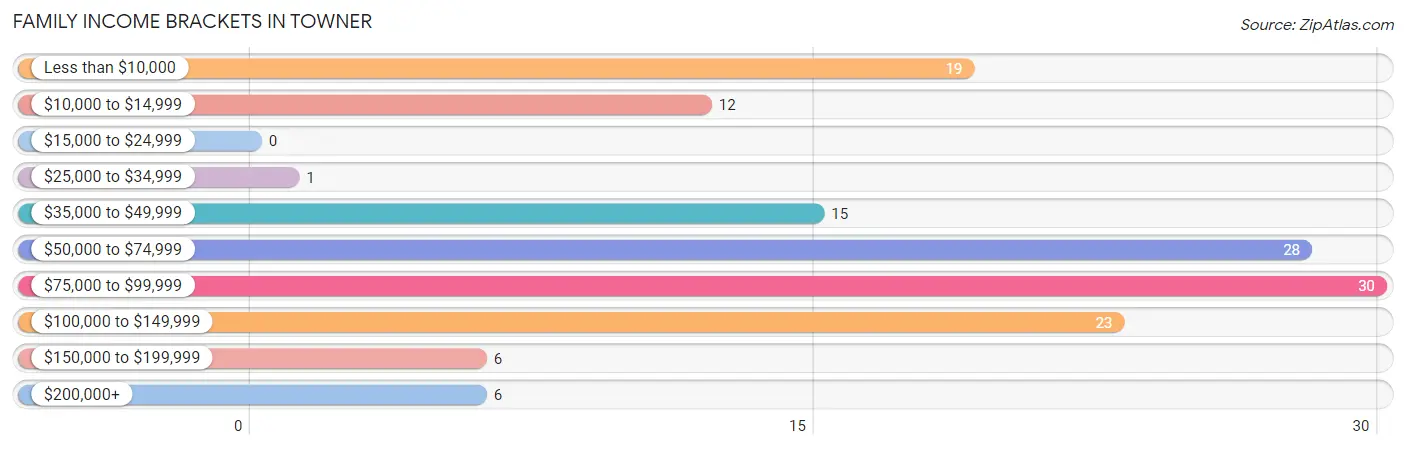
| Income Bracket | # Families | % Families |
| Less than $10,000 | 19 | 13.6% |
| $10,000 to $14,999 | 12 | 8.6% |
| $15,000 to $24,999 | 0 | 0.0% |
| $25,000 to $34,999 | 1 | 0.7% |
| $35,000 to $49,999 | 15 | 10.7% |
| $50,000 to $74,999 | 28 | 20.0% |
| $75,000 to $99,999 | 30 | 21.4% |
| $100,000 to $149,999 | 23 | 16.4% |
| $150,000 to $199,999 | 6 | 4.3% |
| $200,000+ | 6 | 4.3% |
Family Income by Famaliy Size in Towner
3-person families (14 | 10.0%) account for the highest median family income in Towner with $78,750 per family, while 3-person families (14 | 10.0%) have the highest median income of $26,250 per family member.
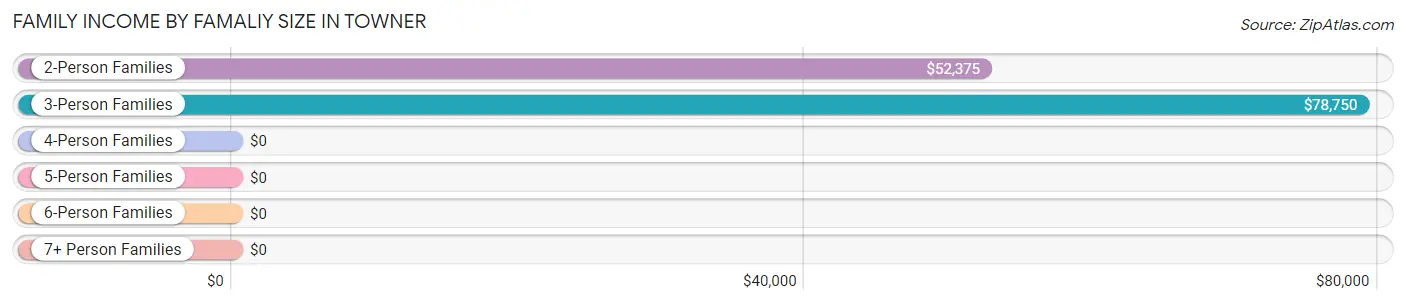
| Income Bracket | # Families | Median Income |
| 2-Person Families | 87 (62.1%) | $52,375 |
| 3-Person Families | 14 (10.0%) | $78,750 |
| 4-Person Families | 28 (20.0%) | $0 |
| 5-Person Families | 0 (0.0%) | $0 |
| 6-Person Families | 11 (7.9%) | $0 |
| 7+ Person Families | 0 (0.0%) | $0 |
| Total | 140 (100.0%) | $59,531 |
Family Income by Number of Earners in Towner
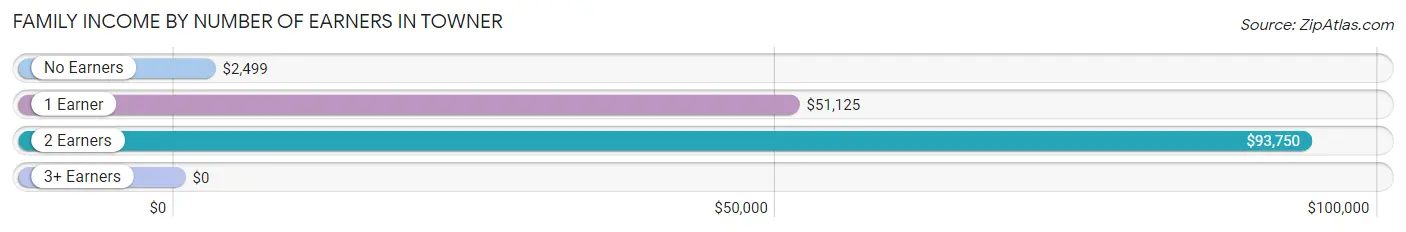
| Number of Earners | # Families | Median Income |
| No Earners | 33 (23.6%) | $2,499 |
| 1 Earner | 37 (26.4%) | $51,125 |
| 2 Earners | 69 (49.3%) | $93,750 |
| 3+ Earners | 1 (0.7%) | $0 |
| Total | 140 (100.0%) | $59,531 |
Household Income in Towner
Household Income Brackets in Towner
With 45 households falling in the category, the $35,000 to $49,999 income range is the most frequent in Towner, accounting for 20.8% of all households. In contrast, only 6 households (2.8%) fall into the $15,000 to $24,999 income bracket, making it the least populous group.
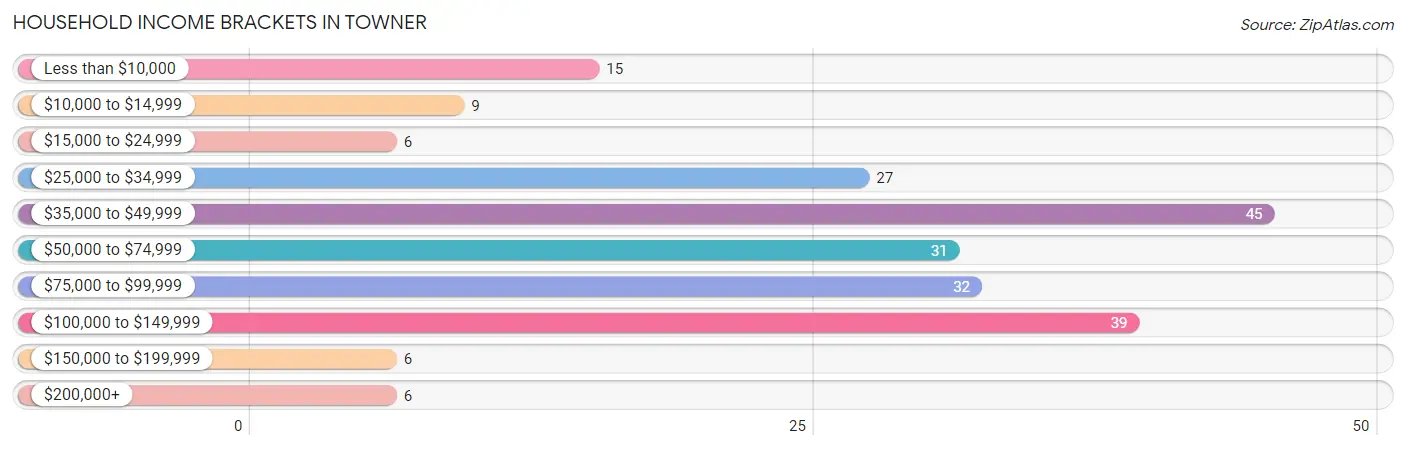
| Income Bracket | # Households | % Households |
| Less than $10,000 | 15 | 6.9% |
| $10,000 to $14,999 | 9 | 4.2% |
| $15,000 to $24,999 | 6 | 2.8% |
| $25,000 to $34,999 | 27 | 12.5% |
| $35,000 to $49,999 | 45 | 20.8% |
| $50,000 to $74,999 | 31 | 14.4% |
| $75,000 to $99,999 | 32 | 14.8% |
| $100,000 to $149,999 | 39 | 18.1% |
| $150,000 to $199,999 | 6 | 2.8% |
| $200,000+ | 6 | 2.8% |
Household Income by Householder Age in Towner
The median household income in Towner is $51,500, with the highest median household income of $73,125 found in the 65+ years age bracket for the primary householder. A total of 53 households (24.5%) fall into this category. Meanwhile, the 15 to 24 years age bracket for the primary householder has the lowest median household income of $0, with 3 households (1.4%) in this group.
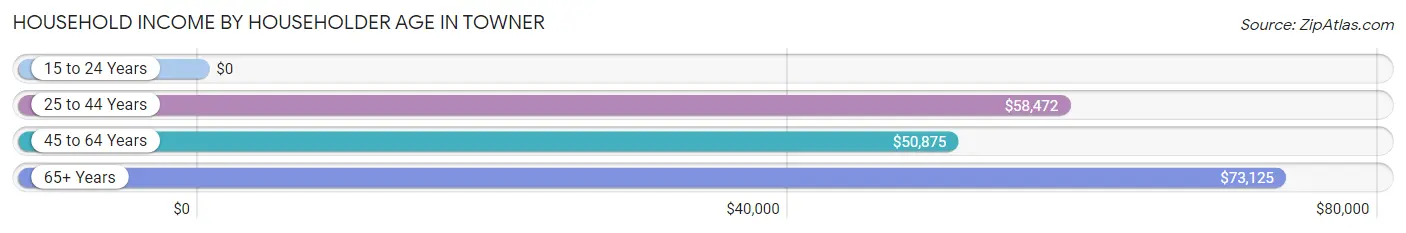
| Income Bracket | # Households | Median Income |
| 15 to 24 Years | 3 (1.4%) | $0 |
| 25 to 44 Years | 85 (39.4%) | $58,472 |
| 45 to 64 Years | 75 (34.7%) | $50,875 |
| 65+ Years | 53 (24.5%) | $73,125 |
| Total | 216 (100.0%) | $51,500 |
Poverty in Towner
Income Below Poverty by Sex and Age in Towner
With 9.7% poverty level for males and 21.6% for females among the residents of Towner, 16 and 17 year old males and 6 to 11 year old females are the most vulnerable to poverty, with 3 males (75.0%) and 6 females (46.2%) in their respective age groups living below the poverty level.
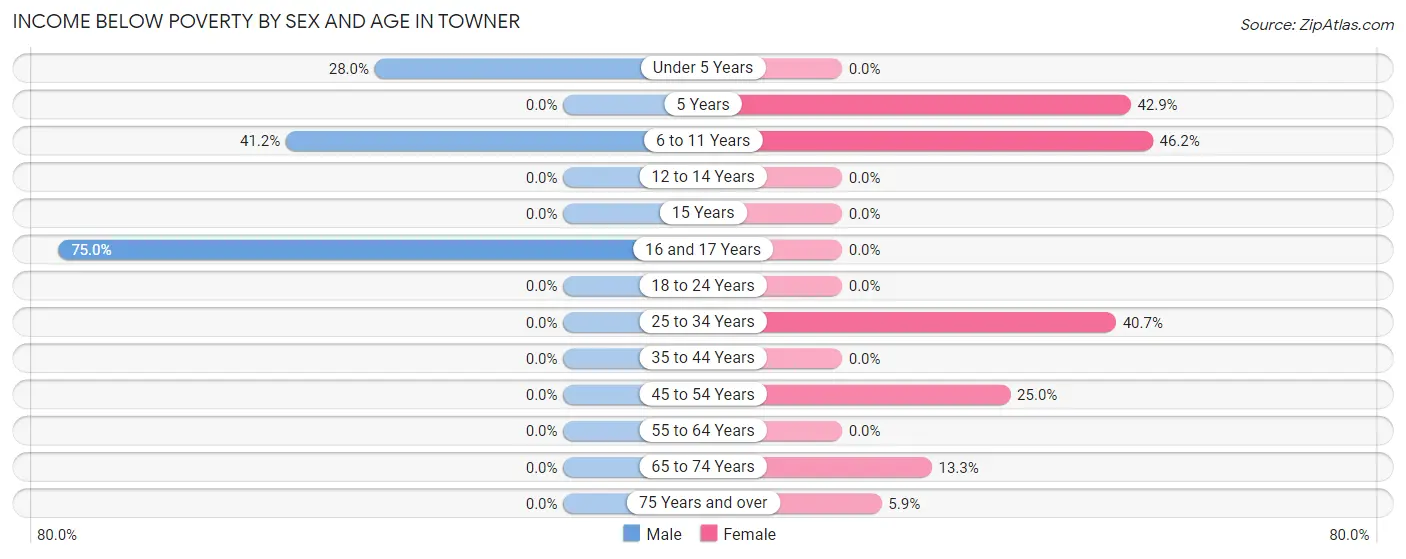
| Age Bracket | Male | Female |
| Under 5 Years | 7 (28.0%) | 0 (0.0%) |
| 5 Years | 0 (0.0%) | 3 (42.9%) |
| 6 to 11 Years | 14 (41.2%) | 6 (46.2%) |
| 12 to 14 Years | 0 (0.0%) | 0 (0.0%) |
| 15 Years | 0 (0.0%) | 0 (0.0%) |
| 16 and 17 Years | 3 (75.0%) | 0 (0.0%) |
| 18 to 24 Years | 0 (0.0%) | 0 (0.0%) |
| 25 to 34 Years | 0 (0.0%) | 24 (40.7%) |
| 35 to 44 Years | 0 (0.0%) | 0 (0.0%) |
| 45 to 54 Years | 0 (0.0%) | 7 (25.0%) |
| 55 to 64 Years | 0 (0.0%) | 0 (0.0%) |
| 65 to 74 Years | 0 (0.0%) | 4 (13.3%) |
| 75 Years and over | 0 (0.0%) | 1 (5.9%) |
| Total | 24 (9.7%) | 45 (21.6%) |
Income Above Poverty by Sex and Age in Towner
According to the poverty statistics in Towner, males aged 5 years and females aged under 5 years are the age groups that are most secure financially, with 100.0% of males and 100.0% of females in these age groups living above the poverty line.
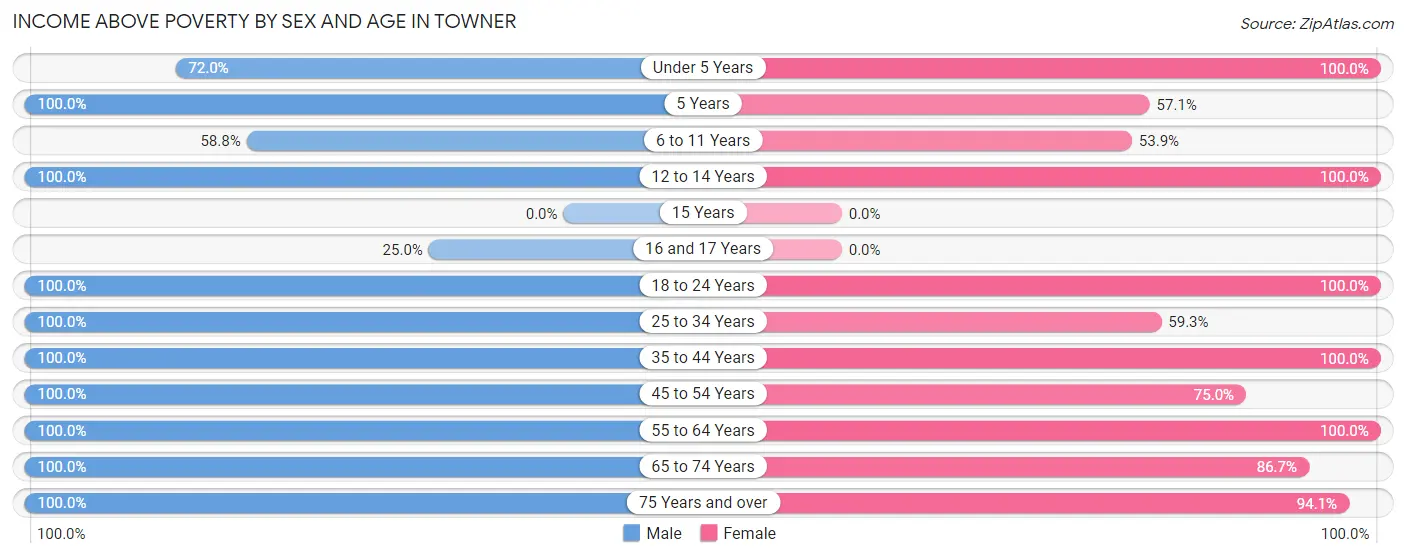
| Age Bracket | Male | Female |
| Under 5 Years | 18 (72.0%) | 8 (100.0%) |
| 5 Years | 14 (100.0%) | 4 (57.1%) |
| 6 to 11 Years | 20 (58.8%) | 7 (53.8%) |
| 12 to 14 Years | 3 (100.0%) | 17 (100.0%) |
| 15 Years | 0 (0.0%) | 0 (0.0%) |
| 16 and 17 Years | 1 (25.0%) | 0 (0.0%) |
| 18 to 24 Years | 4 (100.0%) | 3 (100.0%) |
| 25 to 34 Years | 29 (100.0%) | 35 (59.3%) |
| 35 to 44 Years | 36 (100.0%) | 6 (100.0%) |
| 45 to 54 Years | 21 (100.0%) | 21 (75.0%) |
| 55 to 64 Years | 36 (100.0%) | 20 (100.0%) |
| 65 to 74 Years | 25 (100.0%) | 26 (86.7%) |
| 75 Years and over | 17 (100.0%) | 16 (94.1%) |
| Total | 224 (90.3%) | 163 (78.4%) |
Income Below Poverty Among Married-Couple Families in Towner
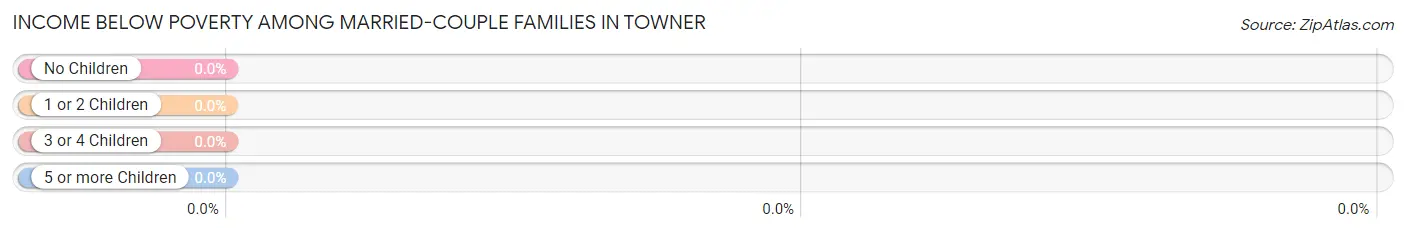
| Children | Above Poverty | Below Poverty |
| No Children | 56 (100.0%) | 0 (0.0%) |
| 1 or 2 Children | 28 (100.0%) | 0 (0.0%) |
| 3 or 4 Children | 11 (100.0%) | 0 (0.0%) |
| 5 or more Children | 0 (0.0%) | 0 (0.0%) |
| Total | 95 (100.0%) | 0 (0.0%) |
Income Below Poverty Among Single-Parent Households in Towner
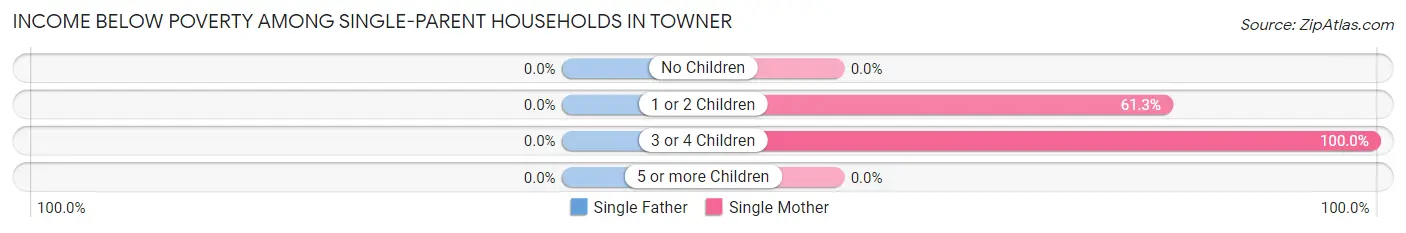
| Children | Single Father | Single Mother |
| No Children | 0 (0.0%) | 0 (0.0%) |
| 1 or 2 Children | 0 (0.0%) | 19 (61.3%) |
| 3 or 4 Children | 0 (0.0%) | 12 (100.0%) |
| 5 or more Children | 0 (0.0%) | 0 (0.0%) |
| Total | 0 (0.0%) | 31 (68.9%) |
Income Below Poverty Among Married-Couple vs Single-Parent Households in Towner
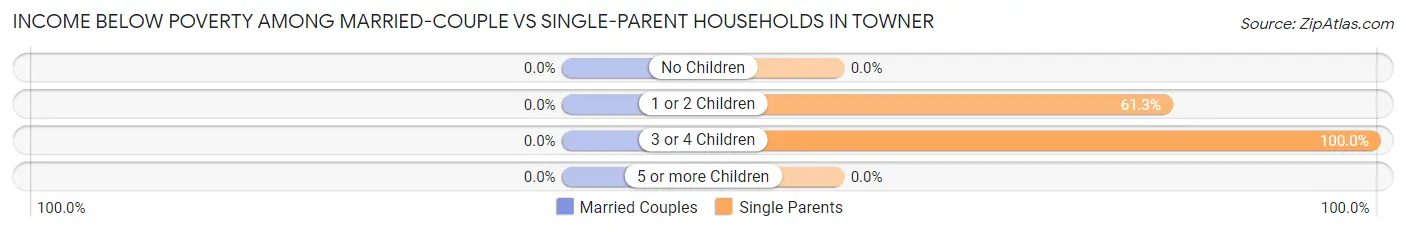
| Children | Married-Couple Families | Single-Parent Households |
| No Children | 0 (0.0%) | 0 (0.0%) |
| 1 or 2 Children | 0 (0.0%) | 19 (61.3%) |
| 3 or 4 Children | 0 (0.0%) | 12 (100.0%) |
| 5 or more Children | 0 (0.0%) | 0 (0.0%) |
| Total | 0 (0.0%) | 31 (68.9%) |
Employment Characteristics in Towner
Employment by Class of Employer in Towner
Among the 196 employed individuals in Towner, private company employees (90 | 45.9%), self-employed (not incorporated) (32 | 16.3%), and state government employees (28 | 14.3%) make up the most common classes of employment.
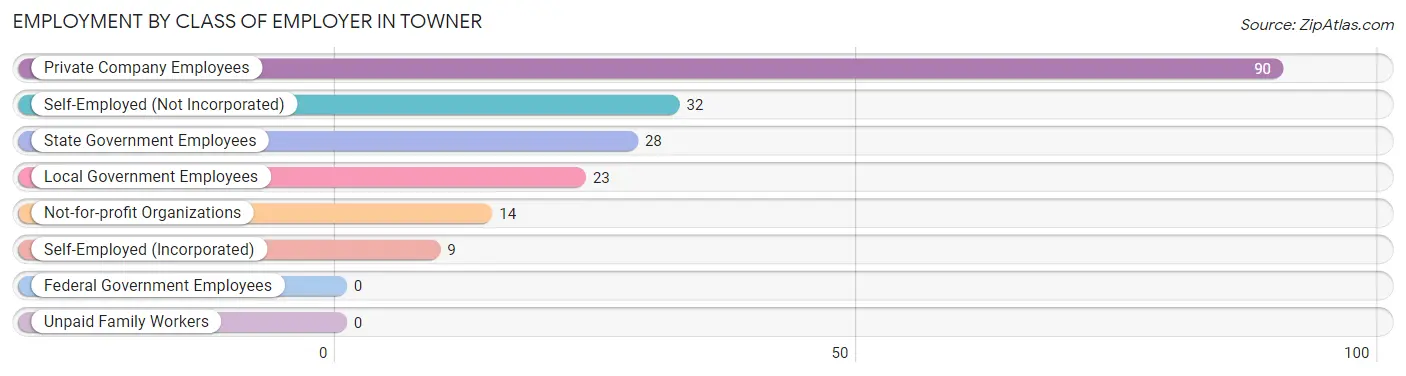
| Employer Class | # Employees | % Employees |
| Private Company Employees | 90 | 45.9% |
| Self-Employed (Incorporated) | 9 | 4.6% |
| Self-Employed (Not Incorporated) | 32 | 16.3% |
| Not-for-profit Organizations | 14 | 7.1% |
| Local Government Employees | 23 | 11.7% |
| State Government Employees | 28 | 14.3% |
| Federal Government Employees | 0 | 0.0% |
| Unpaid Family Workers | 0 | 0.0% |
| Total | 196 | 100.0% |
Employment Status by Age in Towner
According to the labor force statistics for Towner, out of the total population over 16 years of age (335), 68.7% or 230 individuals are in the labor force, with 13.0% or 30 of them unemployed. The age group with the highest labor force participation rate is 35 to 44 years, with 95.2% or 40 individuals in the labor force. Within the labor force, the 25 to 29 years age range has the highest percentage of unemployed individuals, with 42.5% or 17 of them being unemployed.
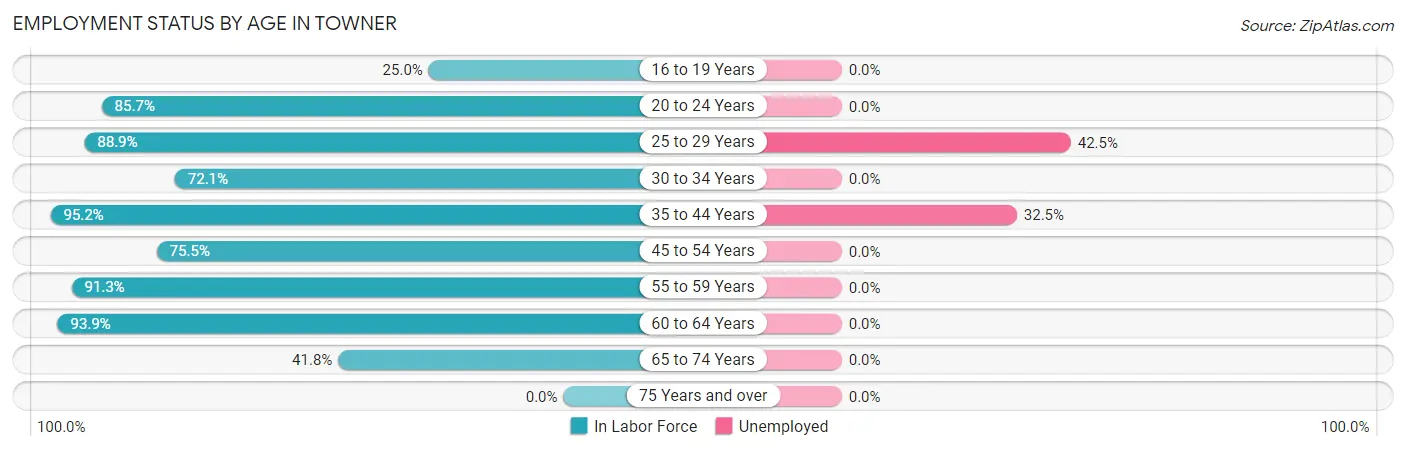
| Age Bracket | In Labor Force | Unemployed |
| 16 to 19 Years | 1 (25.0%) | 0 (0.0%) |
| 20 to 24 Years | 6 (85.7%) | 0 (0.0%) |
| 25 to 29 Years | 40 (88.9%) | 17 (42.5%) |
| 30 to 34 Years | 31 (72.1%) | 0 (0.0%) |
| 35 to 44 Years | 40 (95.2%) | 13 (32.5%) |
| 45 to 54 Years | 37 (75.5%) | 0 (0.0%) |
| 55 to 59 Years | 21 (91.3%) | 0 (0.0%) |
| 60 to 64 Years | 31 (93.9%) | 0 (0.0%) |
| 65 to 74 Years | 23 (41.8%) | 0 (0.0%) |
| 75 Years and over | 0 (0.0%) | 0 (0.0%) |
| Total | 230 (68.7%) | 30 (13.0%) |
Employment Status by Educational Attainment in Towner
According to labor force statistics for Towner, 85.1% of individuals (200) out of the total population between 25 and 64 years of age (235) are in the labor force, with 15.0% or 30 of them being unemployed. The group with the highest labor force participation rate are those with the educational attainment of high school diploma, with 96.8% or 60 individuals in the labor force. Within the labor force, individuals with bachelor's degree or higher education have the highest percentage of unemployment, with 31.8% or 14 of them being unemployed.
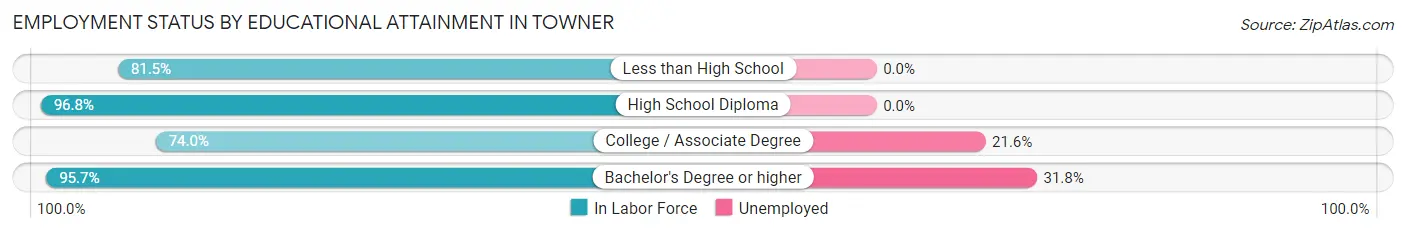
| Educational Attainment | In Labor Force | Unemployed |
| Less than High School | 22 (81.5%) | 0 (0.0%) |
| High School Diploma | 60 (96.8%) | 0 (0.0%) |
| College / Associate Degree | 74 (74.0%) | 22 (21.6%) |
| Bachelor's Degree or higher | 44 (95.7%) | 15 (31.8%) |
| Total | 200 (85.1%) | 35 (15.0%) |
Employment Occupations by Sex in Towner
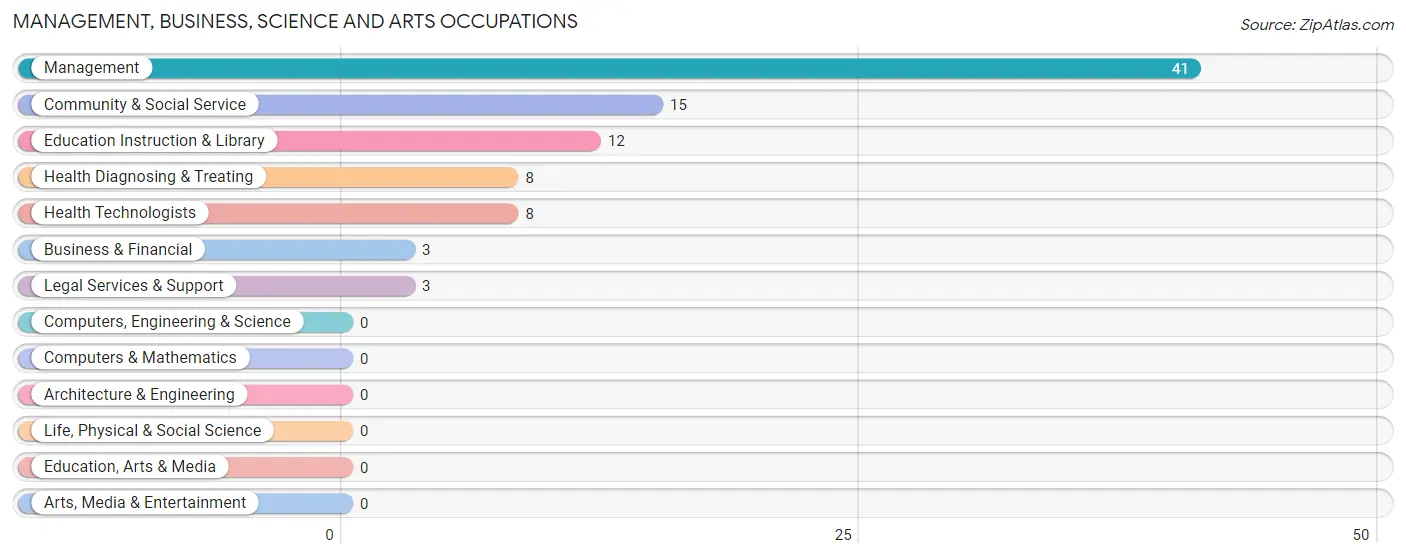
Management, Business, Science and Arts Occupations
The most common Management, Business, Science and Arts occupations in Towner are Management (41 | 20.5%), Community & Social Service (15 | 7.5%), Education Instruction & Library (12 | 6.0%), Health Diagnosing & Treating (8 | 4.0%), and Health Technologists (8 | 4.0%).
Management, Business, Science and Arts Occupations by Sex
Within the Management, Business, Science and Arts occupations in Towner, the most male-oriented occupations are Management (82.9%), Education Instruction & Library (50.0%), and Community & Social Service (40.0%), while the most female-oriented occupations are Business & Financial (100.0%), Legal Services & Support (100.0%), and Health Diagnosing & Treating (100.0%).
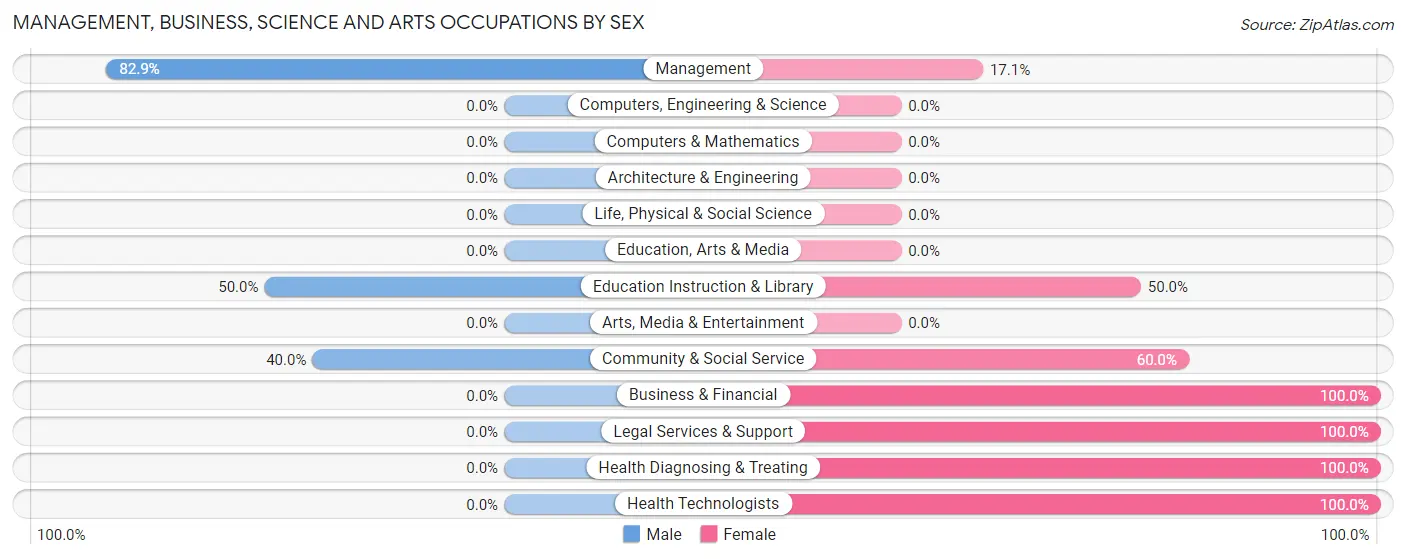
| Occupation | Male | Female |
| Management | 34 (82.9%) | 7 (17.1%) |
| Business & Financial | 0 (0.0%) | 3 (100.0%) |
| Computers, Engineering & Science | 0 (0.0%) | 0 (0.0%) |
| Computers & Mathematics | 0 (0.0%) | 0 (0.0%) |
| Architecture & Engineering | 0 (0.0%) | 0 (0.0%) |
| Life, Physical & Social Science | 0 (0.0%) | 0 (0.0%) |
| Community & Social Service | 6 (40.0%) | 9 (60.0%) |
| Education, Arts & Media | 0 (0.0%) | 0 (0.0%) |
| Legal Services & Support | 0 (0.0%) | 3 (100.0%) |
| Education Instruction & Library | 6 (50.0%) | 6 (50.0%) |
| Arts, Media & Entertainment | 0 (0.0%) | 0 (0.0%) |
| Health Diagnosing & Treating | 0 (0.0%) | 8 (100.0%) |
| Health Technologists | 0 (0.0%) | 8 (100.0%) |
| Total (Category) | 40 (59.7%) | 27 (40.3%) |
| Total (Overall) | 108 (54.0%) | 92 (46.0%) |
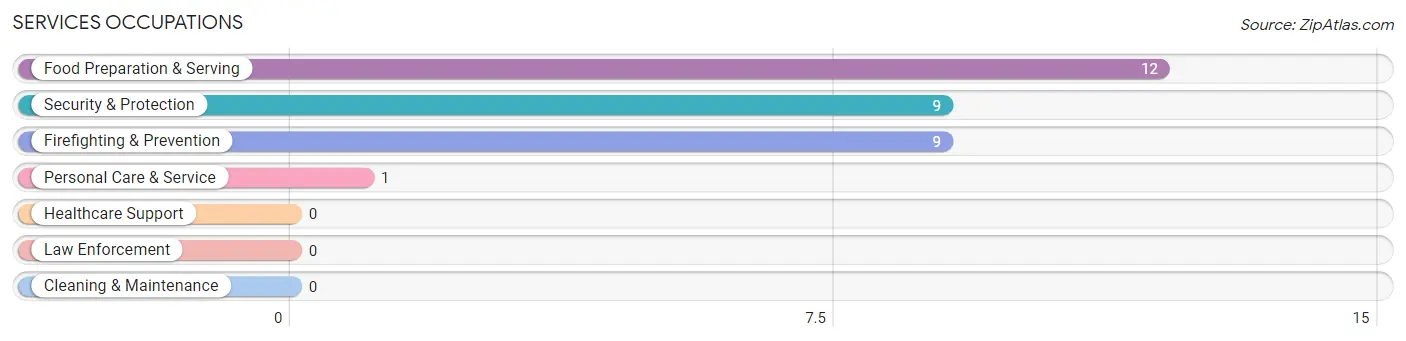
Services Occupations
The most common Services occupations in Towner are Food Preparation & Serving (12 | 6.0%), Security & Protection (9 | 4.5%), Firefighting & Prevention (9 | 4.5%), and Personal Care & Service (1 | 0.5%).
Services Occupations by Sex
Within the Services occupations in Towner, the most male-oriented occupations are Security & Protection (100.0%), and Firefighting & Prevention (100.0%), while the most female-oriented occupations are Food Preparation & Serving (100.0%), and Personal Care & Service (100.0%).
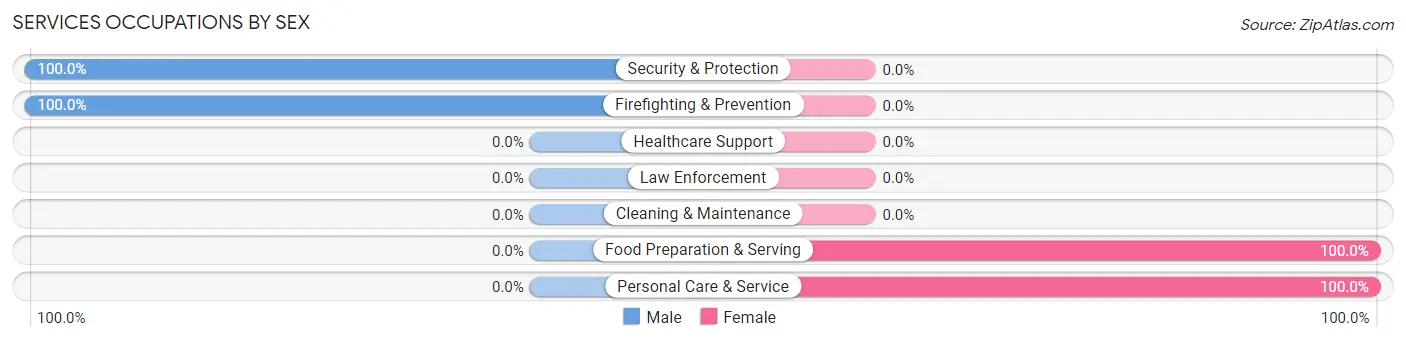
| Occupation | Male | Female |
| Healthcare Support | 0 (0.0%) | 0 (0.0%) |
| Security & Protection | 9 (100.0%) | 0 (0.0%) |
| Firefighting & Prevention | 9 (100.0%) | 0 (0.0%) |
| Law Enforcement | 0 (0.0%) | 0 (0.0%) |
| Food Preparation & Serving | 0 (0.0%) | 12 (100.0%) |
| Cleaning & Maintenance | 0 (0.0%) | 0 (0.0%) |
| Personal Care & Service | 0 (0.0%) | 1 (100.0%) |
| Total (Category) | 9 (40.9%) | 13 (59.1%) |
| Total (Overall) | 108 (54.0%) | 92 (46.0%) |
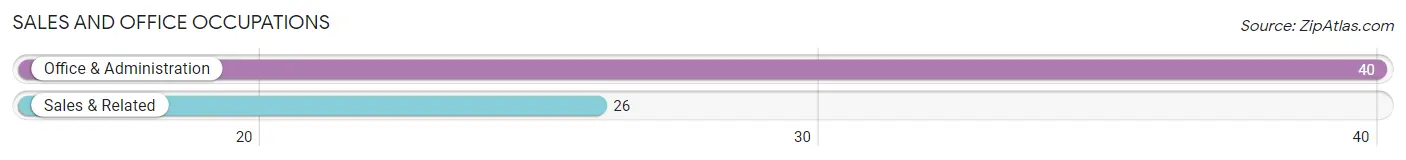
Sales and Office Occupations
The most common Sales and Office occupations in Towner are Office & Administration (40 | 20.0%), and Sales & Related (26 | 13.0%).
Sales and Office Occupations by Sex
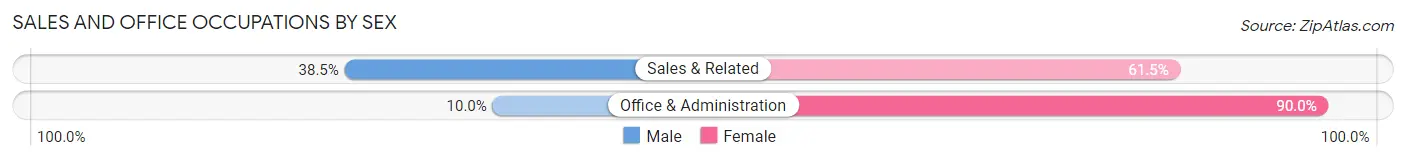
| Occupation | Male | Female |
| Sales & Related | 10 (38.5%) | 16 (61.5%) |
| Office & Administration | 4 (10.0%) | 36 (90.0%) |
| Total (Category) | 14 (21.2%) | 52 (78.8%) |
| Total (Overall) | 108 (54.0%) | 92 (46.0%) |
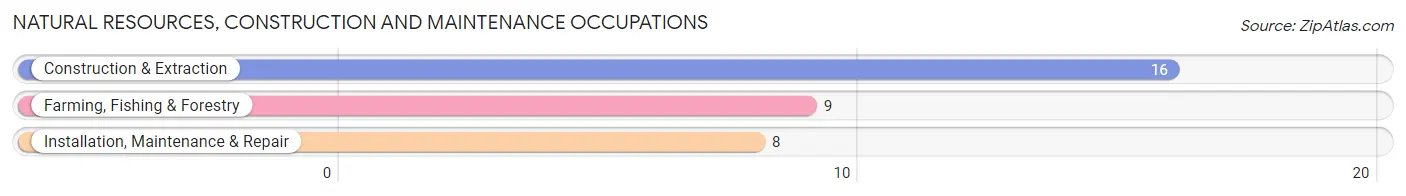
Natural Resources, Construction and Maintenance Occupations
The most common Natural Resources, Construction and Maintenance occupations in Towner are Construction & Extraction (16 | 8.0%), Farming, Fishing & Forestry (9 | 4.5%), and Installation, Maintenance & Repair (8 | 4.0%).
Natural Resources, Construction and Maintenance Occupations by Sex
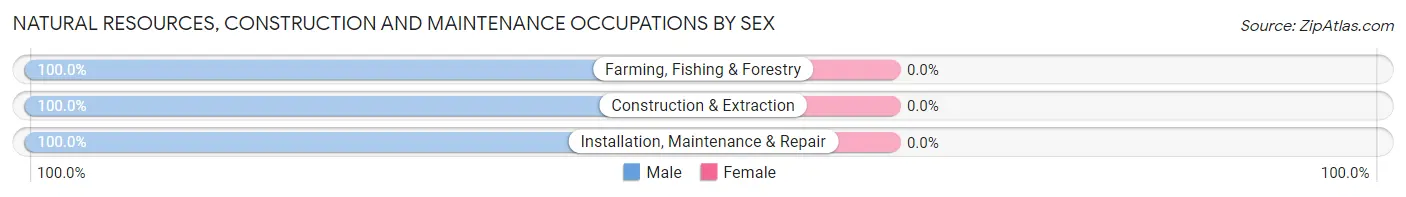
| Occupation | Male | Female |
| Farming, Fishing & Forestry | 9 (100.0%) | 0 (0.0%) |
| Construction & Extraction | 16 (100.0%) | 0 (0.0%) |
| Installation, Maintenance & Repair | 8 (100.0%) | 0 (0.0%) |
| Total (Category) | 33 (100.0%) | 0 (0.0%) |
| Total (Overall) | 108 (54.0%) | 92 (46.0%) |
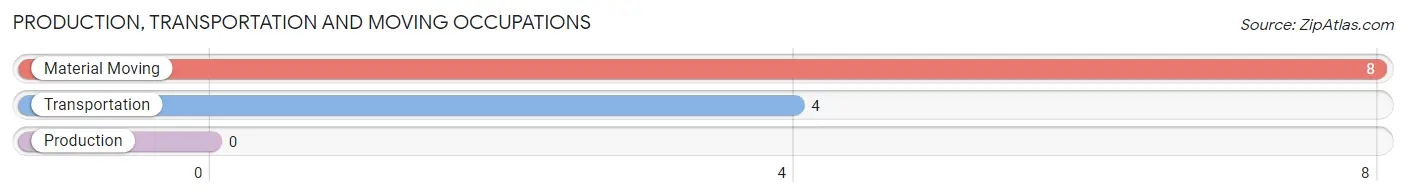
Production, Transportation and Moving Occupations
The most common Production, Transportation and Moving occupations in Towner are Material Moving (8 | 4.0%), and Transportation (4 | 2.0%).
Production, Transportation and Moving Occupations by Sex
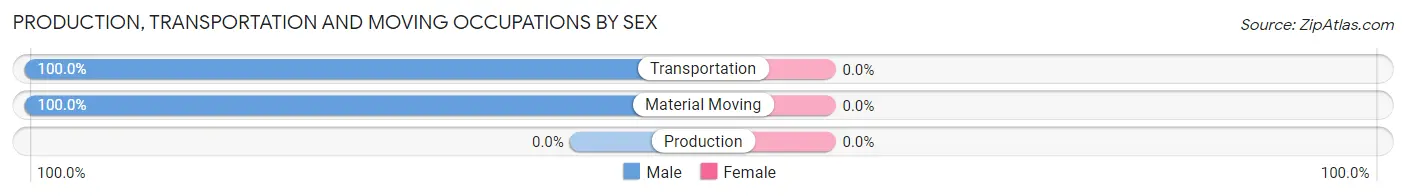
| Occupation | Male | Female |
| Production | 0 (0.0%) | 0 (0.0%) |
| Transportation | 4 (100.0%) | 0 (0.0%) |
| Material Moving | 8 (100.0%) | 0 (0.0%) |
| Total (Category) | 12 (100.0%) | 0 (0.0%) |
| Total (Overall) | 108 (54.0%) | 92 (46.0%) |
Employment Industries by Sex in Towner
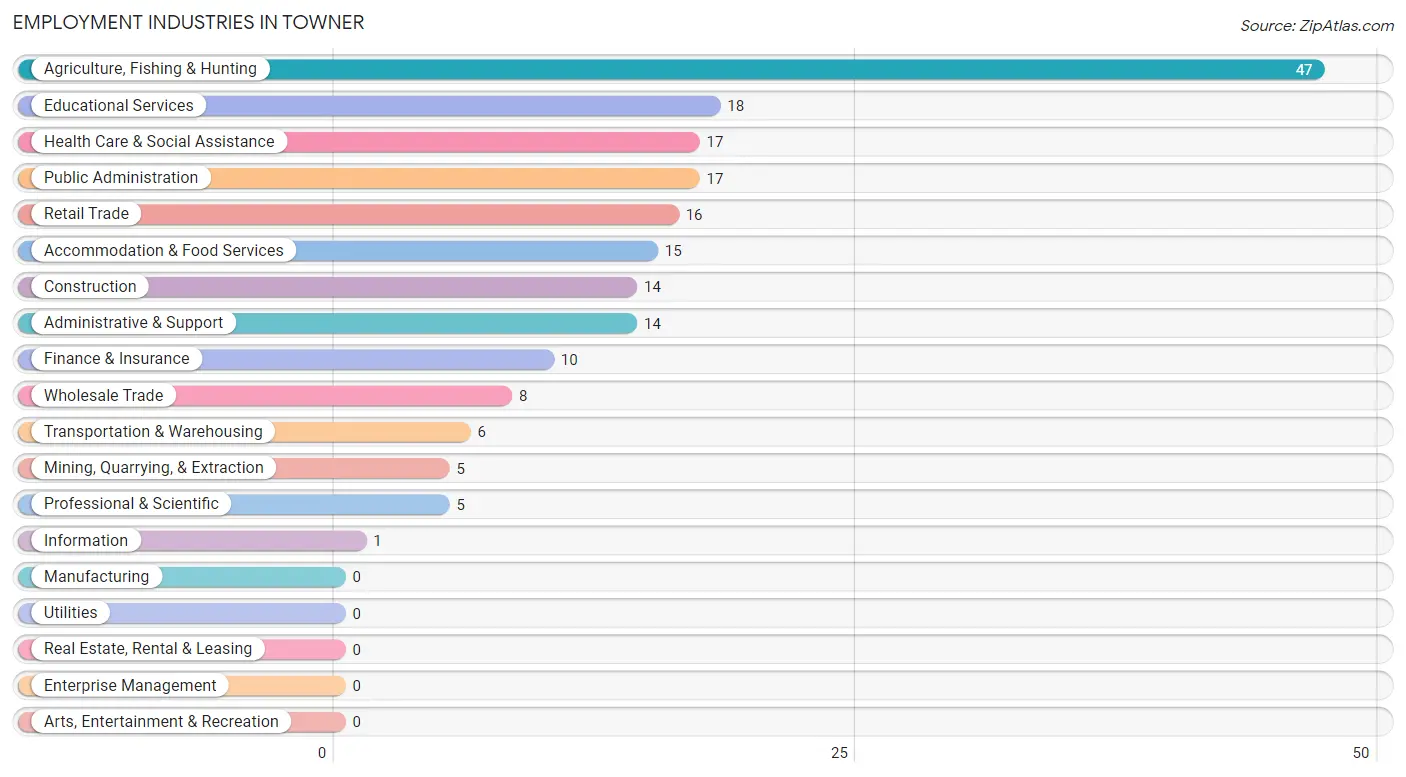
Employment Industries in Towner
The major employment industries in Towner include Agriculture, Fishing & Hunting (47 | 23.5%), Educational Services (18 | 9.0%), Health Care & Social Assistance (17 | 8.5%), Public Administration (17 | 8.5%), and Retail Trade (16 | 8.0%).
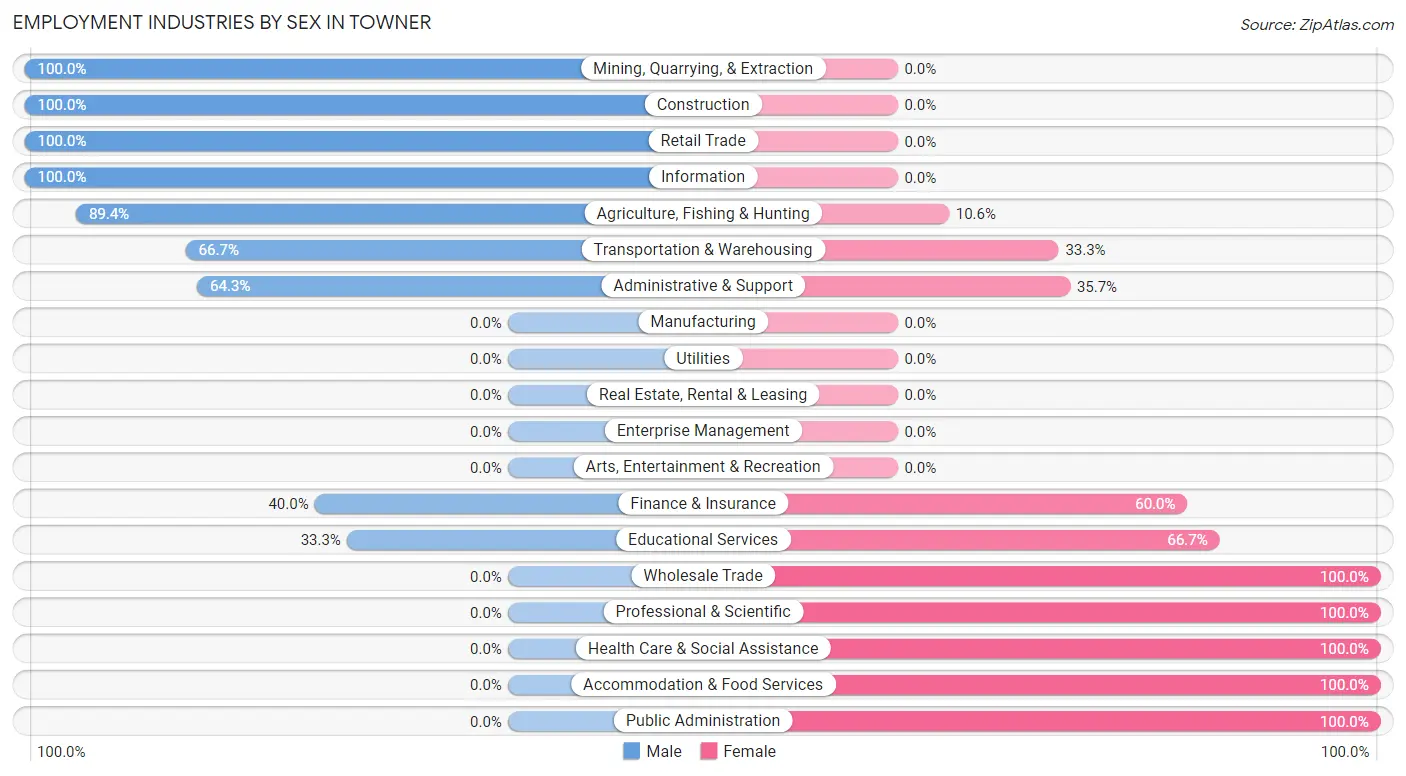
Employment Industries by Sex in Towner
The Towner industries that see more men than women are Mining, Quarrying, & Extraction (100.0%), Construction (100.0%), and Retail Trade (100.0%), whereas the industries that tend to have a higher number of women are Wholesale Trade (100.0%), Professional & Scientific (100.0%), and Health Care & Social Assistance (100.0%).
| Industry | Male | Female |
| Agriculture, Fishing & Hunting | 42 (89.4%) | 5 (10.6%) |
| Mining, Quarrying, & Extraction | 5 (100.0%) | 0 (0.0%) |
| Construction | 14 (100.0%) | 0 (0.0%) |
| Manufacturing | 0 (0.0%) | 0 (0.0%) |
| Wholesale Trade | 0 (0.0%) | 8 (100.0%) |
| Retail Trade | 16 (100.0%) | 0 (0.0%) |
| Transportation & Warehousing | 4 (66.7%) | 2 (33.3%) |
| Utilities | 0 (0.0%) | 0 (0.0%) |
| Information | 1 (100.0%) | 0 (0.0%) |
| Finance & Insurance | 4 (40.0%) | 6 (60.0%) |
| Real Estate, Rental & Leasing | 0 (0.0%) | 0 (0.0%) |
| Professional & Scientific | 0 (0.0%) | 5 (100.0%) |
| Enterprise Management | 0 (0.0%) | 0 (0.0%) |
| Administrative & Support | 9 (64.3%) | 5 (35.7%) |
| Educational Services | 6 (33.3%) | 12 (66.7%) |
| Health Care & Social Assistance | 0 (0.0%) | 17 (100.0%) |
| Arts, Entertainment & Recreation | 0 (0.0%) | 0 (0.0%) |
| Accommodation & Food Services | 0 (0.0%) | 15 (100.0%) |
| Public Administration | 0 (0.0%) | 17 (100.0%) |
| Total | 108 (54.0%) | 92 (46.0%) |
Education in Towner
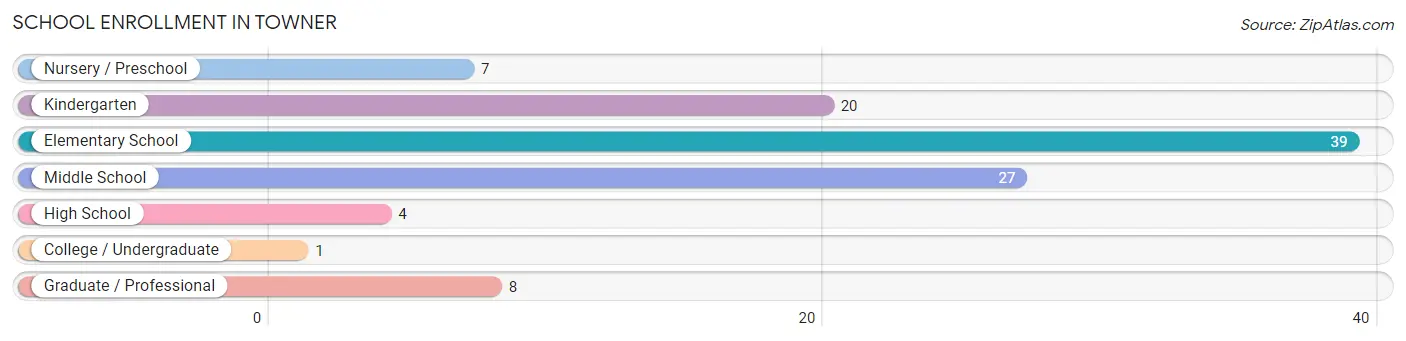
School Enrollment in Towner
The most common levels of schooling among the 106 students in Towner are elementary school (39 | 36.8%), middle school (27 | 25.5%), and kindergarten (20 | 18.9%).
| School Level | # Students | % Students |
| Nursery / Preschool | 7 | 6.6% |
| Kindergarten | 20 | 18.9% |
| Elementary School | 39 | 36.8% |
| Middle School | 27 | 25.5% |
| High School | 4 | 3.8% |
| College / Undergraduate | 1 | 0.9% |
| Graduate / Professional | 8 | 7.5% |
| Total | 106 | 100.0% |
School Enrollment by Age by Funding Source in Towner
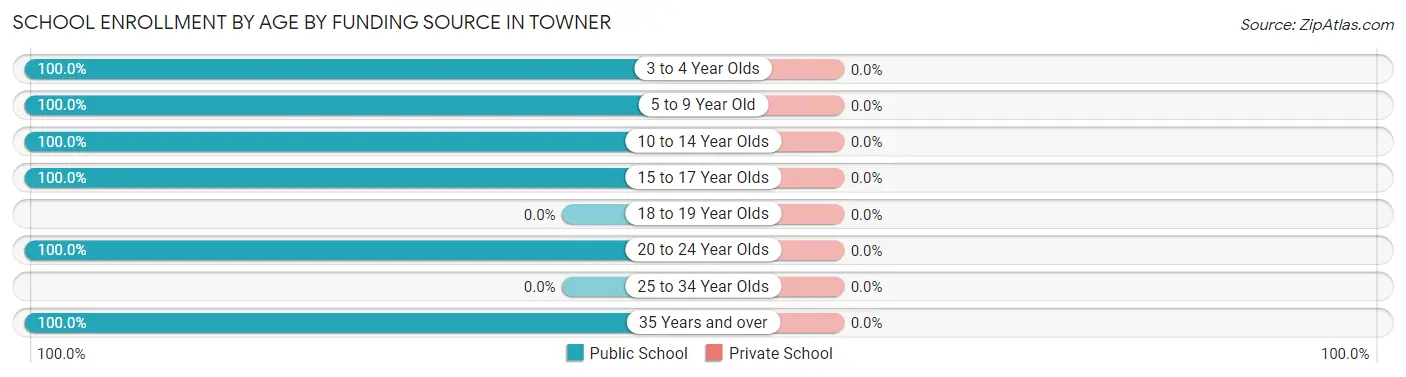
| Age Bracket | Public School | Private School |
| 3 to 4 Year Olds | 7 (100.0%) | 0 (0.0%) |
| 5 to 9 Year Old | 53 (100.0%) | 0 (0.0%) |
| 10 to 14 Year Olds | 33 (100.0%) | 0 (0.0%) |
| 15 to 17 Year Olds | 4 (100.0%) | 0 (0.0%) |
| 18 to 19 Year Olds | 0 (0.0%) | 0 (0.0%) |
| 20 to 24 Year Olds | 1 (100.0%) | 0 (0.0%) |
| 25 to 34 Year Olds | 0 (0.0%) | 0 (0.0%) |
| 35 Years and over | 8 (100.0%) | 0 (0.0%) |
| Total | 106 (100.0%) | 0 (0.0%) |
Educational Attainment by Field of Study in Towner
Education (16 | 30.2%), engineering (15 | 28.3%), physical & health sciences (8 | 15.1%), business (6 | 11.3%), and science & technology (5 | 9.4%) are the most common fields of study among 53 individuals in Towner who have obtained a bachelor's degree or higher.
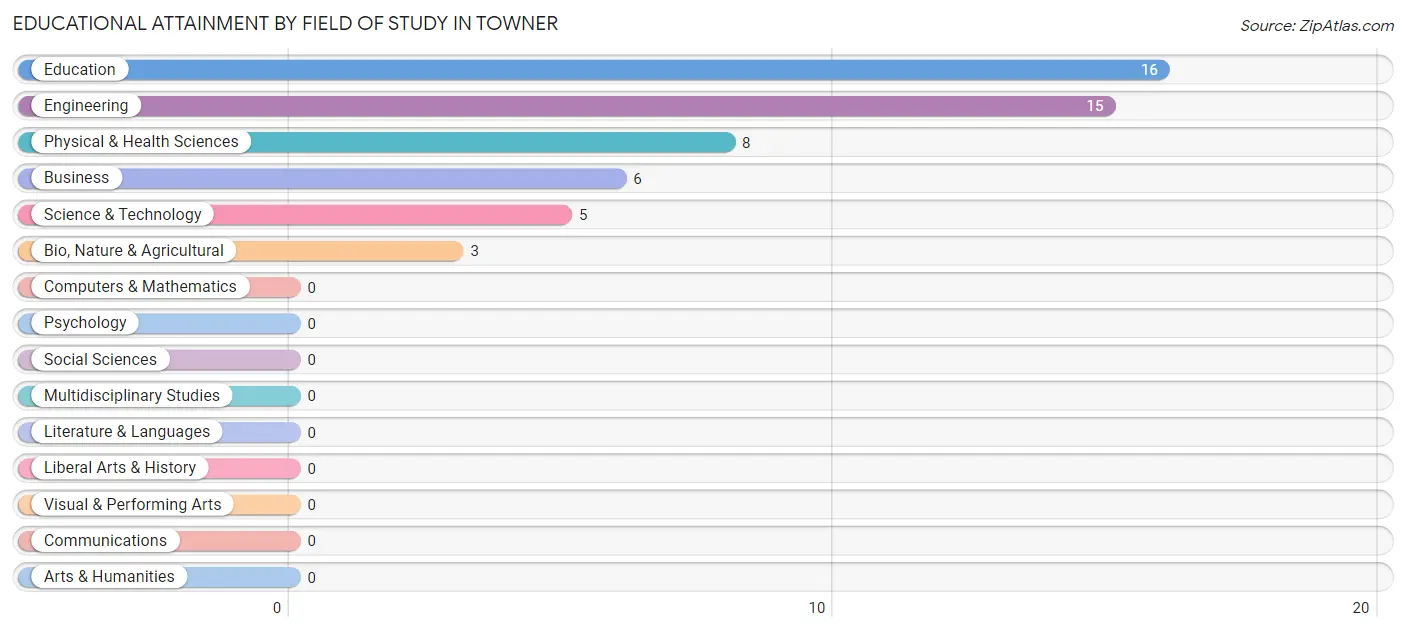
| Field of Study | # Graduates | % Graduates |
| Computers & Mathematics | 0 | 0.0% |
| Bio, Nature & Agricultural | 3 | 5.7% |
| Physical & Health Sciences | 8 | 15.1% |
| Psychology | 0 | 0.0% |
| Social Sciences | 0 | 0.0% |
| Engineering | 15 | 28.3% |
| Multidisciplinary Studies | 0 | 0.0% |
| Science & Technology | 5 | 9.4% |
| Business | 6 | 11.3% |
| Education | 16 | 30.2% |
| Literature & Languages | 0 | 0.0% |
| Liberal Arts & History | 0 | 0.0% |
| Visual & Performing Arts | 0 | 0.0% |
| Communications | 0 | 0.0% |
| Arts & Humanities | 0 | 0.0% |
| Total | 53 | 100.0% |
Transportation & Commute in Towner
Vehicle Availability by Sex in Towner
The most prevalent vehicle ownership categories in Towner are males with 3 vehicles (37, accounting for 34.9%) and females with 3 vehicles (21, making up 41.1%).
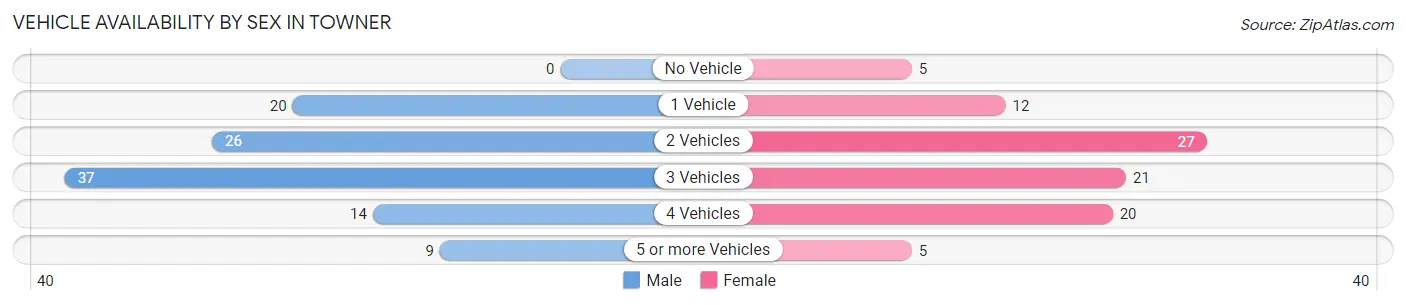
| Vehicles Available | Male | Female |
| No Vehicle | 0 (0.0%) | 5 (5.6%) |
| 1 Vehicle | 20 (18.9%) | 12 (13.3%) |
| 2 Vehicles | 26 (24.5%) | 27 (30.0%) |
| 3 Vehicles | 37 (34.9%) | 21 (23.3%) |
| 4 Vehicles | 14 (13.2%) | 20 (22.2%) |
| 5 or more Vehicles | 9 (8.5%) | 5 (5.6%) |
| Total | 106 (100.0%) | 90 (100.0%) |
Commute Time in Towner
The most frequently occuring commute durations in Towner are less than 5 minutes (62 commuters, 32.6%), 5 to 9 minutes (51 commuters, 26.8%), and 45 to 59 minutes (23 commuters, 12.1%).
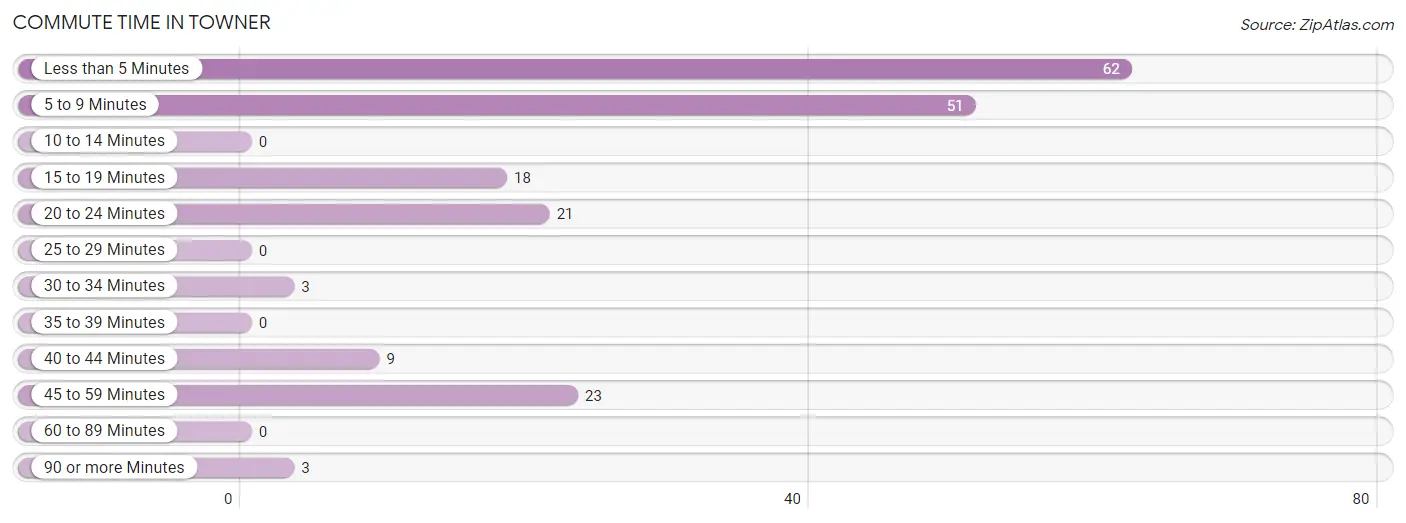
| Commute Time | # Commuters | % Commuters |
| Less than 5 Minutes | 62 | 32.6% |
| 5 to 9 Minutes | 51 | 26.8% |
| 10 to 14 Minutes | 0 | 0.0% |
| 15 to 19 Minutes | 18 | 9.5% |
| 20 to 24 Minutes | 21 | 11.1% |
| 25 to 29 Minutes | 0 | 0.0% |
| 30 to 34 Minutes | 3 | 1.6% |
| 35 to 39 Minutes | 0 | 0.0% |
| 40 to 44 Minutes | 9 | 4.7% |
| 45 to 59 Minutes | 23 | 12.1% |
| 60 to 89 Minutes | 0 | 0.0% |
| 90 or more Minutes | 3 | 1.6% |
Commute Time by Sex in Towner
The most common commute times in Towner are 5 to 9 minutes (35 commuters, 33.7%) for males and less than 5 minutes (51 commuters, 59.3%) for females.
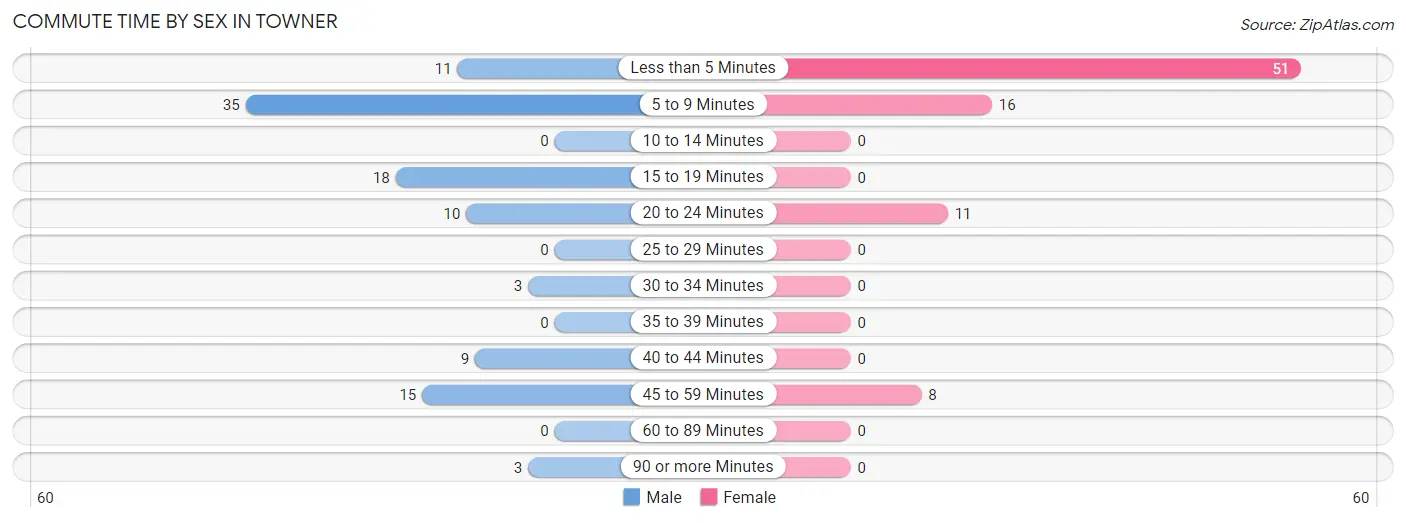
| Commute Time | Male | Female |
| Less than 5 Minutes | 11 (10.6%) | 51 (59.3%) |
| 5 to 9 Minutes | 35 (33.7%) | 16 (18.6%) |
| 10 to 14 Minutes | 0 (0.0%) | 0 (0.0%) |
| 15 to 19 Minutes | 18 (17.3%) | 0 (0.0%) |
| 20 to 24 Minutes | 10 (9.6%) | 11 (12.8%) |
| 25 to 29 Minutes | 0 (0.0%) | 0 (0.0%) |
| 30 to 34 Minutes | 3 (2.9%) | 0 (0.0%) |
| 35 to 39 Minutes | 0 (0.0%) | 0 (0.0%) |
| 40 to 44 Minutes | 9 (8.6%) | 0 (0.0%) |
| 45 to 59 Minutes | 15 (14.4%) | 8 (9.3%) |
| 60 to 89 Minutes | 0 (0.0%) | 0 (0.0%) |
| 90 or more Minutes | 3 (2.9%) | 0 (0.0%) |
Time of Departure to Work by Sex in Towner
The most frequent times of departure to work in Towner are 7:30 AM to 7:59 AM (32, 30.8%) for males and 7:30 AM to 7:59 AM (41, 47.7%) for females.
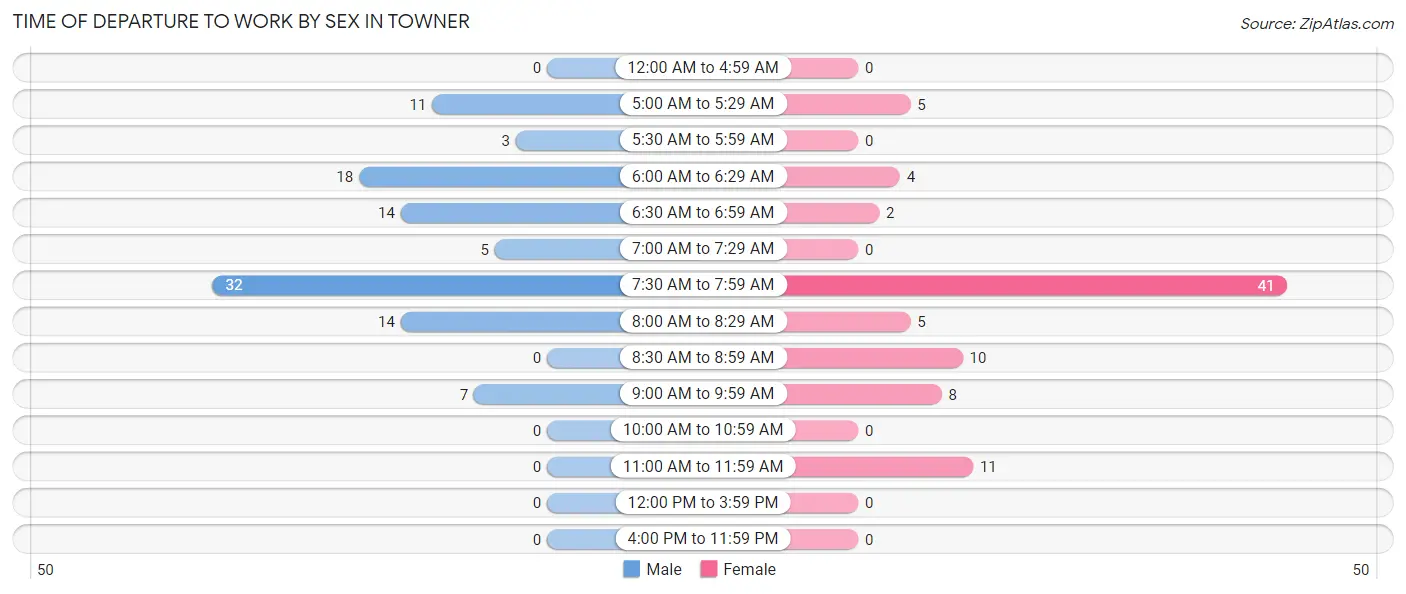
| Time of Departure | Male | Female |
| 12:00 AM to 4:59 AM | 0 (0.0%) | 0 (0.0%) |
| 5:00 AM to 5:29 AM | 11 (10.6%) | 5 (5.8%) |
| 5:30 AM to 5:59 AM | 3 (2.9%) | 0 (0.0%) |
| 6:00 AM to 6:29 AM | 18 (17.3%) | 4 (4.6%) |
| 6:30 AM to 6:59 AM | 14 (13.5%) | 2 (2.3%) |
| 7:00 AM to 7:29 AM | 5 (4.8%) | 0 (0.0%) |
| 7:30 AM to 7:59 AM | 32 (30.8%) | 41 (47.7%) |
| 8:00 AM to 8:29 AM | 14 (13.5%) | 5 (5.8%) |
| 8:30 AM to 8:59 AM | 0 (0.0%) | 10 (11.6%) |
| 9:00 AM to 9:59 AM | 7 (6.7%) | 8 (9.3%) |
| 10:00 AM to 10:59 AM | 0 (0.0%) | 0 (0.0%) |
| 11:00 AM to 11:59 AM | 0 (0.0%) | 11 (12.8%) |
| 12:00 PM to 3:59 PM | 0 (0.0%) | 0 (0.0%) |
| 4:00 PM to 11:59 PM | 0 (0.0%) | 0 (0.0%) |
| Total | 104 (100.0%) | 86 (100.0%) |
Housing Occupancy in Towner
Occupancy by Ownership in Towner
Of the total 216 dwellings in Towner, owner-occupied units account for 181 (83.8%), while renter-occupied units make up 35 (16.2%).
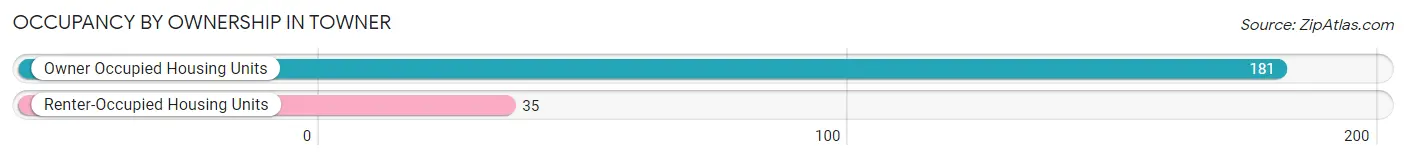
| Occupancy | # Housing Units | % Housing Units |
| Owner Occupied Housing Units | 181 | 83.8% |
| Renter-Occupied Housing Units | 35 | 16.2% |
| Total Occupied Housing Units | 216 | 100.0% |
Occupancy by Household Size in Towner
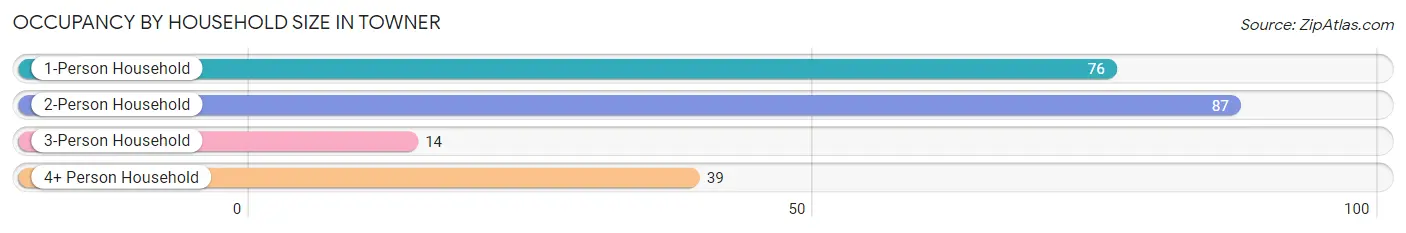
| Household Size | # Housing Units | % Housing Units |
| 1-Person Household | 76 | 35.2% |
| 2-Person Household | 87 | 40.3% |
| 3-Person Household | 14 | 6.5% |
| 4+ Person Household | 39 | 18.1% |
| Total Housing Units | 216 | 100.0% |
Occupancy by Ownership by Household Size in Towner
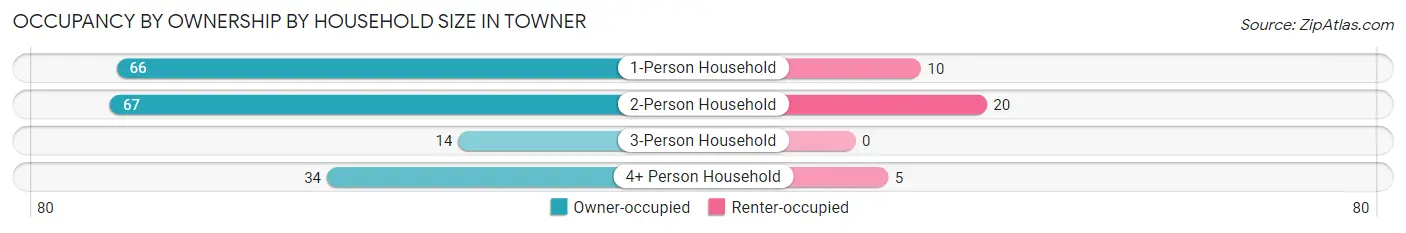
| Household Size | Owner-occupied | Renter-occupied |
| 1-Person Household | 66 (86.8%) | 10 (13.2%) |
| 2-Person Household | 67 (77.0%) | 20 (23.0%) |
| 3-Person Household | 14 (100.0%) | 0 (0.0%) |
| 4+ Person Household | 34 (87.2%) | 5 (12.8%) |
| Total Housing Units | 181 (83.8%) | 35 (16.2%) |
Occupancy by Educational Attainment in Towner
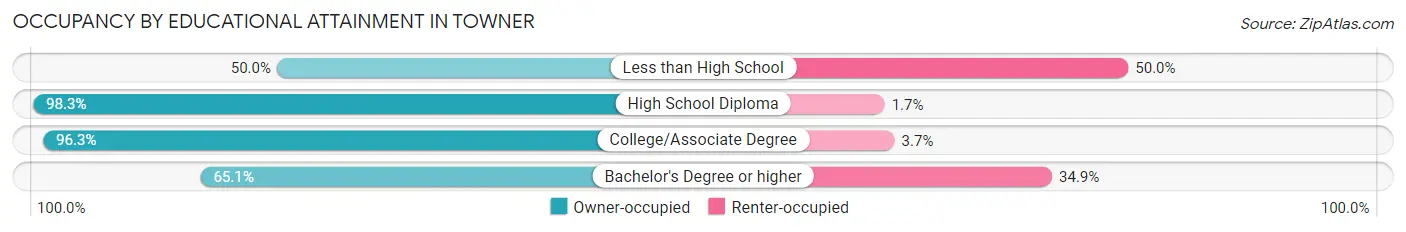
| Household Size | Owner-occupied | Renter-occupied |
| Less than High School | 16 (50.0%) | 16 (50.0%) |
| High School Diploma | 58 (98.3%) | 1 (1.7%) |
| College/Associate Degree | 79 (96.3%) | 3 (3.7%) |
| Bachelor's Degree or higher | 28 (65.1%) | 15 (34.9%) |
Occupancy by Age of Householder in Towner
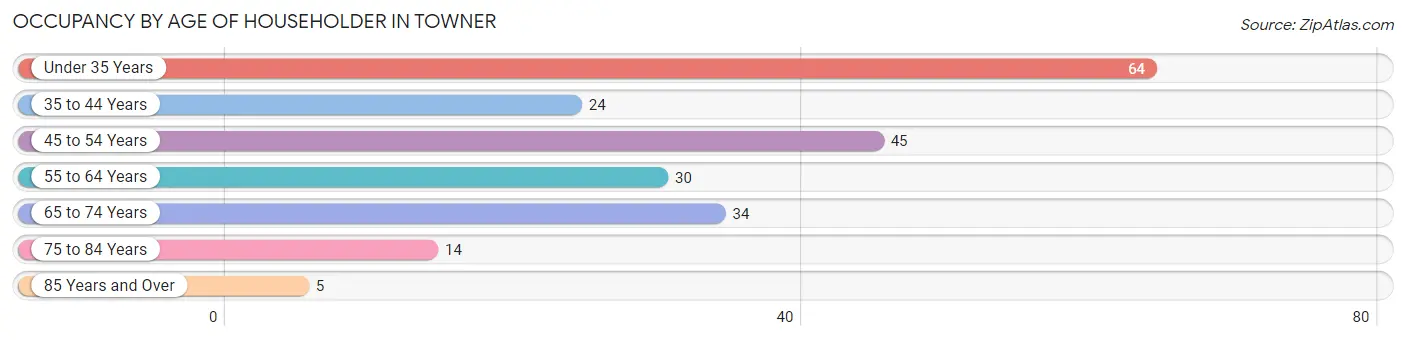
| Age Bracket | # Households | % Households |
| Under 35 Years | 64 | 29.6% |
| 35 to 44 Years | 24 | 11.1% |
| 45 to 54 Years | 45 | 20.8% |
| 55 to 64 Years | 30 | 13.9% |
| 65 to 74 Years | 34 | 15.7% |
| 75 to 84 Years | 14 | 6.5% |
| 85 Years and Over | 5 | 2.3% |
| Total | 216 | 100.0% |
Housing Finances in Towner
Median Income by Occupancy in Towner
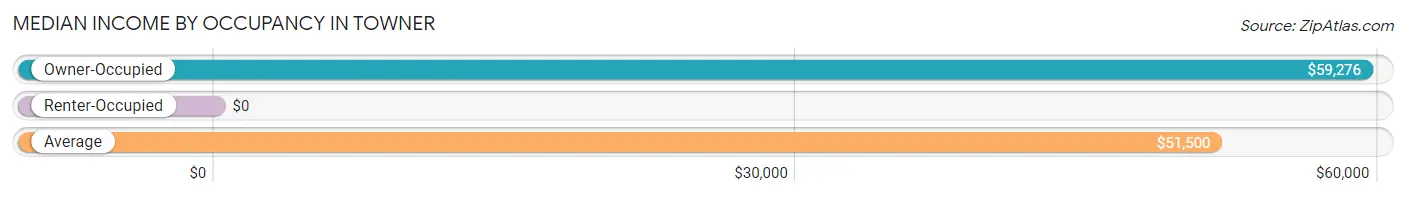
| Occupancy Type | # Households | Median Income |
| Owner-Occupied | 181 (83.8%) | $59,276 |
| Renter-Occupied | 35 (16.2%) | $0 |
| Average | 216 (100.0%) | $51,500 |
Occupancy by Householder Income Bracket in Towner
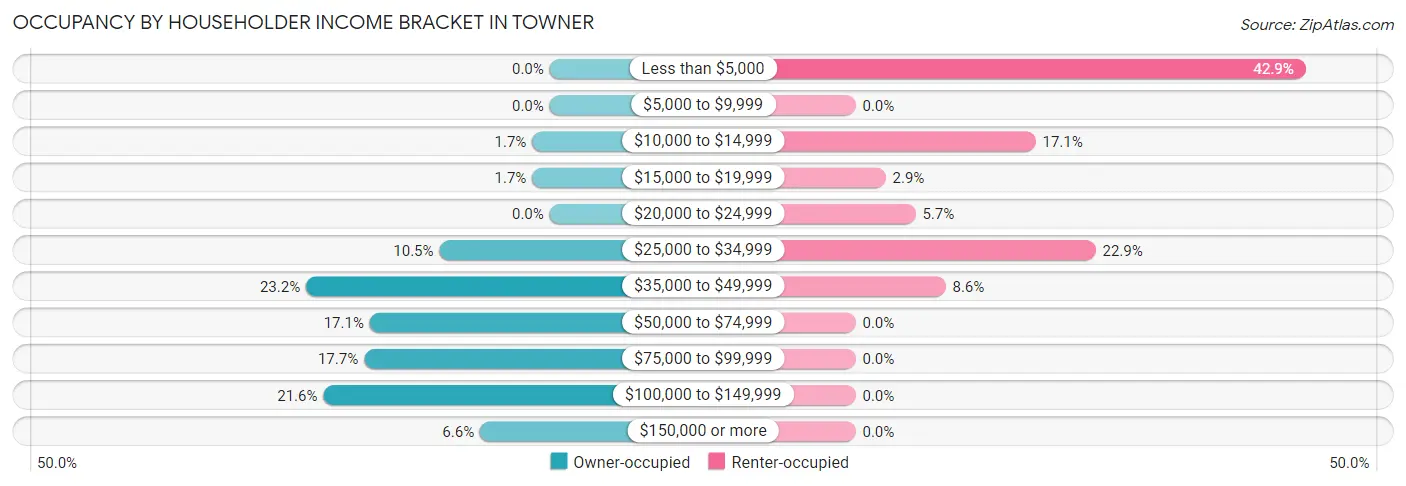
| Income Bracket | Owner-occupied | Renter-occupied |
| Less than $5,000 | 0 (0.0%) | 15 (42.9%) |
| $5,000 to $9,999 | 0 (0.0%) | 0 (0.0%) |
| $10,000 to $14,999 | 3 (1.7%) | 6 (17.1%) |
| $15,000 to $19,999 | 3 (1.7%) | 1 (2.9%) |
| $20,000 to $24,999 | 0 (0.0%) | 2 (5.7%) |
| $25,000 to $34,999 | 19 (10.5%) | 8 (22.9%) |
| $35,000 to $49,999 | 42 (23.2%) | 3 (8.6%) |
| $50,000 to $74,999 | 31 (17.1%) | 0 (0.0%) |
| $75,000 to $99,999 | 32 (17.7%) | 0 (0.0%) |
| $100,000 to $149,999 | 39 (21.5%) | 0 (0.0%) |
| $150,000 or more | 12 (6.6%) | 0 (0.0%) |
| Total | 181 (100.0%) | 35 (100.0%) |
Monthly Housing Cost Tiers in Towner
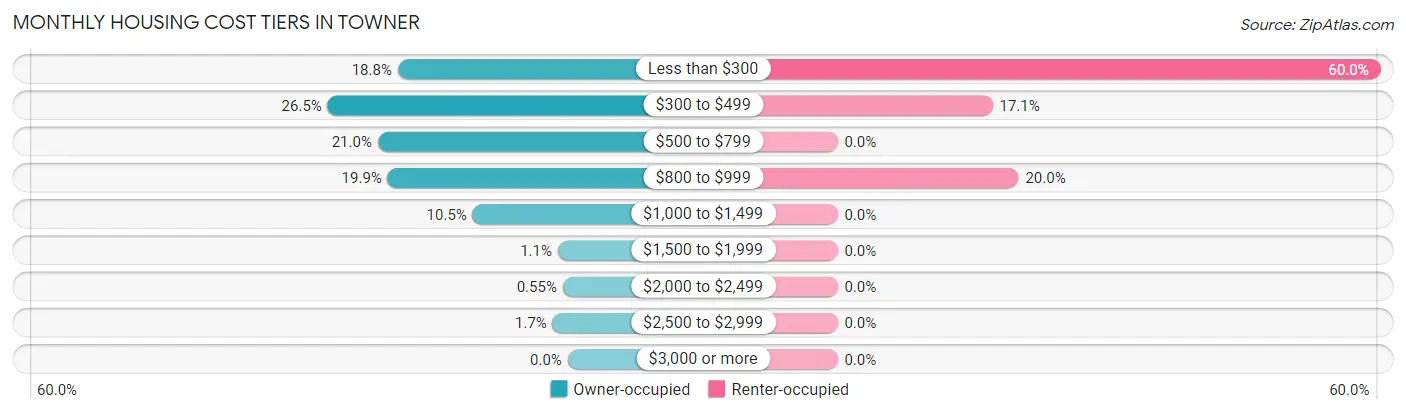
| Monthly Cost | Owner-occupied | Renter-occupied |
| Less than $300 | 34 (18.8%) | 21 (60.0%) |
| $300 to $499 | 48 (26.5%) | 6 (17.1%) |
| $500 to $799 | 38 (21.0%) | 0 (0.0%) |
| $800 to $999 | 36 (19.9%) | 7 (20.0%) |
| $1,000 to $1,499 | 19 (10.5%) | 0 (0.0%) |
| $1,500 to $1,999 | 2 (1.1%) | 0 (0.0%) |
| $2,000 to $2,499 | 1 (0.5%) | 0 (0.0%) |
| $2,500 to $2,999 | 3 (1.7%) | 0 (0.0%) |
| $3,000 or more | 0 (0.0%) | 0 (0.0%) |
| Total | 181 (100.0%) | 35 (100.0%) |
Physical Housing Characteristics in Towner
Housing Structures in Towner
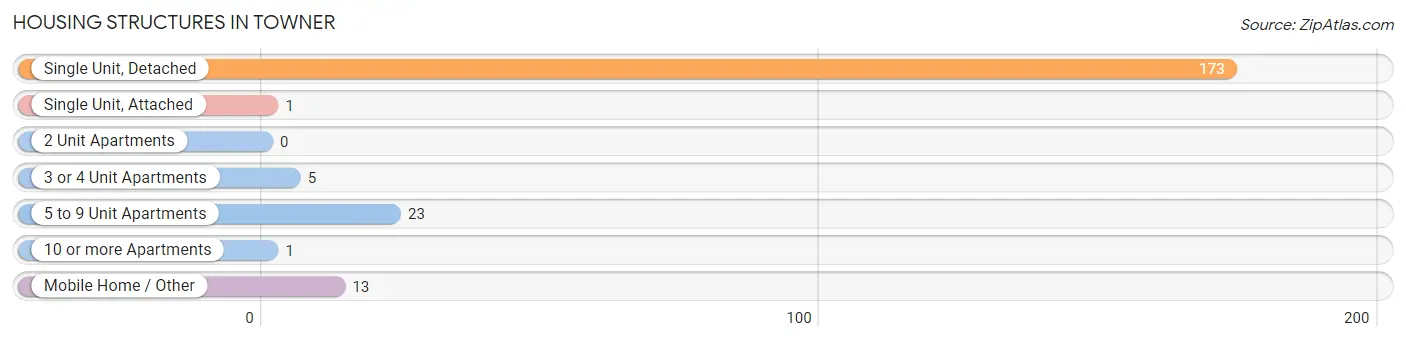
| Structure Type | # Housing Units | % Housing Units |
| Single Unit, Detached | 173 | 80.1% |
| Single Unit, Attached | 1 | 0.5% |
| 2 Unit Apartments | 0 | 0.0% |
| 3 or 4 Unit Apartments | 5 | 2.3% |
| 5 to 9 Unit Apartments | 23 | 10.6% |
| 10 or more Apartments | 1 | 0.5% |
| Mobile Home / Other | 13 | 6.0% |
| Total | 216 | 100.0% |
Housing Structures by Occupancy in Towner
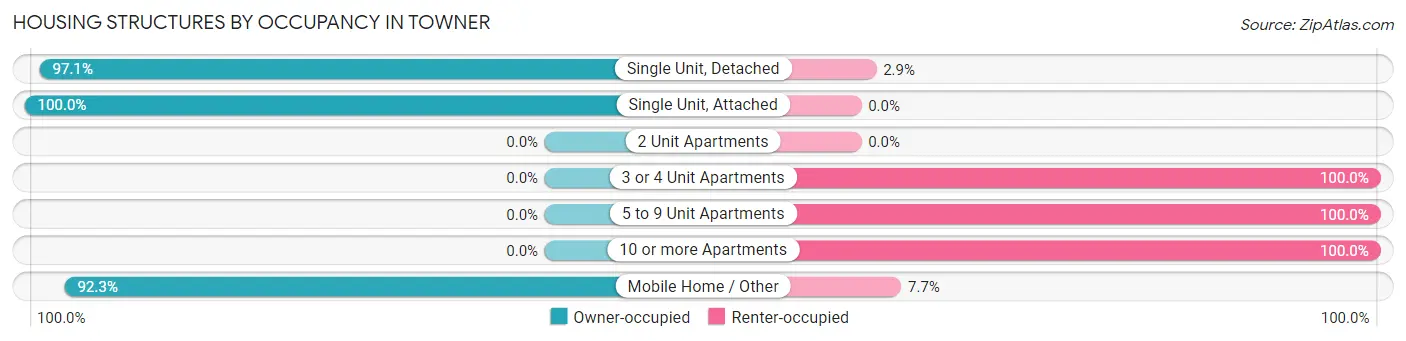
| Structure Type | Owner-occupied | Renter-occupied |
| Single Unit, Detached | 168 (97.1%) | 5 (2.9%) |
| Single Unit, Attached | 1 (100.0%) | 0 (0.0%) |
| 2 Unit Apartments | 0 (0.0%) | 0 (0.0%) |
| 3 or 4 Unit Apartments | 0 (0.0%) | 5 (100.0%) |
| 5 to 9 Unit Apartments | 0 (0.0%) | 23 (100.0%) |
| 10 or more Apartments | 0 (0.0%) | 1 (100.0%) |
| Mobile Home / Other | 12 (92.3%) | 1 (7.7%) |
| Total | 181 (83.8%) | 35 (16.2%) |
Housing Structures by Number of Rooms in Towner
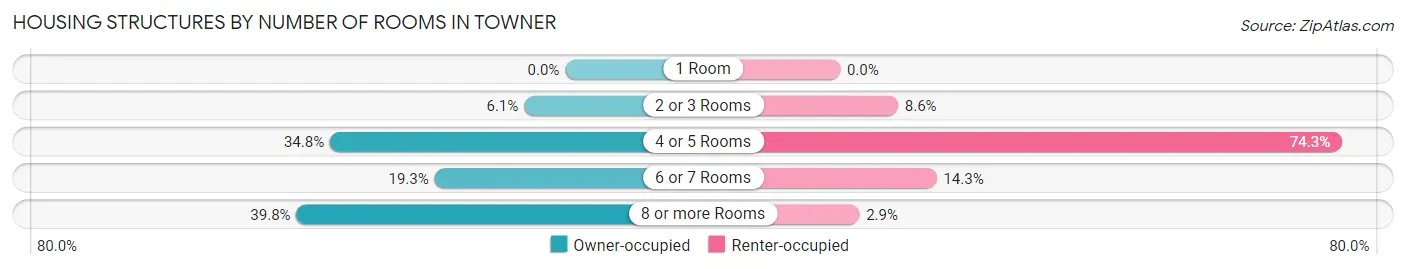
| Number of Rooms | Owner-occupied | Renter-occupied |
| 1 Room | 0 (0.0%) | 0 (0.0%) |
| 2 or 3 Rooms | 11 (6.1%) | 3 (8.6%) |
| 4 or 5 Rooms | 63 (34.8%) | 26 (74.3%) |
| 6 or 7 Rooms | 35 (19.3%) | 5 (14.3%) |
| 8 or more Rooms | 72 (39.8%) | 1 (2.9%) |
| Total | 181 (100.0%) | 35 (100.0%) |
Housing Structure by Heating Type in Towner
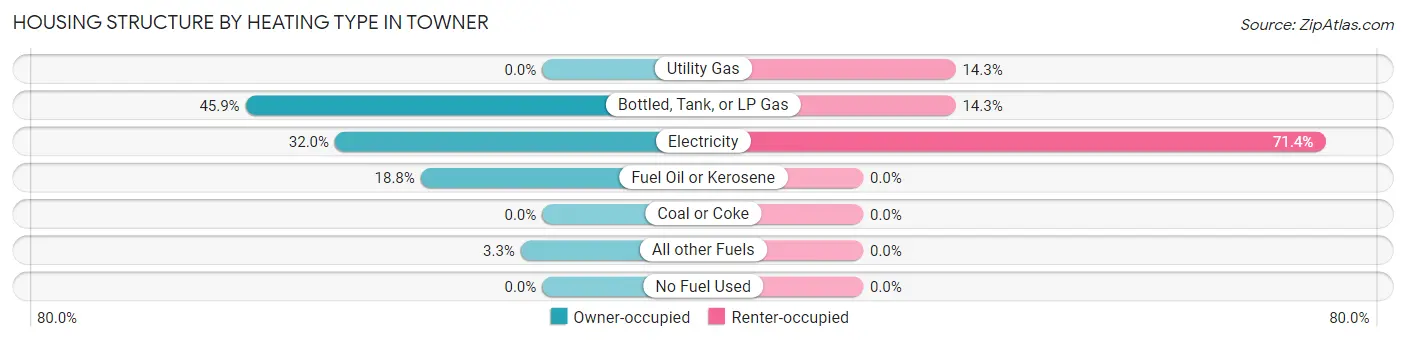
| Heating Type | Owner-occupied | Renter-occupied |
| Utility Gas | 0 (0.0%) | 5 (14.3%) |
| Bottled, Tank, or LP Gas | 83 (45.9%) | 5 (14.3%) |
| Electricity | 58 (32.0%) | 25 (71.4%) |
| Fuel Oil or Kerosene | 34 (18.8%) | 0 (0.0%) |
| Coal or Coke | 0 (0.0%) | 0 (0.0%) |
| All other Fuels | 6 (3.3%) | 0 (0.0%) |
| No Fuel Used | 0 (0.0%) | 0 (0.0%) |
| Total | 181 (100.0%) | 35 (100.0%) |
Household Vehicle Usage in Towner
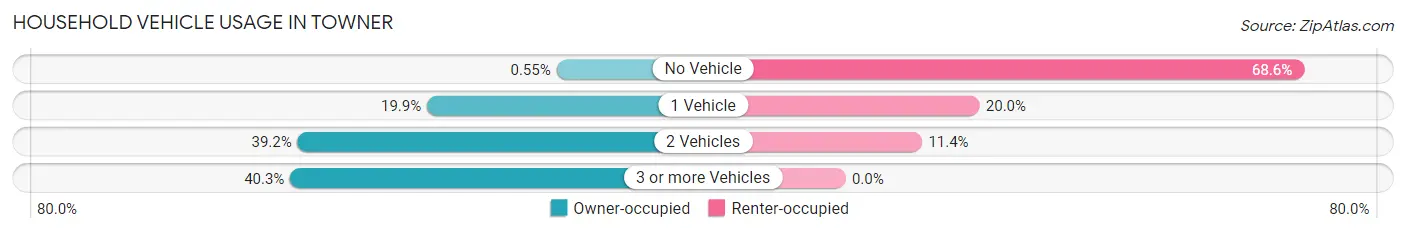
| Vehicles per Household | Owner-occupied | Renter-occupied |
| No Vehicle | 1 (0.5%) | 24 (68.6%) |
| 1 Vehicle | 36 (19.9%) | 7 (20.0%) |
| 2 Vehicles | 71 (39.2%) | 4 (11.4%) |
| 3 or more Vehicles | 73 (40.3%) | 0 (0.0%) |
| Total | 181 (100.0%) | 35 (100.0%) |
Real Estate & Mortgages in Towner
Real Estate and Mortgage Overview in Towner
| Characteristic | Without Mortgage | With Mortgage |
| Housing Units | 104 | 77 |
| Median Property Value | $84,700 | $96,300 |
| Median Household Income | $59,750 | $5 |
| Monthly Housing Costs | $359 | $0 |
| Real Estate Taxes | $719 | $0 |
Property Value by Mortgage Status in Towner
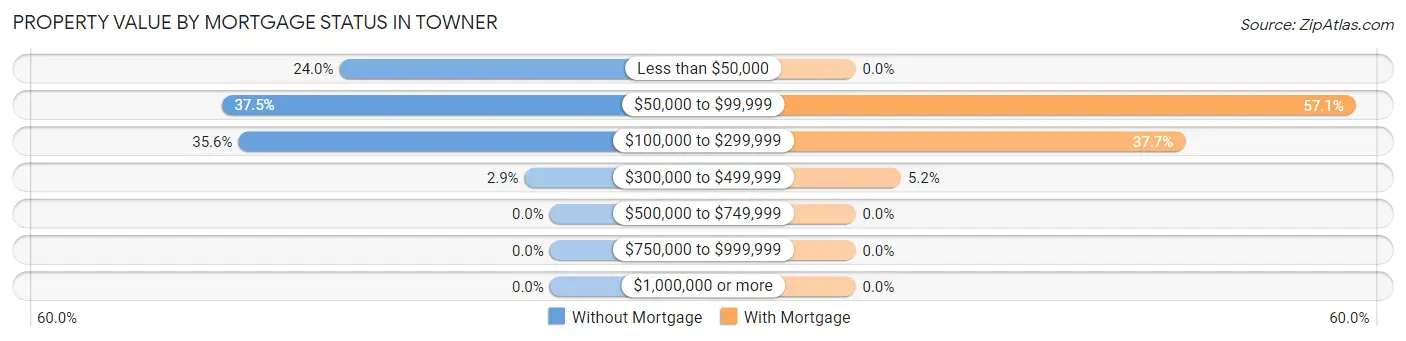
| Property Value | Without Mortgage | With Mortgage |
| Less than $50,000 | 25 (24.0%) | 0 (0.0%) |
| $50,000 to $99,999 | 39 (37.5%) | 44 (57.1%) |
| $100,000 to $299,999 | 37 (35.6%) | 29 (37.7%) |
| $300,000 to $499,999 | 3 (2.9%) | 4 (5.2%) |
| $500,000 to $749,999 | 0 (0.0%) | 0 (0.0%) |
| $750,000 to $999,999 | 0 (0.0%) | 0 (0.0%) |
| $1,000,000 or more | 0 (0.0%) | 0 (0.0%) |
| Total | 104 (100.0%) | 77 (100.0%) |
Household Income by Mortgage Status in Towner
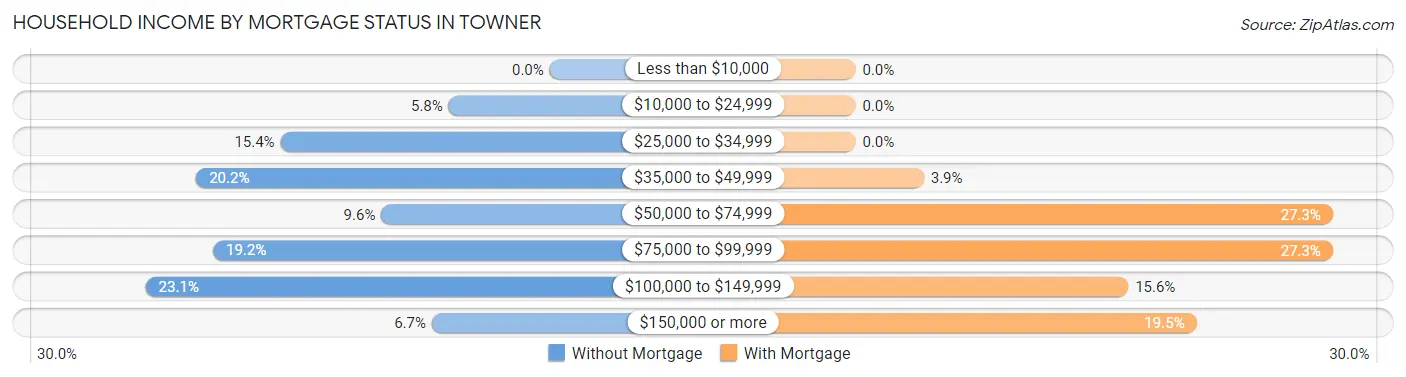
| Household Income | Without Mortgage | With Mortgage |
| Less than $10,000 | 0 (0.0%) | 0 (0.0%) |
| $10,000 to $24,999 | 6 (5.8%) | 0 (0.0%) |
| $25,000 to $34,999 | 16 (15.4%) | 0 (0.0%) |
| $35,000 to $49,999 | 21 (20.2%) | 3 (3.9%) |
| $50,000 to $74,999 | 10 (9.6%) | 21 (27.3%) |
| $75,000 to $99,999 | 20 (19.2%) | 21 (27.3%) |
| $100,000 to $149,999 | 24 (23.1%) | 12 (15.6%) |
| $150,000 or more | 7 (6.7%) | 15 (19.5%) |
| Total | 104 (100.0%) | 77 (100.0%) |
Property Value to Household Income Ratio in Towner
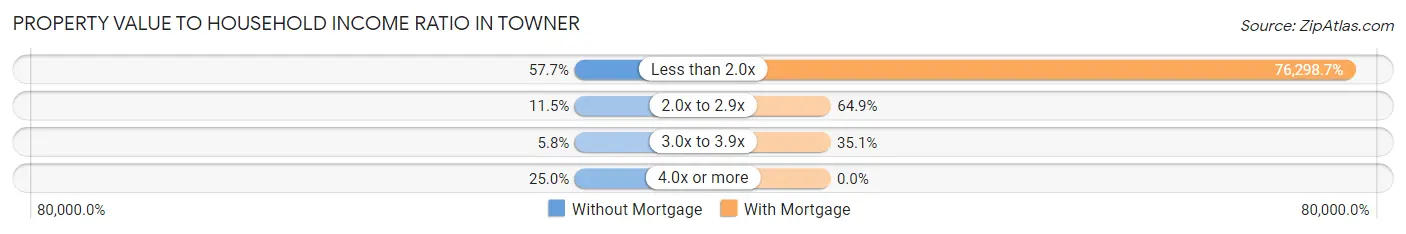
| Value-to-Income Ratio | Without Mortgage | With Mortgage |
| Less than 2.0x | 60 (57.7%) | 58,750 (76,298.7%) |
| 2.0x to 2.9x | 12 (11.5%) | 50 (64.9%) |
| 3.0x to 3.9x | 6 (5.8%) | 27 (35.1%) |
| 4.0x or more | 26 (25.0%) | 0 (0.0%) |
| Total | 104 (100.0%) | 77 (100.0%) |
Real Estate Taxes by Mortgage Status in Towner
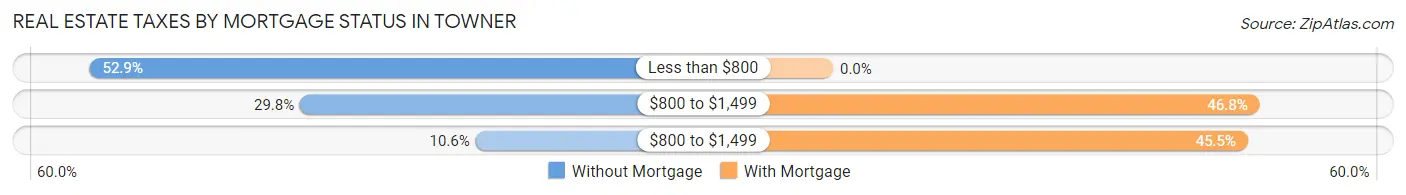
| Property Taxes | Without Mortgage | With Mortgage |
| Less than $800 | 55 (52.9%) | 0 (0.0%) |
| $800 to $1,499 | 31 (29.8%) | 36 (46.8%) |
| $800 to $1,499 | 11 (10.6%) | 35 (45.5%) |
| Total | 104 (100.0%) | 77 (100.0%) |
Health & Disability in Towner
Health Insurance Coverage by Age in Towner
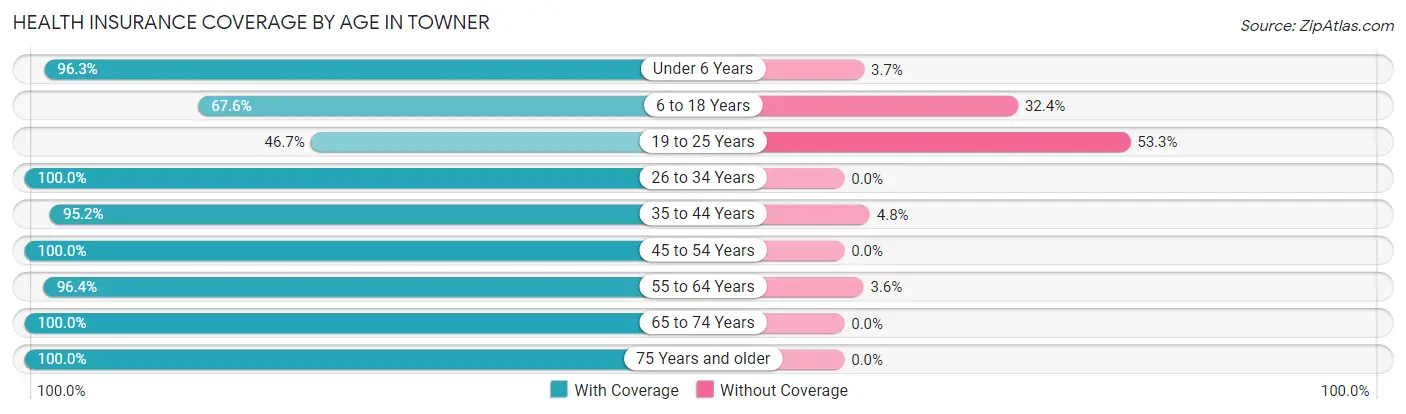
| Age Bracket | With Coverage | Without Coverage |
| Under 6 Years | 52 (96.3%) | 2 (3.7%) |
| 6 to 18 Years | 48 (67.6%) | 23 (32.4%) |
| 19 to 25 Years | 7 (46.7%) | 8 (53.3%) |
| 26 to 34 Years | 80 (100.0%) | 0 (0.0%) |
| 35 to 44 Years | 40 (95.2%) | 2 (4.8%) |
| 45 to 54 Years | 49 (100.0%) | 0 (0.0%) |
| 55 to 64 Years | 54 (96.4%) | 2 (3.6%) |
| 65 to 74 Years | 55 (100.0%) | 0 (0.0%) |
| 75 Years and older | 34 (100.0%) | 0 (0.0%) |
| Total | 419 (91.9%) | 37 (8.1%) |
Health Insurance Coverage by Citizenship Status in Towner
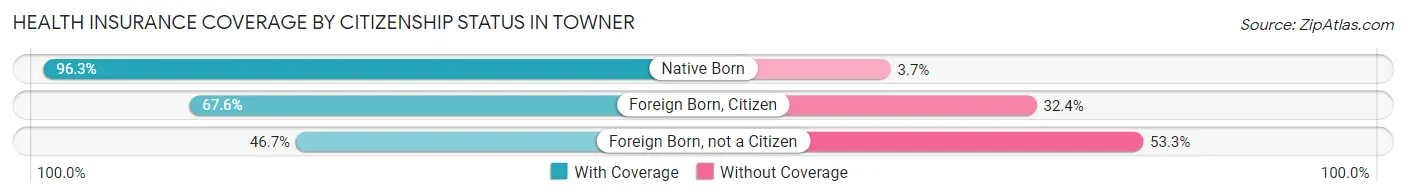
| Citizenship Status | With Coverage | Without Coverage |
| Native Born | 52 (96.3%) | 2 (3.7%) |
| Foreign Born, Citizen | 48 (67.6%) | 23 (32.4%) |
| Foreign Born, not a Citizen | 7 (46.7%) | 8 (53.3%) |
Health Insurance Coverage by Household Income in Towner
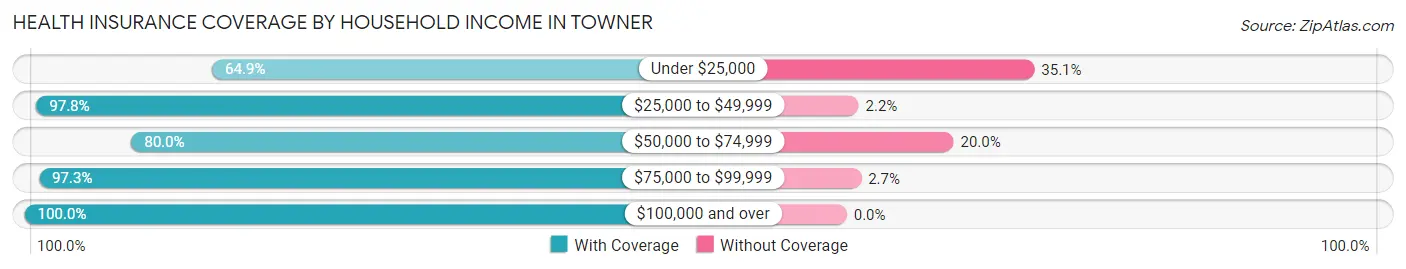
| Household Income | With Coverage | Without Coverage |
| Under $25,000 | 24 (64.9%) | 13 (35.1%) |
| $25,000 to $49,999 | 133 (97.8%) | 3 (2.2%) |
| $50,000 to $74,999 | 76 (80.0%) | 19 (20.0%) |
| $75,000 to $99,999 | 72 (97.3%) | 2 (2.7%) |
| $100,000 and over | 114 (100.0%) | 0 (0.0%) |
Public vs Private Health Insurance Coverage by Age in Towner
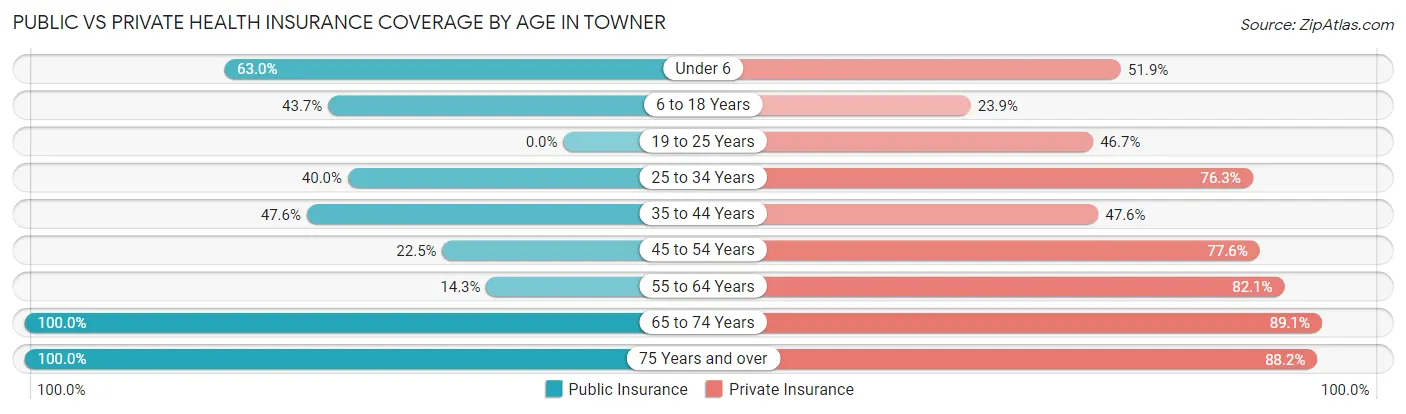
| Age Bracket | Public Insurance | Private Insurance |
| Under 6 | 34 (63.0%) | 28 (51.8%) |
| 6 to 18 Years | 31 (43.7%) | 17 (23.9%) |
| 19 to 25 Years | 0 (0.0%) | 7 (46.7%) |
| 25 to 34 Years | 32 (40.0%) | 61 (76.2%) |
| 35 to 44 Years | 20 (47.6%) | 20 (47.6%) |
| 45 to 54 Years | 11 (22.5%) | 38 (77.5%) |
| 55 to 64 Years | 8 (14.3%) | 46 (82.1%) |
| 65 to 74 Years | 55 (100.0%) | 49 (89.1%) |
| 75 Years and over | 34 (100.0%) | 30 (88.2%) |
| Total | 225 (49.3%) | 296 (64.9%) |
Disability Status by Sex by Age in Towner
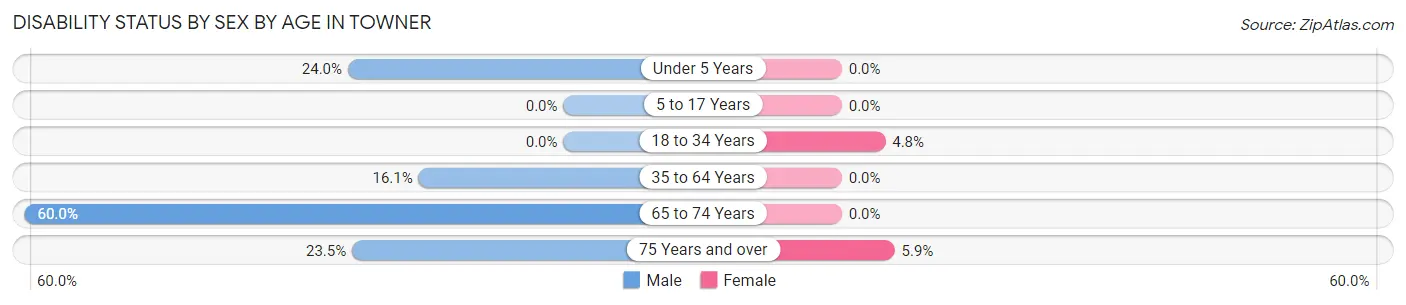
| Age Bracket | Male | Female |
| Under 5 Years | 6 (24.0%) | 0 (0.0%) |
| 5 to 17 Years | 0 (0.0%) | 0 (0.0%) |
| 18 to 34 Years | 0 (0.0%) | 3 (4.8%) |
| 35 to 64 Years | 15 (16.1%) | 0 (0.0%) |
| 65 to 74 Years | 15 (60.0%) | 0 (0.0%) |
| 75 Years and over | 4 (23.5%) | 1 (5.9%) |
Disability Class by Sex by Age in Towner
Disability Class: Hearing Difficulty
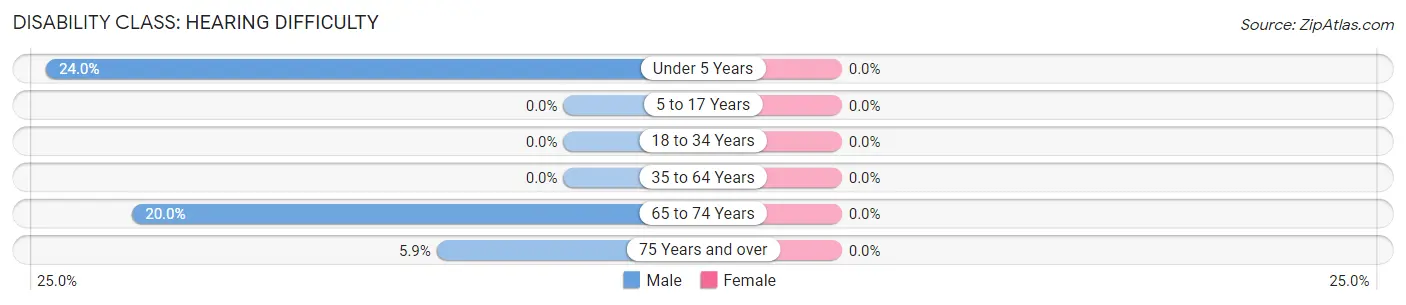
| Age Bracket | Male | Female |
| Under 5 Years | 6 (24.0%) | 0 (0.0%) |
| 5 to 17 Years | 0 (0.0%) | 0 (0.0%) |
| 18 to 34 Years | 0 (0.0%) | 0 (0.0%) |
| 35 to 64 Years | 0 (0.0%) | 0 (0.0%) |
| 65 to 74 Years | 5 (20.0%) | 0 (0.0%) |
| 75 Years and over | 1 (5.9%) | 0 (0.0%) |
Disability Class: Vision Difficulty
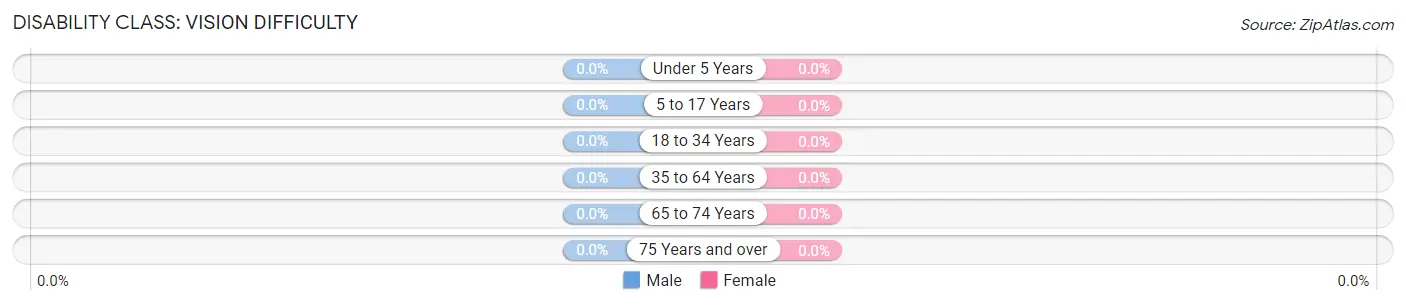
| Age Bracket | Male | Female |
| Under 5 Years | 0 (0.0%) | 0 (0.0%) |
| 5 to 17 Years | 0 (0.0%) | 0 (0.0%) |
| 18 to 34 Years | 0 (0.0%) | 0 (0.0%) |
| 35 to 64 Years | 0 (0.0%) | 0 (0.0%) |
| 65 to 74 Years | 0 (0.0%) | 0 (0.0%) |
| 75 Years and over | 0 (0.0%) | 0 (0.0%) |
Disability Class: Cognitive Difficulty
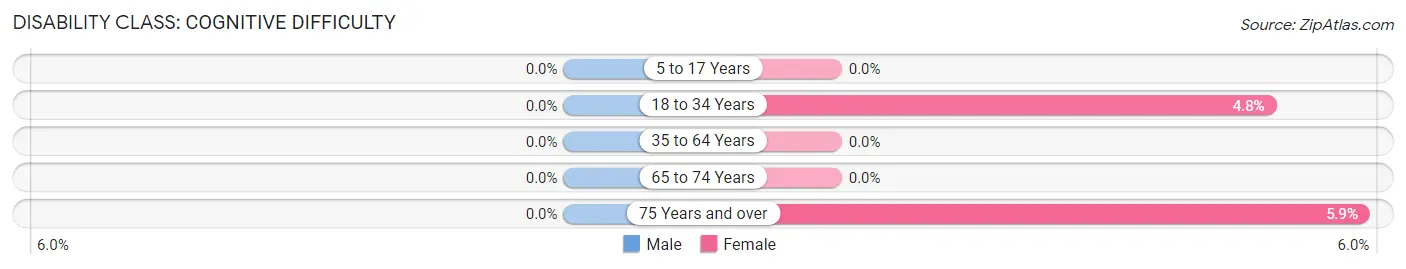
| Age Bracket | Male | Female |
| 5 to 17 Years | 0 (0.0%) | 0 (0.0%) |
| 18 to 34 Years | 0 (0.0%) | 3 (4.8%) |
| 35 to 64 Years | 0 (0.0%) | 0 (0.0%) |
| 65 to 74 Years | 0 (0.0%) | 0 (0.0%) |
| 75 Years and over | 0 (0.0%) | 1 (5.9%) |
Disability Class: Ambulatory Difficulty
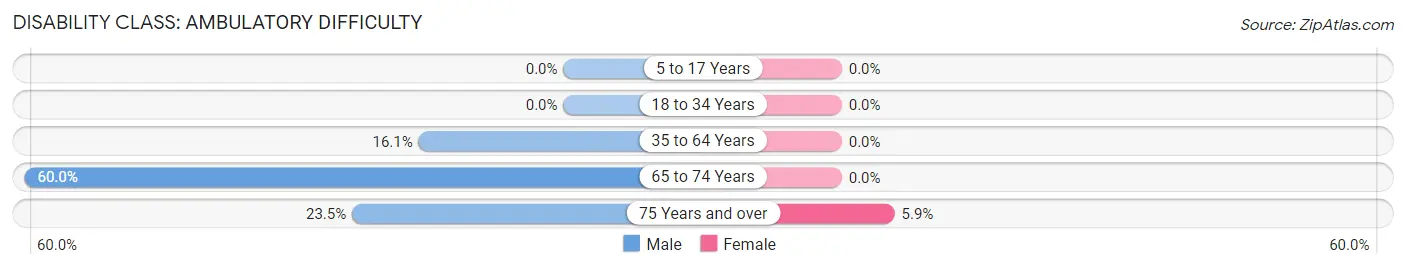
| Age Bracket | Male | Female |
| 5 to 17 Years | 0 (0.0%) | 0 (0.0%) |
| 18 to 34 Years | 0 (0.0%) | 0 (0.0%) |
| 35 to 64 Years | 15 (16.1%) | 0 (0.0%) |
| 65 to 74 Years | 15 (60.0%) | 0 (0.0%) |
| 75 Years and over | 4 (23.5%) | 1 (5.9%) |
Disability Class: Self-Care Difficulty
| Age Bracket | Male | Female |
| 5 to 17 Years | 0 (0.0%) | 0 (0.0%) |
| 18 to 34 Years | 0 (0.0%) | 0 (0.0%) |
| 35 to 64 Years | 0 (0.0%) | 0 (0.0%) |
| 65 to 74 Years | 0 (0.0%) | 0 (0.0%) |
| 75 Years and over | 1 (5.9%) | 0 (0.0%) |
Technology Access in Towner
Computing Device Access in Towner
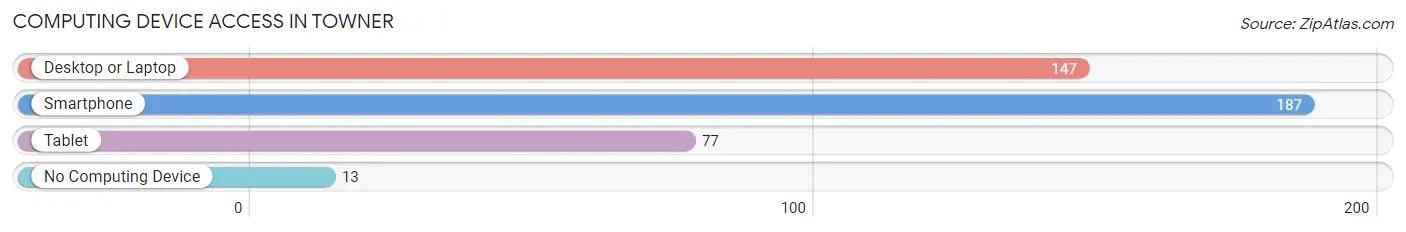
| Device Type | # Households | % Households |
| Desktop or Laptop | 147 | 68.1% |
| Smartphone | 187 | 86.6% |
| Tablet | 77 | 35.6% |
| No Computing Device | 13 | 6.0% |
| Total | 216 | 100.0% |
Internet Access in Towner
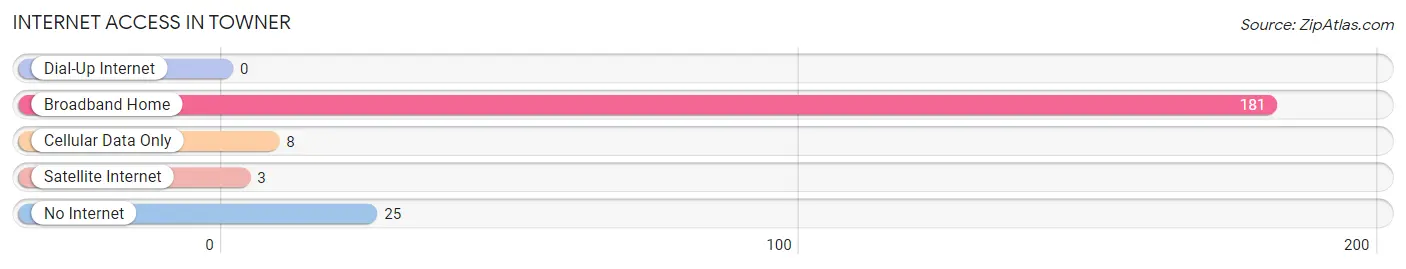
| Internet Type | # Households | % Households |
| Dial-Up Internet | 0 | 0.0% |
| Broadband Home | 181 | 83.8% |
| Cellular Data Only | 8 | 3.7% |
| Satellite Internet | 3 | 1.4% |
| No Internet | 25 | 11.6% |
| Total | 216 | 100.0% |
Towner Summary
Towner is a small city located in McHenry County, North Dakota. It is situated in the Turtle Mountains, a region of rolling hills and forests. The city has a population of 1,093 people, according to the 2010 census.
Geography
Towner is located in the Turtle Mountains, a region of rolling hills and forests. The city is situated on the banks of the Souris River, which flows through the city. The city is surrounded by agricultural land, with the Turtle Mountains to the west and the Souris River to the east. The city is located at an elevation of 1,845 feet above sea level.
Climate
Towner has a humid continental climate, with cold winters and warm summers. The average annual temperature is 45°F, with an average high of 68°F in the summer and an average low of 22°F in the winter. The average annual precipitation is 19.5 inches, with an average of 28 inches of snowfall per year.
Demographics
According to the 2010 census, the population of Towner was 1,093. The racial makeup of the city was 97.2% White, 0.3% African American, 0.2% Native American, 0.2% Asian, 0.1% Pacific Islander, 0.7% from other races, and 1.3% from two or more races. Hispanic or Latino of any race were 1.3% of the population.
Economy
Towner's economy is largely based on agriculture. The city is home to several farms, as well as a number of small businesses. The city is also home to a number of manufacturing companies, including a furniture factory and a plastics factory. The city is also home to a number of retail stores, including a grocery store, a hardware store, and a clothing store.
Education
Towner is served by the Towner-Granville-Upham School District. The district operates two elementary schools, one middle school, and one high school. The district also operates a number of alternative education programs, including a virtual school and a home school program.
Transportation
Towner is served by a number of highways, including US Highway 2, US Highway 52, and North Dakota Highway 5. The city is also served by a number of local roads. The city is served by the Towner Municipal Airport, which offers general aviation services.
Culture
Towner is home to a number of cultural attractions, including the Turtle Mountain Arts Council, which hosts a variety of events throughout the year. The city is also home to a number of parks, including the Towner City Park, which features a playground, picnic areas, and a walking path. The city is also home to a number of churches, including the United Methodist Church, the Lutheran Church, and the Catholic Church.
Conclusion
Towner is a small city located in McHenry County, North Dakota. It is situated in the Turtle Mountains, a region of rolling hills and forests. The city has a population of 1,093 people, according to the 2010 census. The city's economy is largely based on agriculture, with a number of small businesses and manufacturing companies. The city is served by a number of highways, as well as the Towner Municipal Airport. The city is home to a number of cultural attractions, including the Turtle Mountain Arts Council and a number of parks. Towner is served by the Towner-Granville-Upham School District, which operates two elementary schools, one middle school, and one high school.
Common Questions
What is the Total Population of Towner?
Total Population of Towner is 456.
What is the Total Male Population of Towner?
Total Male Population of Towner is 248.
What is the Total Female Population of Towner?
Total Female Population of Towner is 208.
What is the Ratio of Males per 100 Females in Towner?
There are 119.23 Males per 100 Females in Towner.
What is the Ratio of Females per 100 Males in Towner?
There are 83.87 Females per 100 Males in Towner.
What is the Median Population Age in Towner?
Median Population Age in Towner is 38.0 Years.
What is the Average Family Size in Towner
Average Family Size in Towner is 2.6 People.
What is the Average Household Size in Towner
Average Household Size in Towner is 2.1 People.
What is Per Capita Income in Towner?
Per Capita income in Towner is $32,684.
What is the Median Family Income in Towner?
Median Family Income in Towner is $59,531.
What is the Median Household income in Towner?
Median Household Income in Towner is $51,500.
What is Income or Wage Gap in Towner?
Income or Wage Gap in Towner is 29.2%.
Women in Towner earn 70.8 cents for every dollar earned by a man.
What is Family Income Deficit in Towner?
Family Income Deficit in Towner is $16,955.
Families that are below poverty line in Towner earn $16,955 less on average than the poverty threshold level.
What is Inequality or Gini Index in Towner?
Inequality or Gini Index in Towner is 0.42.
How Large is the Labor Force in Towner?
There are 230 People in the Labor Forcein in Towner.
What is the Percentage of People in the Labor Force in Towner?
68.7% of People are in the Labor Force in Towner.
What is the Unemployment Rate in Towner?
Unemployment Rate in Towner is 13.0%.