Bonny Doon, CA
Bonny Doon Map
Bonny Doon Overview
2,858
TOTAL POPULATION
1,485
MALE POPULATION
1,373
FEMALE POPULATION
108.16
MALES / 100 FEMALES
92.46
FEMALES / 100 MALES
49.6
MEDIAN AGE
3.0
AVG FAMILY SIZE
2.8
AVG HOUSEHOLD SIZE
$58,821
PER CAPITA INCOME
$140,125
AVG FAMILY INCOME
$139,375
AVG HOUSEHOLD INCOME
42.1%
WAGE / INCOME GAP [ % ]
57.9¢/ $1
WAGE / INCOME GAP [ $ ]
0.49
INEQUALITY / GINI INDEX
1,364
LABOR FORCE [ PEOPLE ]
55.1%
PERCENT IN LABOR FORCE
3.7%
UNEMPLOYMENT RATE
Bonny Doon Area Codes
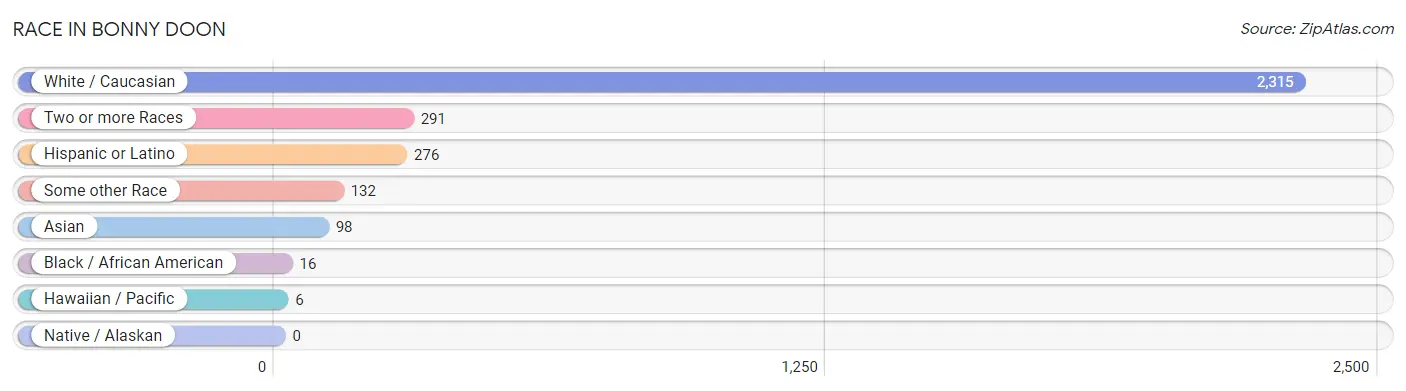
Race in Bonny Doon
The most populous races in Bonny Doon are White / Caucasian (2,315 | 81.0%), Two or more Races (291 | 10.2%), and Hispanic or Latino (276 | 9.7%).
| Race | # Population | % Population |
| Asian | 98 | 3.4% |
| Black / African American | 16 | 0.6% |
| Hawaiian / Pacific | 6 | 0.2% |
| Hispanic or Latino | 276 | 9.7% |
| Native / Alaskan | 0 | 0.0% |
| White / Caucasian | 2,315 | 81.0% |
| Two or more Races | 291 | 10.2% |
| Some other Race | 132 | 4.6% |
| Total | 2,858 | 100.0% |
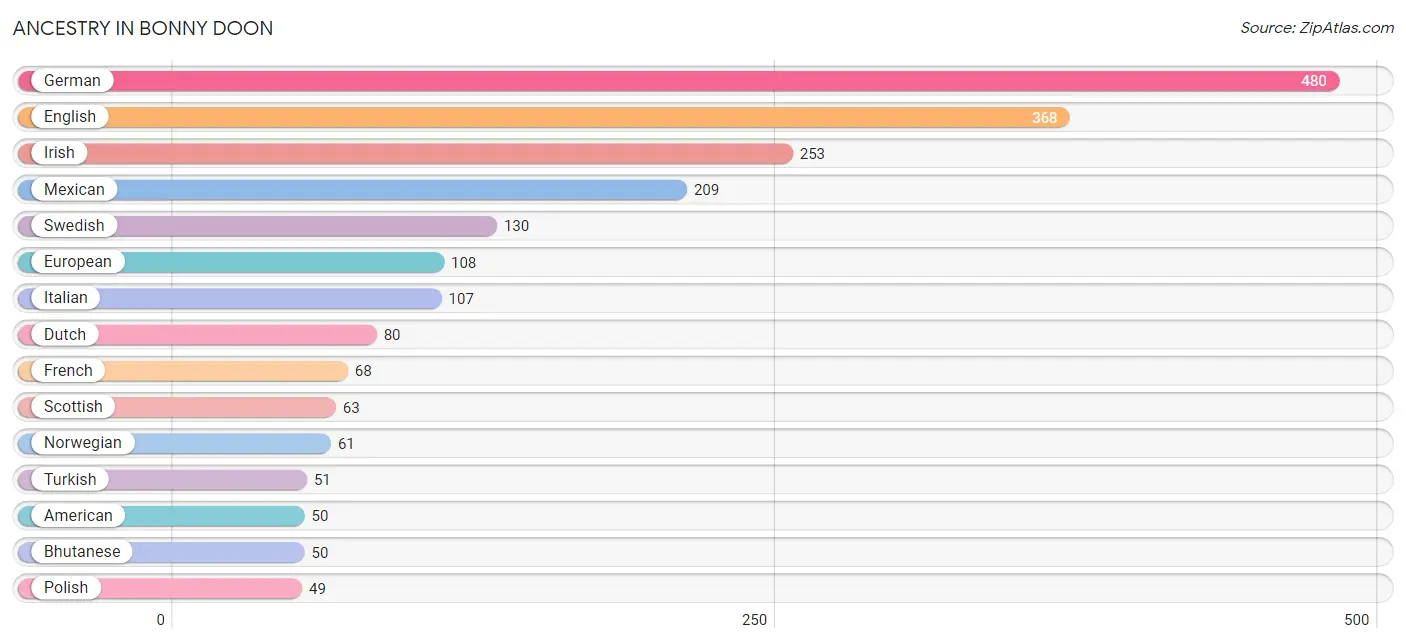
Ancestry in Bonny Doon
The most populous ancestries reported in Bonny Doon are German (480 | 16.8%), English (368 | 12.9%), Irish (253 | 8.8%), Mexican (209 | 7.3%), and Swedish (130 | 4.5%), together accounting for 50.4% of all Bonny Doon residents.
| Ancestry | # Population | % Population |
| African | 2 | 0.1% |
| American | 50 | 1.8% |
| Austrian | 4 | 0.1% |
| Bangladeshi | 27 | 0.9% |
| Bhutanese | 50 | 1.8% |
| Bolivian | 1 | 0.0% |
| Brazilian | 16 | 0.6% |
| British | 30 | 1.1% |
| Celtic | 2 | 0.1% |
| Central American | 18 | 0.6% |
| Chilean | 12 | 0.4% |
| Croatian | 4 | 0.1% |
| Czech | 29 | 1.0% |
| Danish | 22 | 0.8% |
| Dutch | 80 | 2.8% |
| Eastern European | 32 | 1.1% |
| English | 368 | 12.9% |
| European | 108 | 3.8% |
| French | 68 | 2.4% |
| German | 480 | 16.8% |
| Greek | 15 | 0.5% |
| Guamanian / Chamorro | 6 | 0.2% |
| Hungarian | 39 | 1.4% |
| Indian (Asian) | 46 | 1.6% |
| Irish | 253 | 8.8% |
| Israeli | 4 | 0.1% |
| Italian | 107 | 3.7% |
| Japanese | 2 | 0.1% |
| Korean | 1 | 0.0% |
| Lithuanian | 28 | 1.0% |
| Mexican | 209 | 7.3% |
| Northern European | 31 | 1.1% |
| Norwegian | 61 | 2.1% |
| Pakistani | 6 | 0.2% |
| Polish | 49 | 1.7% |
| Portuguese | 16 | 0.6% |
| Puerto Rican | 7 | 0.2% |
| Romanian | 33 | 1.1% |
| Russian | 41 | 1.4% |
| Salvadoran | 18 | 0.6% |
| Scandinavian | 7 | 0.2% |
| Scotch-Irish | 16 | 0.6% |
| Scottish | 63 | 2.2% |
| Slovene | 11 | 0.4% |
| South American | 13 | 0.4% |
| Spaniard | 20 | 0.7% |
| Spanish | 9 | 0.3% |
| Subsaharan African | 2 | 0.1% |
| Swedish | 130 | 4.5% |
| Thai | 16 | 0.6% |
| Turkish | 51 | 1.8% | View All 51 Rows |
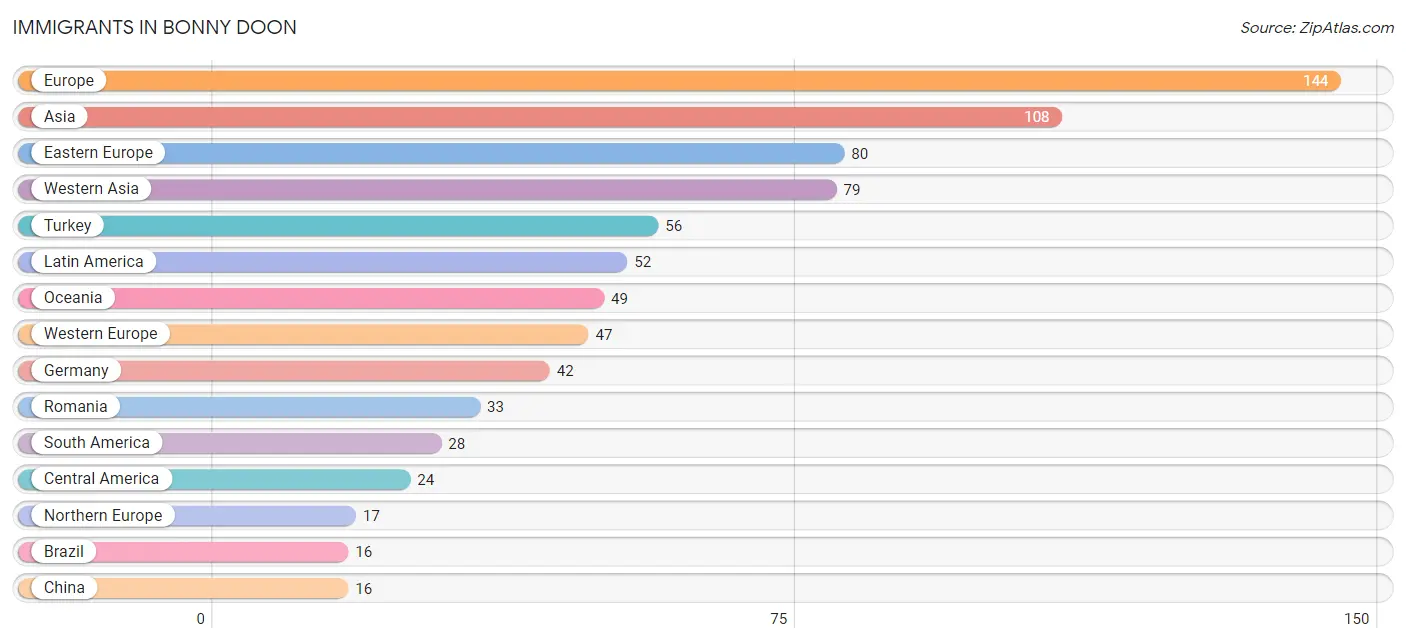
Immigrants in Bonny Doon
The most numerous immigrant groups reported in Bonny Doon came from Europe (144 | 5.0%), Asia (108 | 3.8%), Eastern Europe (80 | 2.8%), Western Asia (79 | 2.8%), and Turkey (56 | 2.0%), together accounting for 16.3% of all Bonny Doon residents.
| Immigration Origin | # Population | % Population |
| Africa | 1 | 0.0% |
| Asia | 108 | 3.8% |
| Brazil | 16 | 0.6% |
| Cambodia | 2 | 0.1% |
| Cameroon | 1 | 0.0% |
| Canada | 15 | 0.5% |
| Central America | 24 | 0.8% |
| Chile | 12 | 0.4% |
| China | 16 | 0.6% |
| Croatia | 13 | 0.4% |
| Czechoslovakia | 13 | 0.4% |
| Eastern Asia | 16 | 0.6% |
| Eastern Europe | 80 | 2.8% |
| El Salvador | 12 | 0.4% |
| Europe | 144 | 5.0% |
| Germany | 42 | 1.5% |
| Guatemala | 6 | 0.2% |
| Israel | 8 | 0.3% |
| Laos | 5 | 0.2% |
| Latin America | 52 | 1.8% |
| Mexico | 6 | 0.2% |
| Middle Africa | 1 | 0.0% |
| Northern Europe | 17 | 0.6% |
| Oceania | 49 | 1.7% |
| Poland | 7 | 0.2% |
| Romania | 33 | 1.1% |
| Russia | 14 | 0.5% |
| South America | 28 | 1.0% |
| South Eastern Asia | 13 | 0.4% |
| Switzerland | 5 | 0.2% |
| Syria | 15 | 0.5% |
| Thailand | 6 | 0.2% |
| Turkey | 56 | 2.0% |
| Western Asia | 79 | 2.8% |
| Western Europe | 47 | 1.6% | View All 35 Rows |
Sex and Age in Bonny Doon
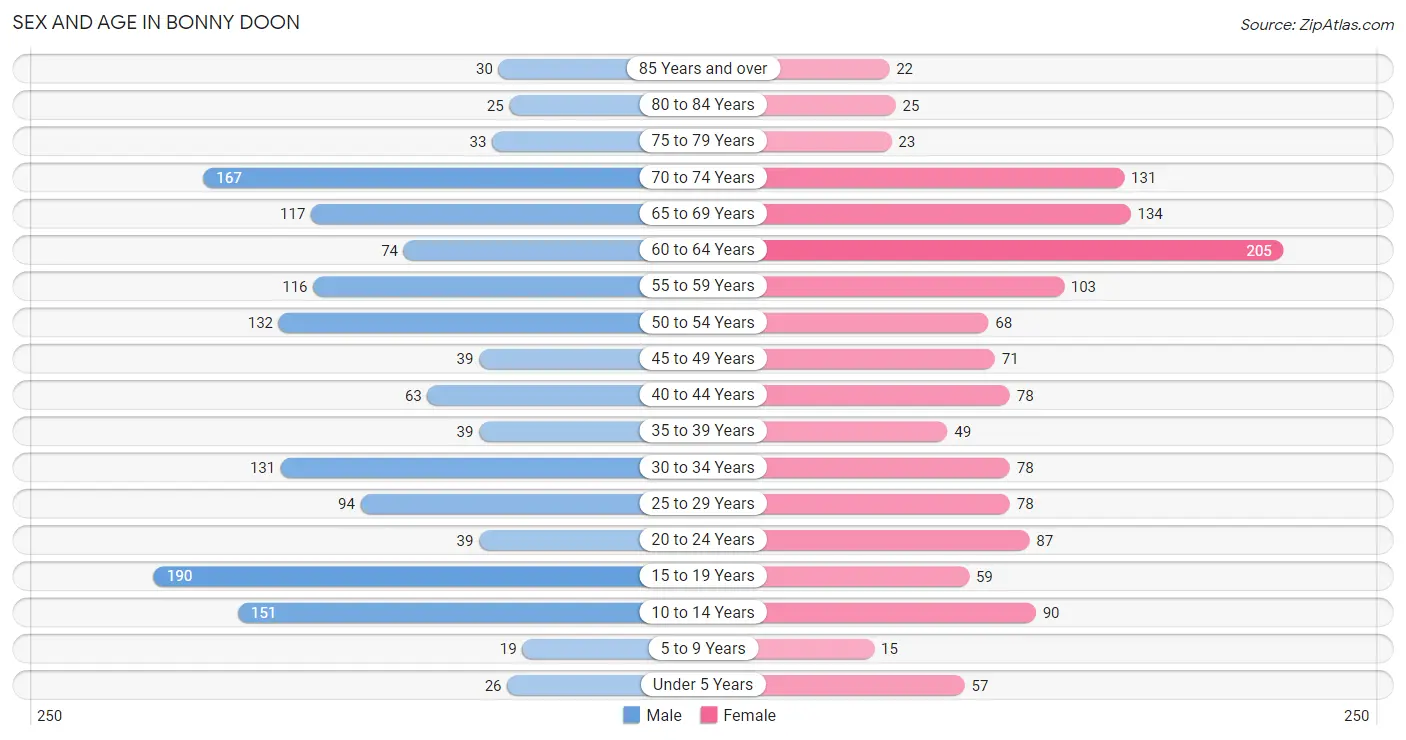
Sex and Age in Bonny Doon
The most populous age groups in Bonny Doon are 15 to 19 Years (190 | 12.8%) for men and 60 to 64 Years (205 | 14.9%) for women.
| Age Bracket | Male | Female |
| Under 5 Years | 26 (1.8%) | 57 (4.2%) |
| 5 to 9 Years | 19 (1.3%) | 15 (1.1%) |
| 10 to 14 Years | 151 (10.2%) | 90 (6.6%) |
| 15 to 19 Years | 190 (12.8%) | 59 (4.3%) |
| 20 to 24 Years | 39 (2.6%) | 87 (6.3%) |
| 25 to 29 Years | 94 (6.3%) | 78 (5.7%) |
| 30 to 34 Years | 131 (8.8%) | 78 (5.7%) |
| 35 to 39 Years | 39 (2.6%) | 49 (3.6%) |
| 40 to 44 Years | 63 (4.2%) | 78 (5.7%) |
| 45 to 49 Years | 39 (2.6%) | 71 (5.2%) |
| 50 to 54 Years | 132 (8.9%) | 68 (5.0%) |
| 55 to 59 Years | 116 (7.8%) | 103 (7.5%) |
| 60 to 64 Years | 74 (5.0%) | 205 (14.9%) |
| 65 to 69 Years | 117 (7.9%) | 134 (9.8%) |
| 70 to 74 Years | 167 (11.3%) | 131 (9.5%) |
| 75 to 79 Years | 33 (2.2%) | 23 (1.7%) |
| 80 to 84 Years | 25 (1.7%) | 25 (1.8%) |
| 85 Years and over | 30 (2.0%) | 22 (1.6%) |
| Total | 1,485 (100.0%) | 1,373 (100.0%) |
Families and Households in Bonny Doon
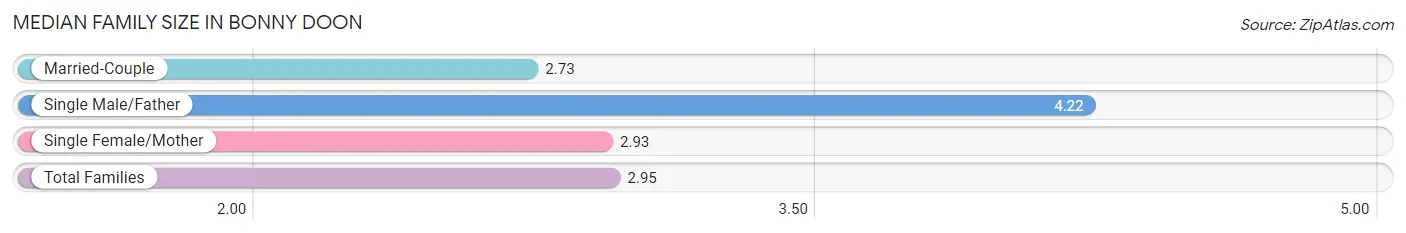
Median Family Size in Bonny Doon
The median family size in Bonny Doon is 2.95 persons per family, with single male/father families (96 | 13.1%) accounting for the largest median family size of 4.22 persons per family. On the other hand, married-couple families (541 | 73.6%) represent the smallest median family size with 2.73 persons per family.
| Family Type | # Families | Family Size |
| Married-Couple | 541 (73.6%) | 2.73 |
| Single Male/Father | 96 (13.1%) | 4.22 |
| Single Female/Mother | 98 (13.3%) | 2.93 |
| Total Families | 735 (100.0%) | 2.95 |
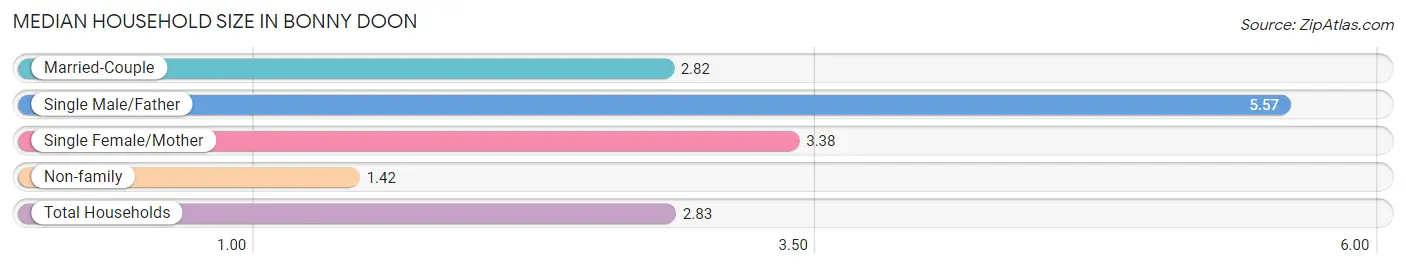
Median Household Size in Bonny Doon
The median household size in Bonny Doon is 2.83 persons per household, with single male/father households (96 | 10.0%) accounting for the largest median household size of 5.57 persons per household. non-family households (221 | 23.1%) represent the smallest median household size with 1.42 persons per household.
| Household Type | # Households | Household Size |
| Married-Couple | 541 (56.6%) | 2.82 |
| Single Male/Father | 96 (10.0%) | 5.57 |
| Single Female/Mother | 98 (10.2%) | 3.38 |
| Non-family | 221 (23.1%) | 1.42 |
| Total Households | 956 (100.0%) | 2.83 |
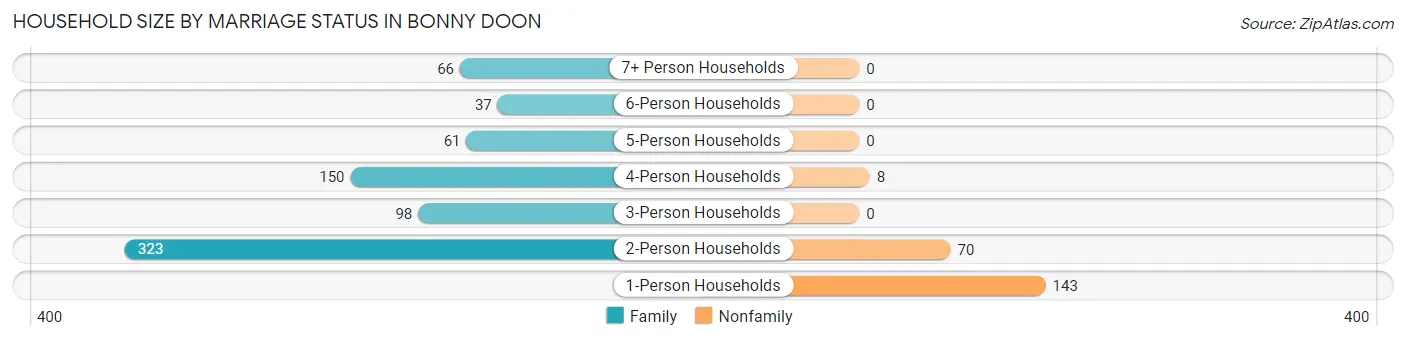
Household Size by Marriage Status in Bonny Doon
Out of a total of 956 households in Bonny Doon, 735 (76.9%) are family households, while 221 (23.1%) are nonfamily households. The most numerous type of family households are 2-person households, comprising 323, and the most common type of nonfamily households are 1-person households, comprising 143.
| Household Size | Family Households | Nonfamily Households |
| 1-Person Households | - | 143 (15.0%) |
| 2-Person Households | 323 (33.8%) | 70 (7.3%) |
| 3-Person Households | 98 (10.2%) | 0 (0.0%) |
| 4-Person Households | 150 (15.7%) | 8 (0.8%) |
| 5-Person Households | 61 (6.4%) | 0 (0.0%) |
| 6-Person Households | 37 (3.9%) | 0 (0.0%) |
| 7+ Person Households | 66 (6.9%) | 0 (0.0%) |
| Total | 735 (76.9%) | 221 (23.1%) |
Female Fertility in Bonny Doon
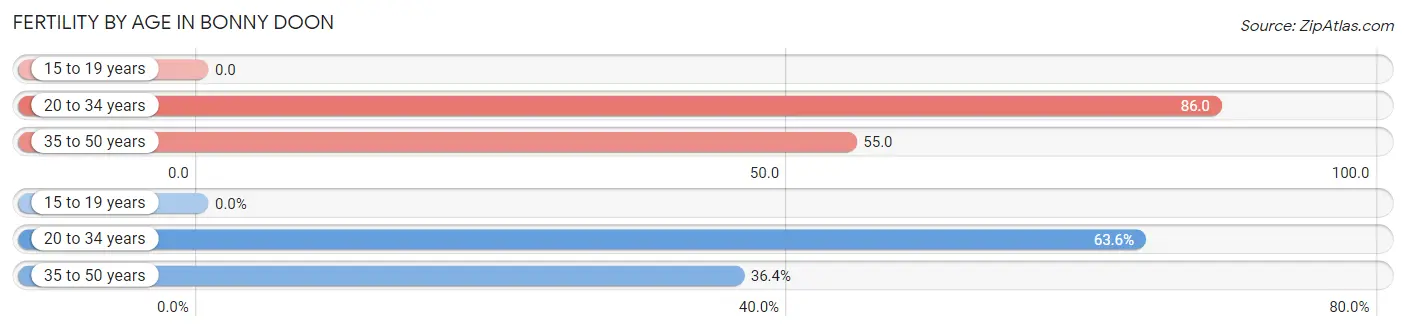
Fertility by Age in Bonny Doon
Average fertility rate in Bonny Doon is 64.0 births per 1,000 women. Women in the age bracket of 20 to 34 years have the highest fertility rate with 86.0 births per 1,000 women. Women in the age bracket of 20 to 34 years acount for 63.6% of all women with births.
| Age Bracket | Women with Births | Births / 1,000 Women |
| 15 to 19 years | 0 (0.0%) | 0.0 |
| 20 to 34 years | 21 (63.6%) | 86.0 |
| 35 to 50 years | 12 (36.4%) | 55.0 |
| Total | 33 (100.0%) | 64.0 |
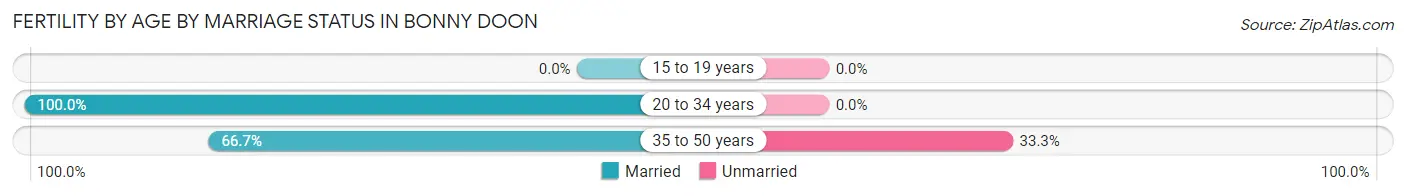
Fertility by Age by Marriage Status in Bonny Doon
87.9% of women with births (33) in Bonny Doon are married. The highest percentage of unmarried women with births falls into 35 to 50 years age bracket with 33.3% of them unmarried at the time of birth, while the lowest percentage of unmarried women with births belong to 20 to 34 years age bracket with 0.0% of them unmarried.
| Age Bracket | Married | Unmarried |
| 15 to 19 years | 0 (0.0%) | 0 (0.0%) |
| 20 to 34 years | 21 (100.0%) | 0 (0.0%) |
| 35 to 50 years | 8 (66.7%) | 4 (33.3%) |
| Total | 29 (87.9%) | 4 (12.1%) |
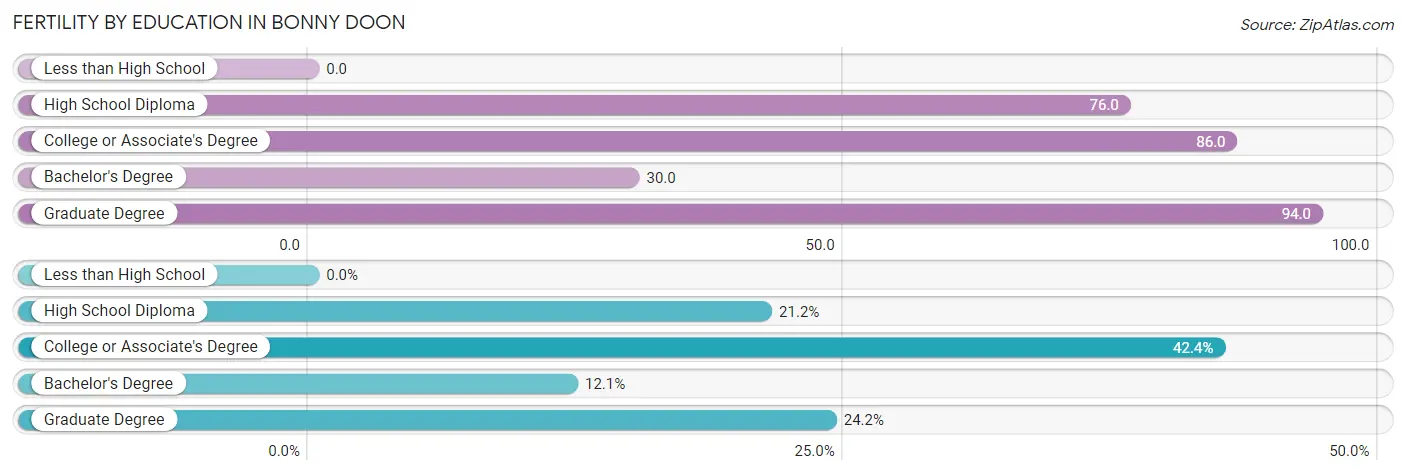
Fertility by Education in Bonny Doon
| Educational Attainment | Women with Births | Births / 1,000 Women |
| Less than High School | 0 (0.0%) | 0.0 |
| High School Diploma | 7 (21.2%) | 76.0 |
| College or Associate's Degree | 14 (42.4%) | 86.0 |
| Bachelor's Degree | 4 (12.1%) | 30.0 |
| Graduate Degree | 8 (24.2%) | 94.0 |
| Total | 33 (100.0%) | 64.0 |
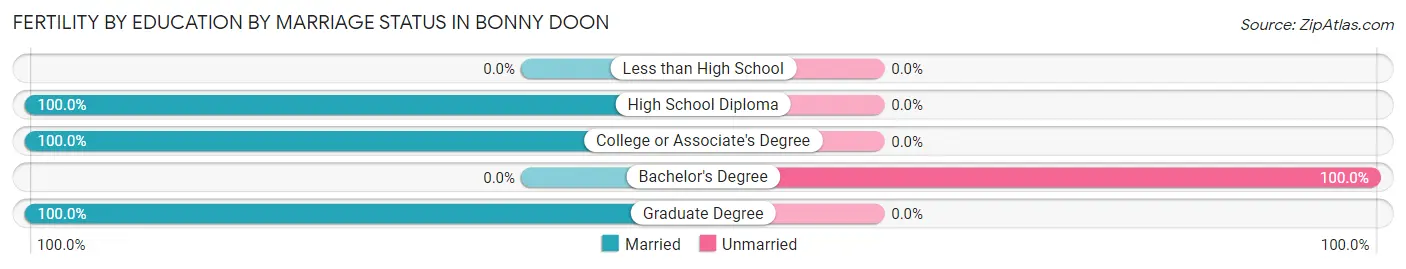
Fertility by Education by Marriage Status in Bonny Doon
12.1% of women with births in Bonny Doon are unmarried. Women with the educational attainment of high school diploma are most likely to be married with 100.0% of them married at childbirth, while women with the educational attainment of bachelor's degree are least likely to be married with 100.0% of them unmarried at childbirth.
| Educational Attainment | Married | Unmarried |
| Less than High School | 0 (0.0%) | 0 (0.0%) |
| High School Diploma | 7 (100.0%) | 0 (0.0%) |
| College or Associate's Degree | 14 (100.0%) | 0 (0.0%) |
| Bachelor's Degree | 0 (0.0%) | 4 (100.0%) |
| Graduate Degree | 8 (100.0%) | 0 (0.0%) |
| Total | 29 (87.9%) | 4 (12.1%) |
Income in Bonny Doon
Income Overview in Bonny Doon
Per Capita Income in Bonny Doon is $58,821, while median incomes of families and households are $140,125 and $139,375 respectively.
| Characteristic | Number | Measure |
| Per Capita Income | 2,858 | $58,821 |
| Median Family Income | 735 | $140,125 |
| Mean Family Income | 735 | $225,617 |
| Median Household Income | 956 | $139,375 |
| Mean Household Income | 956 | $211,110 |
| Income Deficit | 735 | $0 |
| Wage / Income Gap (%) | 2,858 | 42.11% |
| Wage / Income Gap ($) | 2,858 | 57.89¢ per $1 |
| Gini / Inequality Index | 2,858 | 0.49 |
Earnings by Sex in Bonny Doon
Average Earnings in Bonny Doon are $51,215, $58,613 for men and $33,929 for women, a difference of 42.1%.
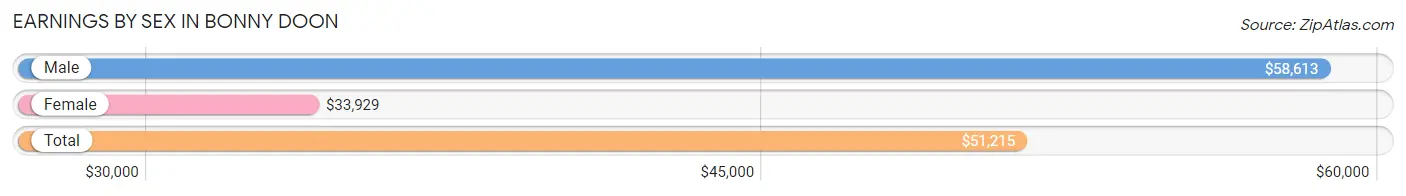
| Sex | Number | Average Earnings |
| Male | 799 (52.4%) | $58,613 |
| Female | 726 (47.6%) | $33,929 |
| Total | 1,525 (100.0%) | $51,215 |
Earnings by Sex by Income Bracket in Bonny Doon
The most common earnings brackets in Bonny Doon are $100,000+ for men (233 | 29.2%) and $75,000 to $99,999 for women (127 | 17.5%).
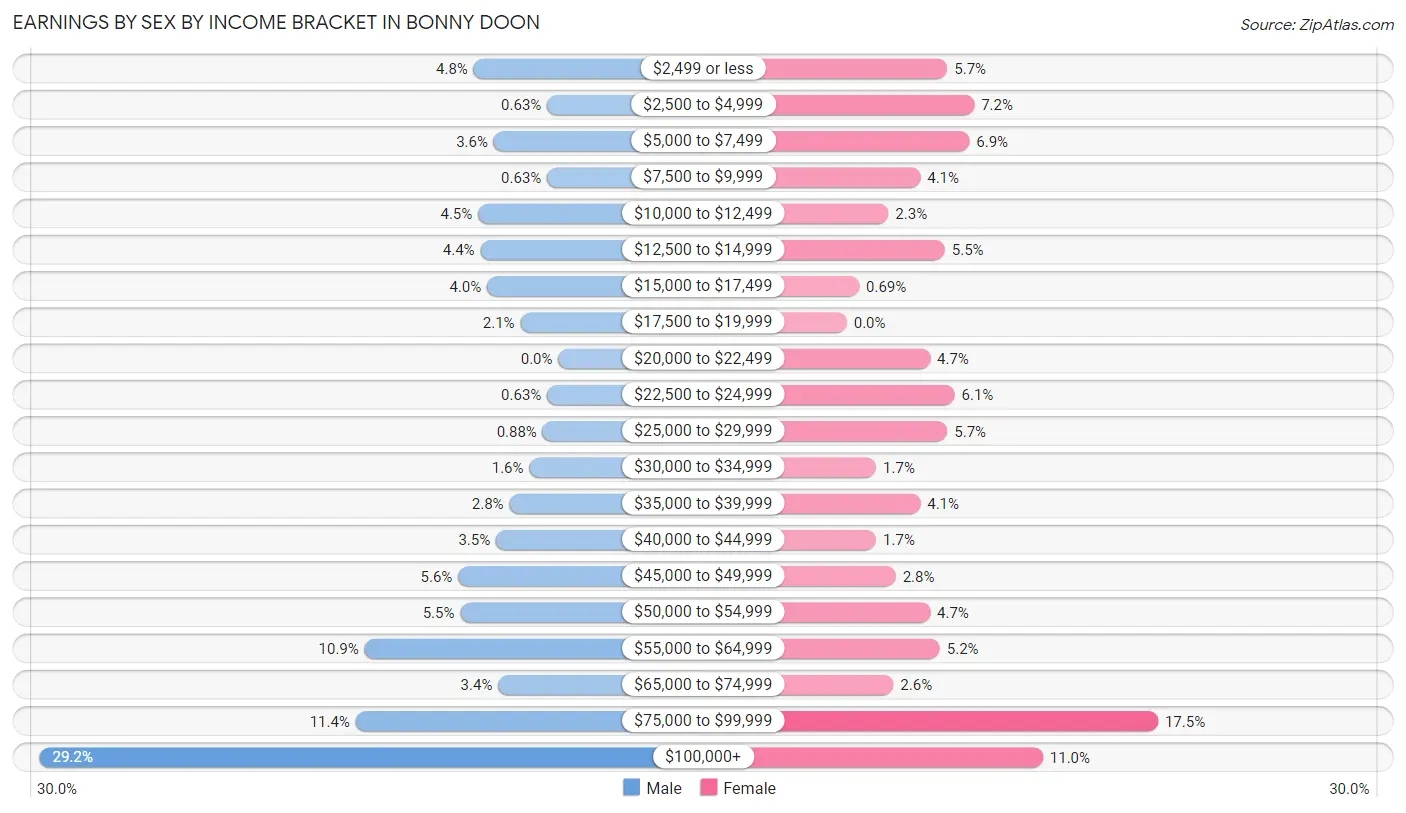
| Income | Male | Female |
| $2,499 or less | 38 (4.8%) | 41 (5.7%) |
| $2,500 to $4,999 | 5 (0.6%) | 52 (7.2%) |
| $5,000 to $7,499 | 29 (3.6%) | 50 (6.9%) |
| $7,500 to $9,999 | 5 (0.6%) | 30 (4.1%) |
| $10,000 to $12,499 | 36 (4.5%) | 17 (2.3%) |
| $12,500 to $14,999 | 35 (4.4%) | 40 (5.5%) |
| $15,000 to $17,499 | 32 (4.0%) | 5 (0.7%) |
| $17,500 to $19,999 | 17 (2.1%) | 0 (0.0%) |
| $20,000 to $22,499 | 0 (0.0%) | 34 (4.7%) |
| $22,500 to $24,999 | 5 (0.6%) | 44 (6.1%) |
| $25,000 to $29,999 | 7 (0.9%) | 41 (5.7%) |
| $30,000 to $34,999 | 13 (1.6%) | 12 (1.7%) |
| $35,000 to $39,999 | 22 (2.8%) | 30 (4.1%) |
| $40,000 to $44,999 | 28 (3.5%) | 12 (1.7%) |
| $45,000 to $49,999 | 45 (5.6%) | 20 (2.8%) |
| $50,000 to $54,999 | 44 (5.5%) | 34 (4.7%) |
| $55,000 to $64,999 | 87 (10.9%) | 38 (5.2%) |
| $65,000 to $74,999 | 27 (3.4%) | 19 (2.6%) |
| $75,000 to $99,999 | 91 (11.4%) | 127 (17.5%) |
| $100,000+ | 233 (29.2%) | 80 (11.0%) |
| Total | 799 (100.0%) | 726 (100.0%) |
Earnings by Sex by Educational Attainment in Bonny Doon
Average earnings in Bonny Doon are $59,637 for men and $42,083 for women, a difference of 29.4%. Men with an educational attainment of high school diploma enjoy the highest average annual earnings of $85,197, while those with college or associate's degree education earn the least with $46,750. Women with an educational attainment of college or associate's degree earn the most with the average annual earnings of $63,125, while those with graduate degree education have the smallest earnings of $37,188.
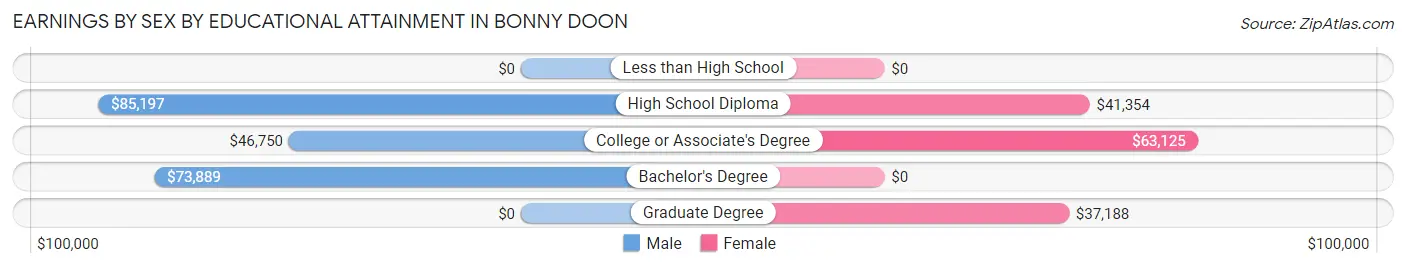
| Educational Attainment | Male Income | Female Income |
| Less than High School | - | - |
| High School Diploma | $85,197 | $41,354 |
| College or Associate's Degree | $46,750 | $63,125 |
| Bachelor's Degree | $73,889 | $0 |
| Graduate Degree | - | - |
| Total | $59,637 | $42,083 |
Family Income in Bonny Doon
Family Income Brackets in Bonny Doon
According to the Bonny Doon family income data, there are 240 families falling into the $200,000+ income range, which is the most common income bracket and makes up 32.7% of all families.
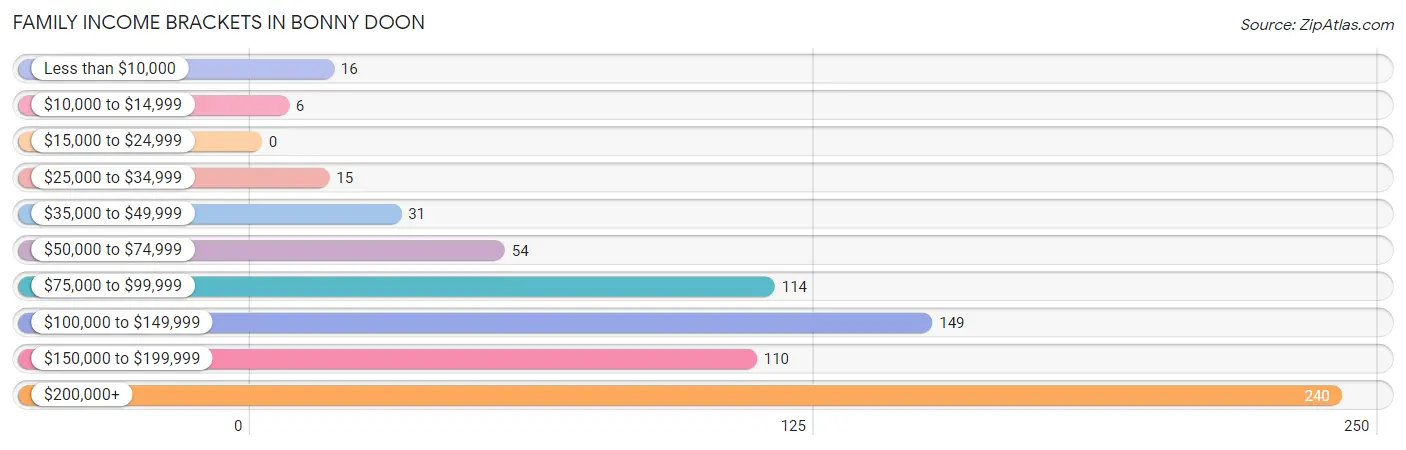
| Income Bracket | # Families | % Families |
| Less than $10,000 | 16 | 2.2% |
| $10,000 to $14,999 | 6 | 0.8% |
| $15,000 to $24,999 | 0 | 0.0% |
| $25,000 to $34,999 | 15 | 2.0% |
| $35,000 to $49,999 | 31 | 4.2% |
| $50,000 to $74,999 | 54 | 7.3% |
| $75,000 to $99,999 | 114 | 15.5% |
| $100,000 to $149,999 | 149 | 20.3% |
| $150,000 to $199,999 | 110 | 15.0% |
| $200,000+ | 240 | 32.7% |
Family Income by Famaliy Size in Bonny Doon
4-person families (206 | 28.0%) account for the highest median family income in Bonny Doon with $200,500 per family, while 3-person families (71 | 9.7%) have the highest median income of $59,137 per family member.
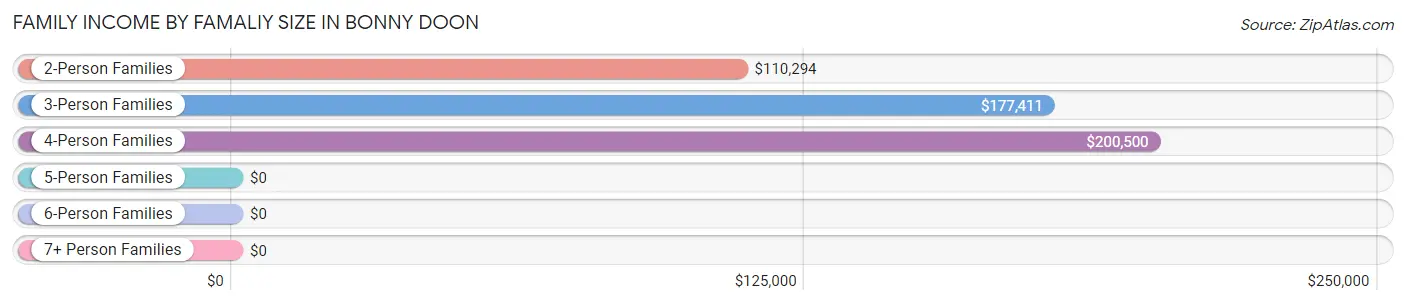
| Income Bracket | # Families | Median Income |
| 2-Person Families | 364 (49.5%) | $110,294 |
| 3-Person Families | 71 (9.7%) | $177,411 |
| 4-Person Families | 206 (28.0%) | $200,500 |
| 5-Person Families | 46 (6.3%) | $0 |
| 6-Person Families | 17 (2.3%) | $0 |
| 7+ Person Families | 31 (4.2%) | $0 |
| Total | 735 (100.0%) | $140,125 |
Family Income by Number of Earners in Bonny Doon
The median family income in Bonny Doon is $140,125, with families comprising 3+ earners (125) having the highest median family income of $207,750, while families with no earners (70) have the lowest median family income of $80,417, accounting for 17.0% and 9.5% of families, respectively.
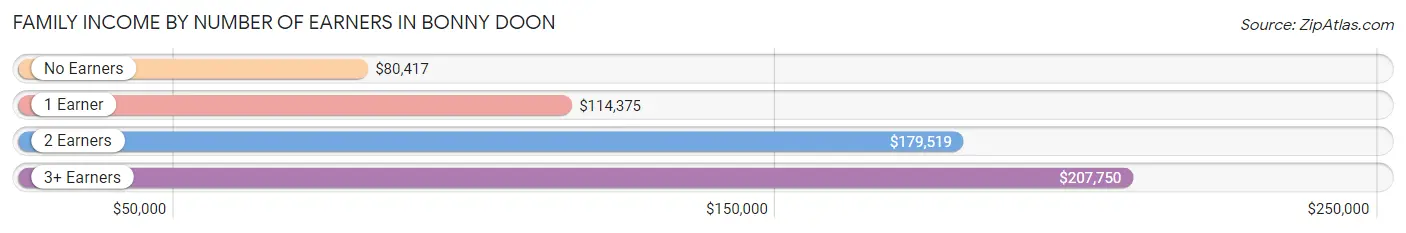
| Number of Earners | # Families | Median Income |
| No Earners | 70 (9.5%) | $80,417 |
| 1 Earner | 339 (46.1%) | $114,375 |
| 2 Earners | 201 (27.4%) | $179,519 |
| 3+ Earners | 125 (17.0%) | $207,750 |
| Total | 735 (100.0%) | $140,125 |
Household Income in Bonny Doon
Household Income Brackets in Bonny Doon
With 348 households falling in the category, the $200,000+ income range is the most frequent in Bonny Doon, accounting for 36.4% of all households. In contrast, only 8 households (0.8%) fall into the $10,000 to $14,999 income bracket, making it the least populous group.
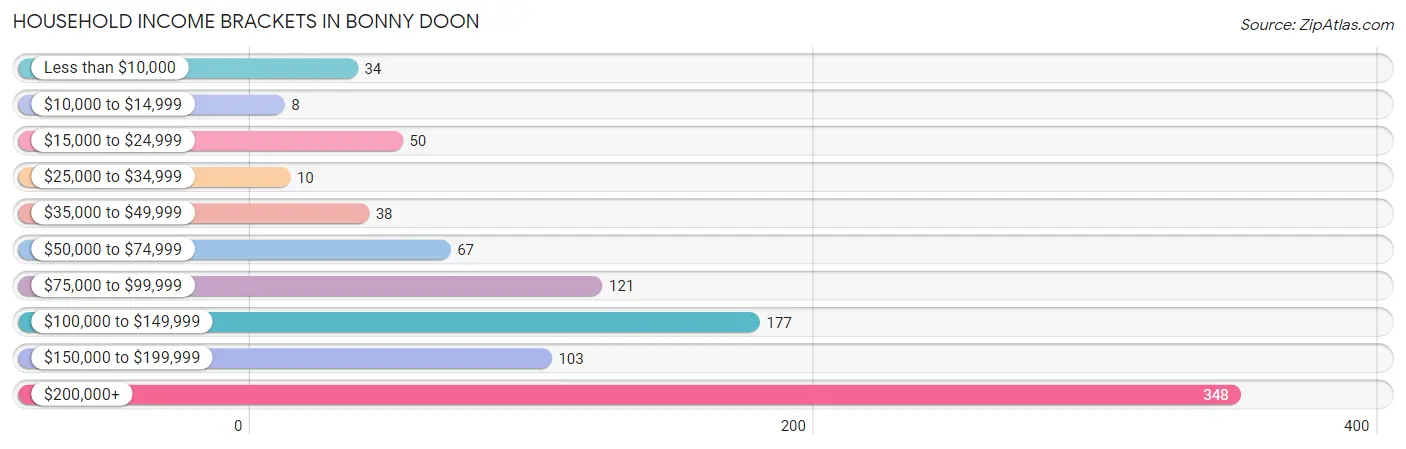
| Income Bracket | # Households | % Households |
| Less than $10,000 | 34 | 3.6% |
| $10,000 to $14,999 | 8 | 0.8% |
| $15,000 to $24,999 | 50 | 5.2% |
| $25,000 to $34,999 | 10 | 1.0% |
| $35,000 to $49,999 | 38 | 4.0% |
| $50,000 to $74,999 | 67 | 7.0% |
| $75,000 to $99,999 | 121 | 12.7% |
| $100,000 to $149,999 | 177 | 18.5% |
| $150,000 to $199,999 | 103 | 10.8% |
| $200,000+ | 348 | 36.4% |
Household Income by Householder Age in Bonny Doon
The median household income in Bonny Doon is $139,375, with the highest median household income of $202,917 found in the 45 to 64 years age bracket for the primary householder. A total of 372 households (38.9%) fall into this category. Meanwhile, the 15 to 24 years age bracket for the primary householder has the lowest median household income of $0, with 7 households (0.7%) in this group.
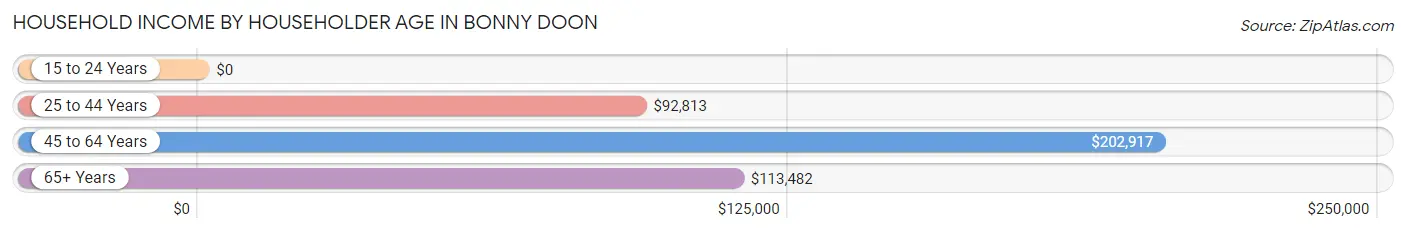
| Income Bracket | # Households | Median Income |
| 15 to 24 Years | 7 (0.7%) | $0 |
| 25 to 44 Years | 206 (21.5%) | $92,813 |
| 45 to 64 Years | 372 (38.9%) | $202,917 |
| 65+ Years | 371 (38.8%) | $113,482 |
| Total | 956 (100.0%) | $139,375 |
Poverty in Bonny Doon
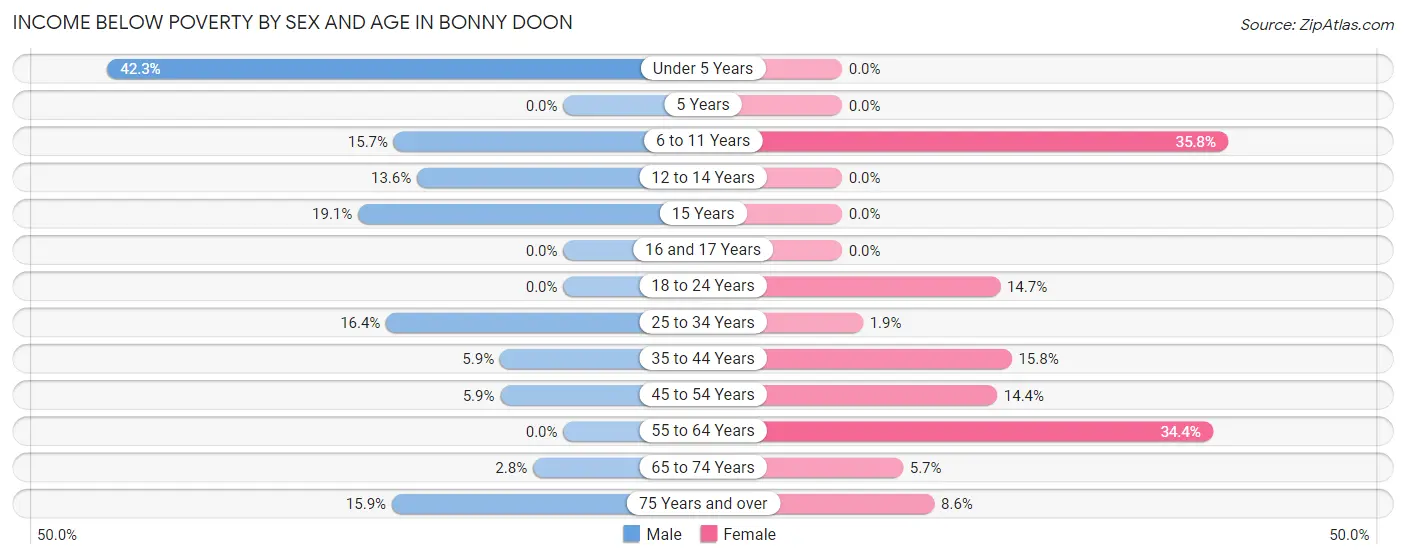
Income Below Poverty by Sex and Age in Bonny Doon
With 7.8% poverty level for males and 15.4% for females among the residents of Bonny Doon, under 5 year old males and 6 to 11 year old females are the most vulnerable to poverty, with 11 males (42.3%) and 24 females (35.8%) in their respective age groups living below the poverty level.
| Age Bracket | Male | Female |
| Under 5 Years | 11 (42.3%) | 0 (0.0%) |
| 5 Years | 0 (0.0%) | 0 (0.0%) |
| 6 to 11 Years | 14 (15.7%) | 24 (35.8%) |
| 12 to 14 Years | 11 (13.6%) | 0 (0.0%) |
| 15 Years | 4 (19.1%) | 0 (0.0%) |
| 16 and 17 Years | 0 (0.0%) | 0 (0.0%) |
| 18 to 24 Years | 0 (0.0%) | 16 (14.7%) |
| 25 to 34 Years | 37 (16.4%) | 3 (1.9%) |
| 35 to 44 Years | 6 (5.9%) | 20 (15.8%) |
| 45 to 54 Years | 10 (5.9%) | 20 (14.4%) |
| 55 to 64 Years | 0 (0.0%) | 106 (34.4%) |
| 65 to 74 Years | 8 (2.8%) | 15 (5.7%) |
| 75 Years and over | 14 (15.9%) | 6 (8.6%) |
| Total | 115 (7.8%) | 210 (15.4%) |
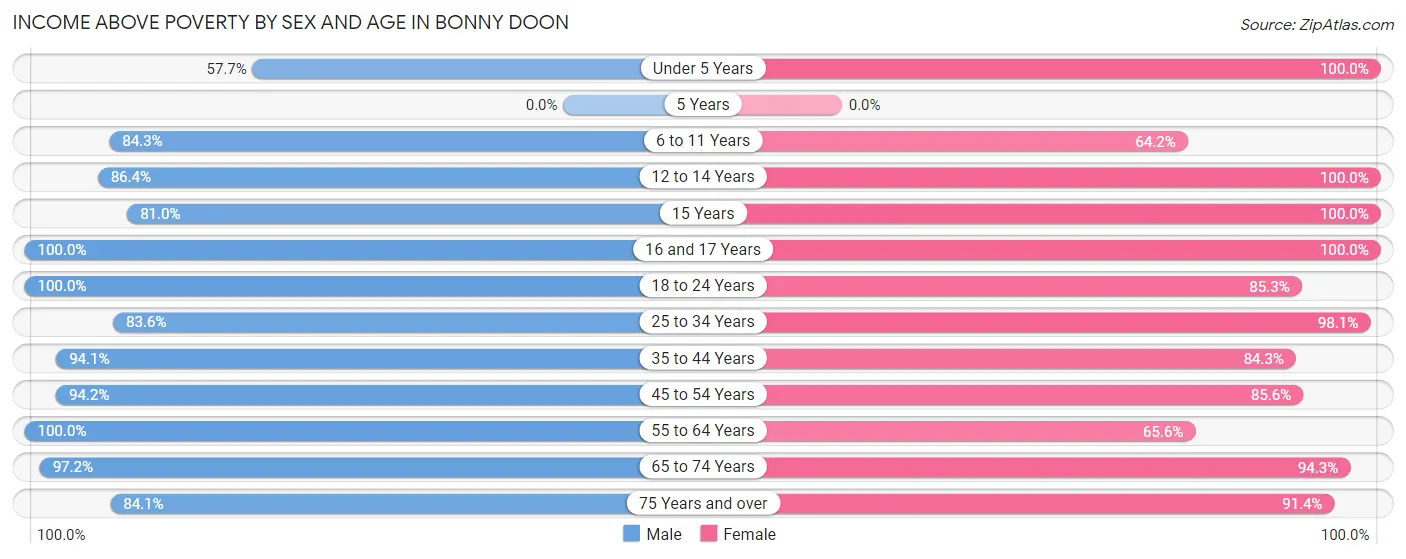
Income Above Poverty by Sex and Age in Bonny Doon
According to the poverty statistics in Bonny Doon, males aged 16 and 17 years and females aged under 5 years are the age groups that are most secure financially, with 100.0% of males and 100.0% of females in these age groups living above the poverty line.
| Age Bracket | Male | Female |
| Under 5 Years | 15 (57.7%) | 57 (100.0%) |
| 5 Years | 0 (0.0%) | 0 (0.0%) |
| 6 to 11 Years | 75 (84.3%) | 43 (64.2%) |
| 12 to 14 Years | 70 (86.4%) | 37 (100.0%) |
| 15 Years | 17 (80.9%) | 3 (100.0%) |
| 16 and 17 Years | 81 (100.0%) | 30 (100.0%) |
| 18 to 24 Years | 122 (100.0%) | 93 (85.3%) |
| 25 to 34 Years | 188 (83.6%) | 152 (98.1%) |
| 35 to 44 Years | 96 (94.1%) | 107 (84.3%) |
| 45 to 54 Years | 161 (94.2%) | 119 (85.6%) |
| 55 to 64 Years | 190 (100.0%) | 202 (65.6%) |
| 65 to 74 Years | 276 (97.2%) | 250 (94.3%) |
| 75 Years and over | 74 (84.1%) | 64 (91.4%) |
| Total | 1,365 (92.2%) | 1,157 (84.6%) |
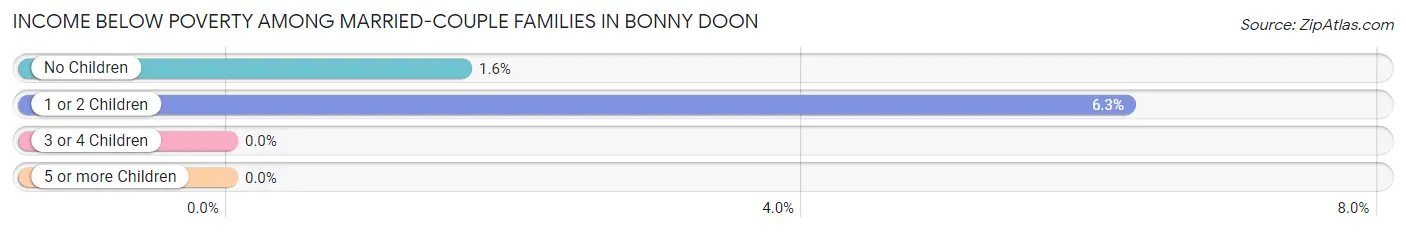
Income Below Poverty Among Married-Couple Families in Bonny Doon
The poverty statistics for married-couple families in Bonny Doon show that 3.0% or 16 of the total 541 families live below the poverty line. Families with 1 or 2 children have the highest poverty rate of 6.2%, comprising of 10 families. On the other hand, families with 3 or 4 children have the lowest poverty rate of 0.0%, which includes 0 families.
| Children | Above Poverty | Below Poverty |
| No Children | 361 (98.4%) | 6 (1.6%) |
| 1 or 2 Children | 150 (93.8%) | 10 (6.2%) |
| 3 or 4 Children | 14 (100.0%) | 0 (0.0%) |
| 5 or more Children | 0 (0.0%) | 0 (0.0%) |
| Total | 525 (97.0%) | 16 (3.0%) |
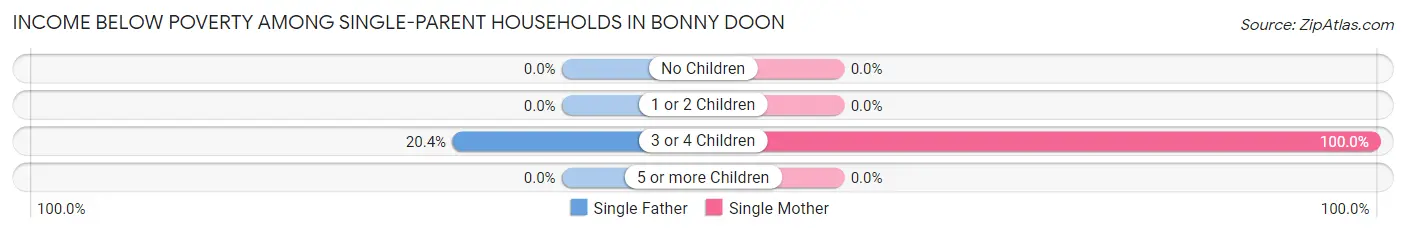
Income Below Poverty Among Single-Parent Households in Bonny Doon
According to the poverty data in Bonny Doon, 10.4% or 10 single-father households and 5.1% or 5 single-mother households are living below the poverty line. Among single-father households, those with 3 or 4 children have the highest poverty rate, with 10 households (20.4%) experiencing poverty. Likewise, among single-mother households, those with 3 or 4 children have the highest poverty rate, with 5 households (100.0%) falling below the poverty line.
| Children | Single Father | Single Mother |
| No Children | 0 (0.0%) | 0 (0.0%) |
| 1 or 2 Children | 0 (0.0%) | 0 (0.0%) |
| 3 or 4 Children | 10 (20.4%) | 5 (100.0%) |
| 5 or more Children | 0 (0.0%) | 0 (0.0%) |
| Total | 10 (10.4%) | 5 (5.1%) |
Income Below Poverty Among Married-Couple vs Single-Parent Households in Bonny Doon
The poverty data for Bonny Doon shows that 16 of the married-couple family households (3.0%) and 15 of the single-parent households (7.7%) are living below the poverty level. Within the married-couple family households, those with 1 or 2 children have the highest poverty rate, with 10 households (6.2%) falling below the poverty line. Among the single-parent households, those with 3 or 4 children have the highest poverty rate, with 15 household (27.8%) living below poverty.
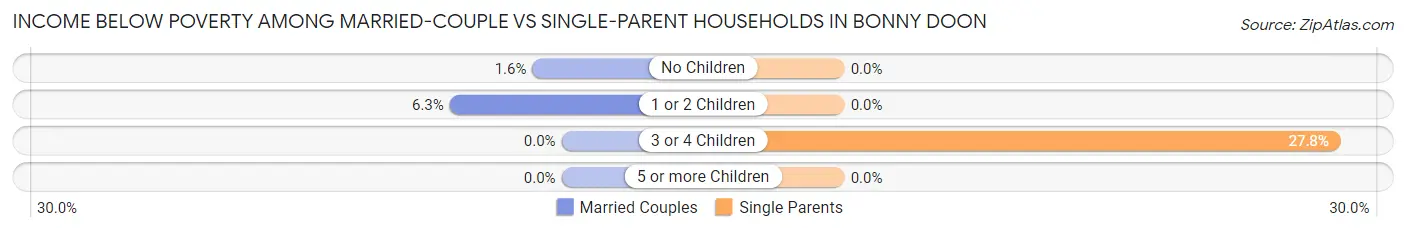
| Children | Married-Couple Families | Single-Parent Households |
| No Children | 6 (1.6%) | 0 (0.0%) |
| 1 or 2 Children | 10 (6.2%) | 0 (0.0%) |
| 3 or 4 Children | 0 (0.0%) | 15 (27.8%) |
| 5 or more Children | 0 (0.0%) | 0 (0.0%) |
| Total | 16 (3.0%) | 15 (7.7%) |
Employment Characteristics in Bonny Doon
Employment by Class of Employer in Bonny Doon
Among the 1,285 employed individuals in Bonny Doon, private company employees (708 | 55.1%), self-employed (not incorporated) (192 | 14.9%), and local government employees (117 | 9.1%) make up the most common classes of employment.
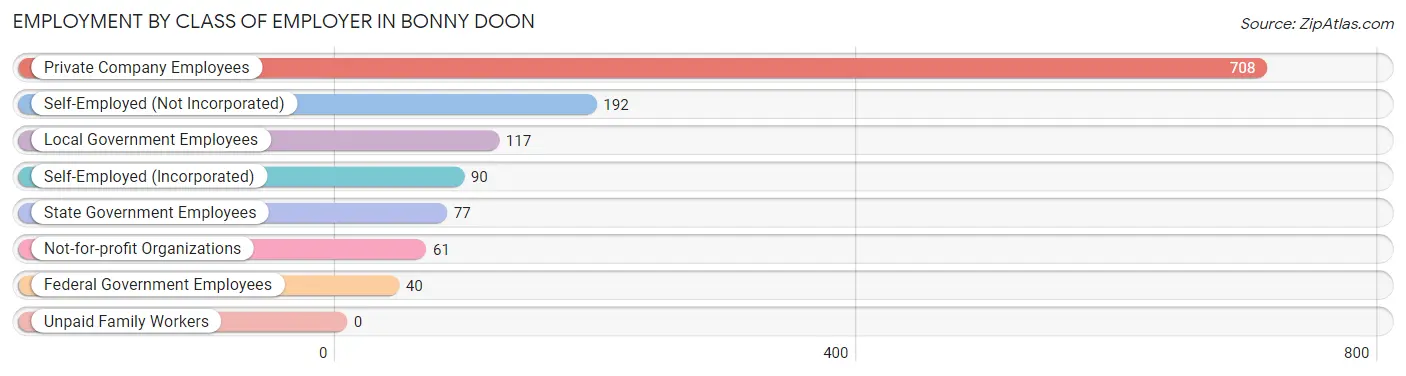
| Employer Class | # Employees | % Employees |
| Private Company Employees | 708 | 55.1% |
| Self-Employed (Incorporated) | 90 | 7.0% |
| Self-Employed (Not Incorporated) | 192 | 14.9% |
| Not-for-profit Organizations | 61 | 4.8% |
| Local Government Employees | 117 | 9.1% |
| State Government Employees | 77 | 6.0% |
| Federal Government Employees | 40 | 3.1% |
| Unpaid Family Workers | 0 | 0.0% |
| Total | 1,285 | 100.0% |
Employment Status by Age in Bonny Doon
According to the labor force statistics for Bonny Doon, out of the total population over 16 years of age (2,476), 55.1% or 1,364 individuals are in the labor force, with 3.7% or 50 of them unemployed. The age group with the highest labor force participation rate is 35 to 44 years, with 90.8% or 208 individuals in the labor force. Within the labor force, the 30 to 34 years age range has the highest percentage of unemployed individuals, with 14.1% or 26 of them being unemployed.
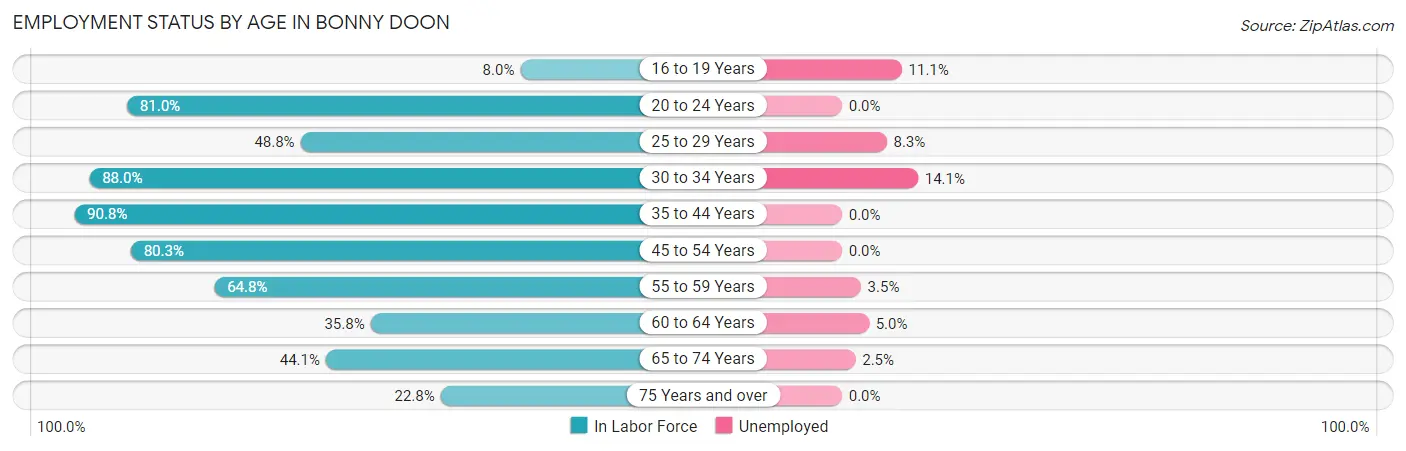
| Age Bracket | In Labor Force | Unemployed |
| 16 to 19 Years | 18 (8.0%) | 2 (11.1%) |
| 20 to 24 Years | 102 (81.0%) | 0 (0.0%) |
| 25 to 29 Years | 84 (48.8%) | 7 (8.3%) |
| 30 to 34 Years | 184 (88.0%) | 26 (14.1%) |
| 35 to 44 Years | 208 (90.8%) | 0 (0.0%) |
| 45 to 54 Years | 249 (80.3%) | 0 (0.0%) |
| 55 to 59 Years | 142 (64.8%) | 5 (3.5%) |
| 60 to 64 Years | 100 (35.8%) | 5 (5.0%) |
| 65 to 74 Years | 242 (44.1%) | 6 (2.5%) |
| 75 Years and over | 36 (22.8%) | 0 (0.0%) |
| Total | 1,364 (55.1%) | 50 (3.7%) |
Employment Status by Educational Attainment in Bonny Doon
According to labor force statistics for Bonny Doon, 68.2% of individuals (967) out of the total population between 25 and 64 years of age (1,418) are in the labor force, with 4.4% or 43 of them being unemployed. The group with the highest labor force participation rate are those with the educational attainment of less than high school, with 85.7% or 12 individuals in the labor force. Within the labor force, individuals with college / associate degree education have the highest percentage of unemployment, with 8.7% or 26 of them being unemployed.
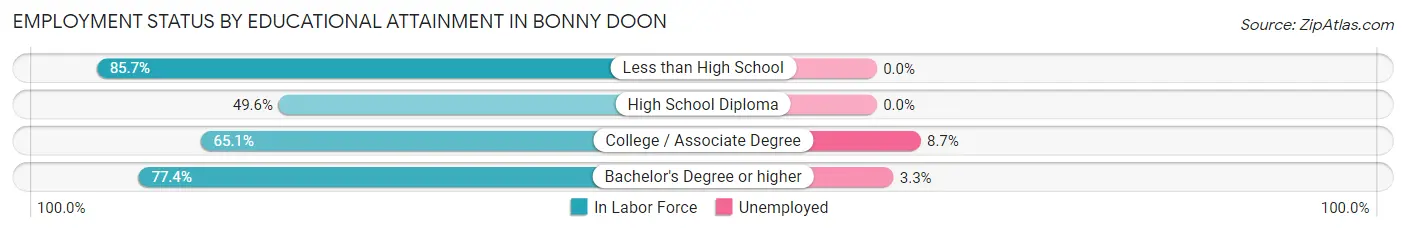
| Educational Attainment | In Labor Force | Unemployed |
| Less than High School | 12 (85.7%) | 0 (0.0%) |
| High School Diploma | 134 (49.6%) | 0 (0.0%) |
| College / Associate Degree | 298 (65.1%) | 40 (8.7%) |
| Bachelor's Degree or higher | 523 (77.4%) | 22 (3.3%) |
| Total | 967 (68.2%) | 62 (4.4%) |
Employment Occupations by Sex in Bonny Doon
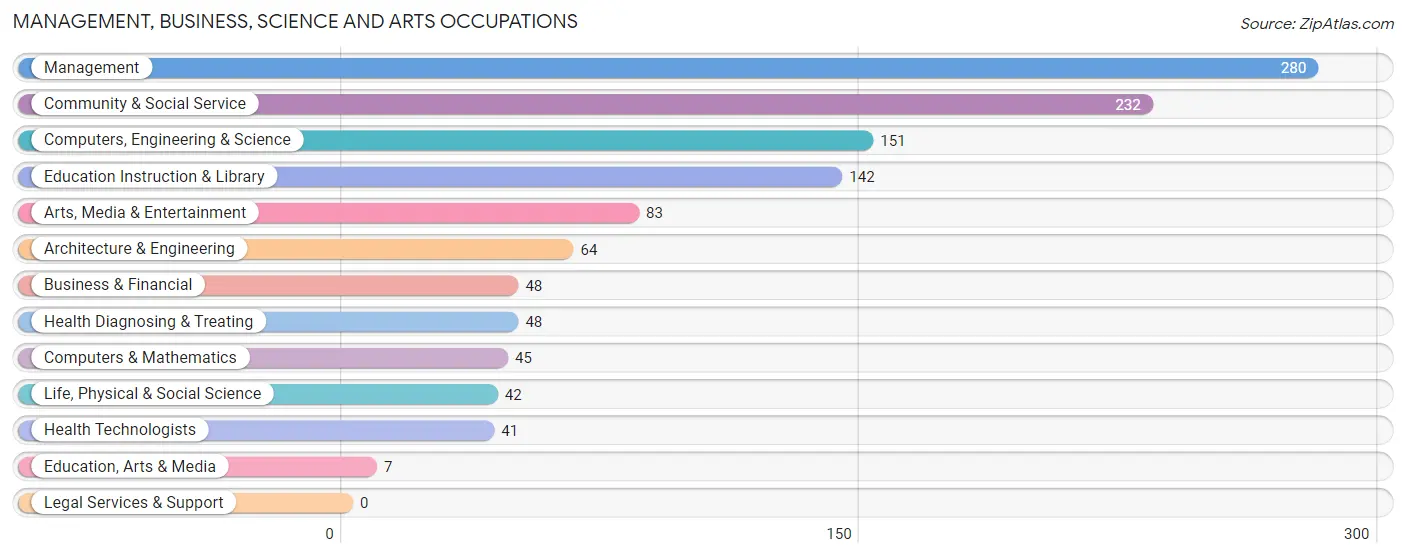
Management, Business, Science and Arts Occupations
The most common Management, Business, Science and Arts occupations in Bonny Doon are Management (280 | 21.3%), Community & Social Service (232 | 17.7%), Computers, Engineering & Science (151 | 11.5%), Education Instruction & Library (142 | 10.8%), and Arts, Media & Entertainment (83 | 6.3%).
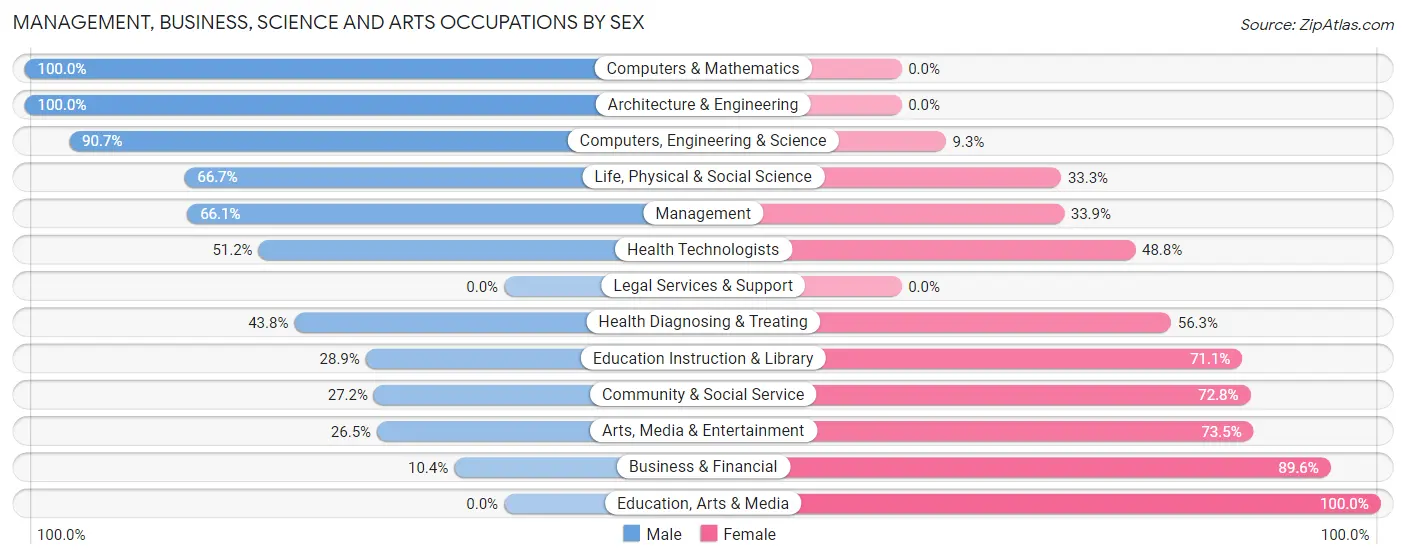
Management, Business, Science and Arts Occupations by Sex
Within the Management, Business, Science and Arts occupations in Bonny Doon, the most male-oriented occupations are Computers & Mathematics (100.0%), Architecture & Engineering (100.0%), and Computers, Engineering & Science (90.7%), while the most female-oriented occupations are Education, Arts & Media (100.0%), Business & Financial (89.6%), and Arts, Media & Entertainment (73.5%).
| Occupation | Male | Female |
| Management | 185 (66.1%) | 95 (33.9%) |
| Business & Financial | 5 (10.4%) | 43 (89.6%) |
| Computers, Engineering & Science | 137 (90.7%) | 14 (9.3%) |
| Computers & Mathematics | 45 (100.0%) | 0 (0.0%) |
| Architecture & Engineering | 64 (100.0%) | 0 (0.0%) |
| Life, Physical & Social Science | 28 (66.7%) | 14 (33.3%) |
| Community & Social Service | 63 (27.2%) | 169 (72.8%) |
| Education, Arts & Media | 0 (0.0%) | 7 (100.0%) |
| Legal Services & Support | 0 (0.0%) | 0 (0.0%) |
| Education Instruction & Library | 41 (28.9%) | 101 (71.1%) |
| Arts, Media & Entertainment | 22 (26.5%) | 61 (73.5%) |
| Health Diagnosing & Treating | 21 (43.8%) | 27 (56.2%) |
| Health Technologists | 21 (51.2%) | 20 (48.8%) |
| Total (Category) | 411 (54.1%) | 348 (45.9%) |
| Total (Overall) | 709 (54.0%) | 605 (46.0%) |
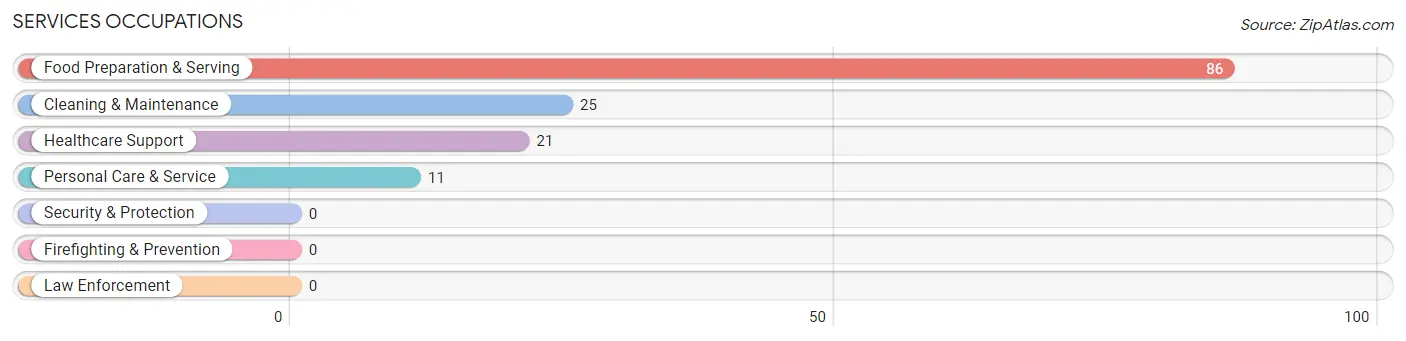
Services Occupations
The most common Services occupations in Bonny Doon are Food Preparation & Serving (86 | 6.5%), Cleaning & Maintenance (25 | 1.9%), Healthcare Support (21 | 1.6%), and Personal Care & Service (11 | 0.8%).
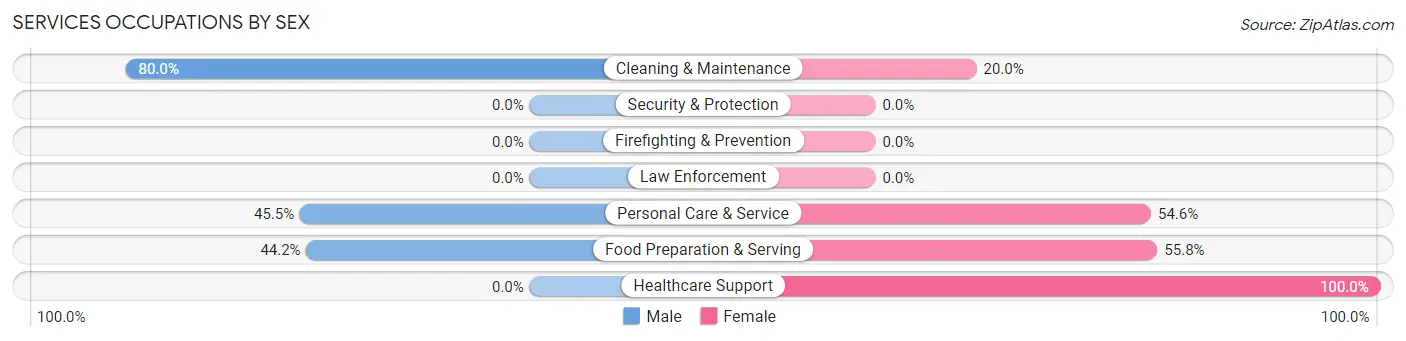
Services Occupations by Sex
Within the Services occupations in Bonny Doon, the most male-oriented occupations are Cleaning & Maintenance (80.0%), Personal Care & Service (45.5%), and Food Preparation & Serving (44.2%), while the most female-oriented occupations are Healthcare Support (100.0%), Food Preparation & Serving (55.8%), and Personal Care & Service (54.5%).
| Occupation | Male | Female |
| Healthcare Support | 0 (0.0%) | 21 (100.0%) |
| Security & Protection | 0 (0.0%) | 0 (0.0%) |
| Firefighting & Prevention | 0 (0.0%) | 0 (0.0%) |
| Law Enforcement | 0 (0.0%) | 0 (0.0%) |
| Food Preparation & Serving | 38 (44.2%) | 48 (55.8%) |
| Cleaning & Maintenance | 20 (80.0%) | 5 (20.0%) |
| Personal Care & Service | 5 (45.5%) | 6 (54.5%) |
| Total (Category) | 63 (44.1%) | 80 (55.9%) |
| Total (Overall) | 709 (54.0%) | 605 (46.0%) |
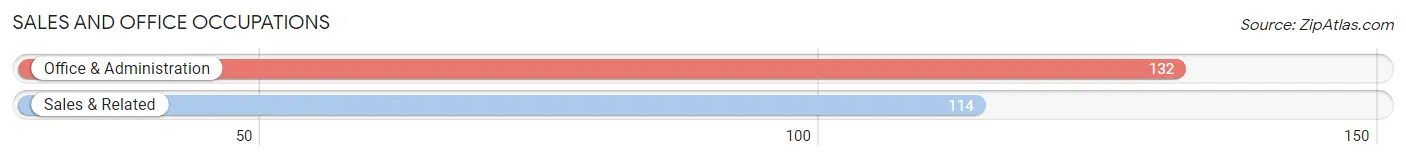
Sales and Office Occupations
The most common Sales and Office occupations in Bonny Doon are Office & Administration (132 | 10.1%), and Sales & Related (114 | 8.7%).
Sales and Office Occupations by Sex
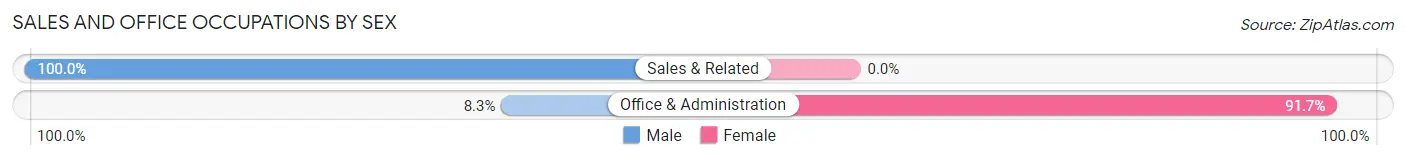
| Occupation | Male | Female |
| Sales & Related | 114 (100.0%) | 0 (0.0%) |
| Office & Administration | 11 (8.3%) | 121 (91.7%) |
| Total (Category) | 125 (50.8%) | 121 (49.2%) |
| Total (Overall) | 709 (54.0%) | 605 (46.0%) |
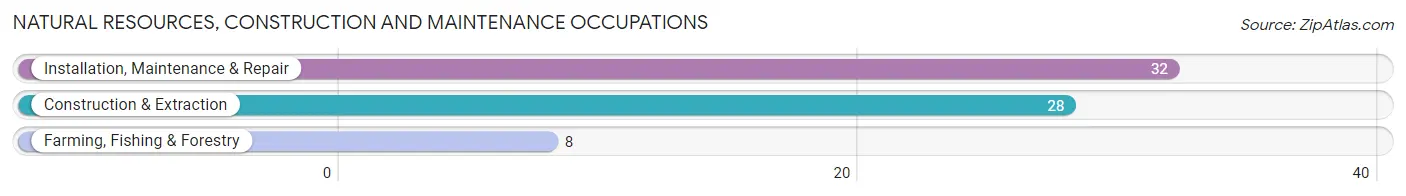
Natural Resources, Construction and Maintenance Occupations
The most common Natural Resources, Construction and Maintenance occupations in Bonny Doon are Installation, Maintenance & Repair (32 | 2.4%), Construction & Extraction (28 | 2.1%), and Farming, Fishing & Forestry (8 | 0.6%).
Natural Resources, Construction and Maintenance Occupations by Sex
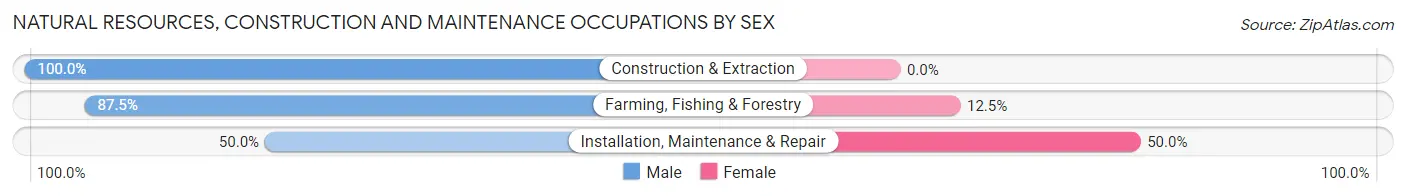
| Occupation | Male | Female |
| Farming, Fishing & Forestry | 7 (87.5%) | 1 (12.5%) |
| Construction & Extraction | 28 (100.0%) | 0 (0.0%) |
| Installation, Maintenance & Repair | 16 (50.0%) | 16 (50.0%) |
| Total (Category) | 51 (75.0%) | 17 (25.0%) |
| Total (Overall) | 709 (54.0%) | 605 (46.0%) |
Production, Transportation and Moving Occupations
The most common Production, Transportation and Moving occupations in Bonny Doon are Production (48 | 3.6%), Transportation (30 | 2.3%), and Material Moving (20 | 1.5%).
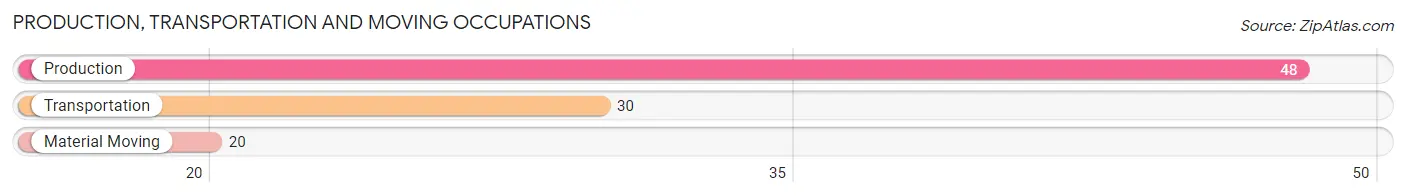
Production, Transportation and Moving Occupations by Sex
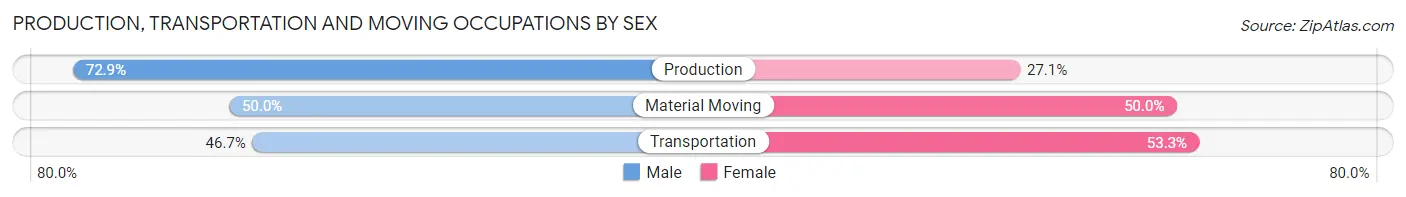
| Occupation | Male | Female |
| Production | 35 (72.9%) | 13 (27.1%) |
| Transportation | 14 (46.7%) | 16 (53.3%) |
| Material Moving | 10 (50.0%) | 10 (50.0%) |
| Total (Category) | 59 (60.2%) | 39 (39.8%) |
| Total (Overall) | 709 (54.0%) | 605 (46.0%) |
Employment Industries by Sex in Bonny Doon
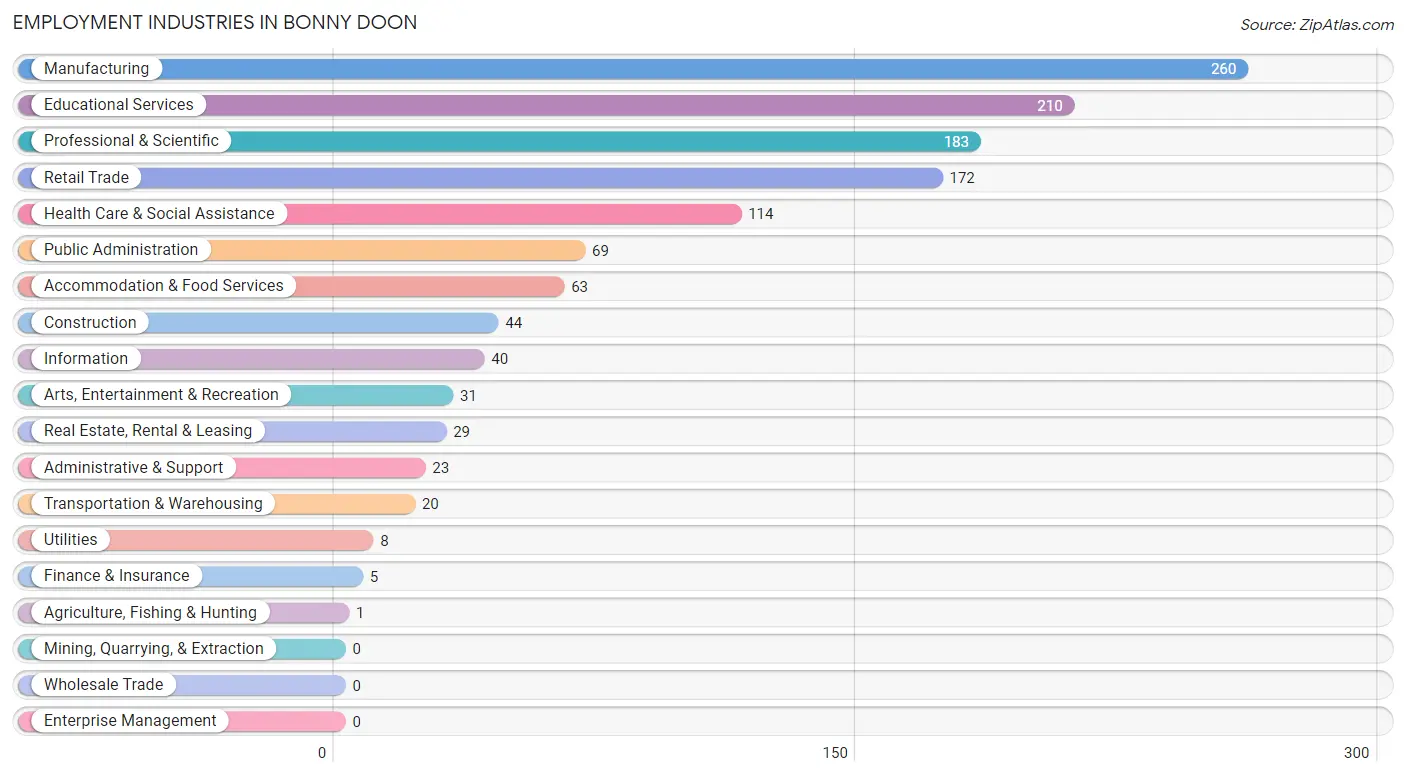
Employment Industries in Bonny Doon
The major employment industries in Bonny Doon include Manufacturing (260 | 19.8%), Educational Services (210 | 16.0%), Professional & Scientific (183 | 13.9%), Retail Trade (172 | 13.1%), and Health Care & Social Assistance (114 | 8.7%).
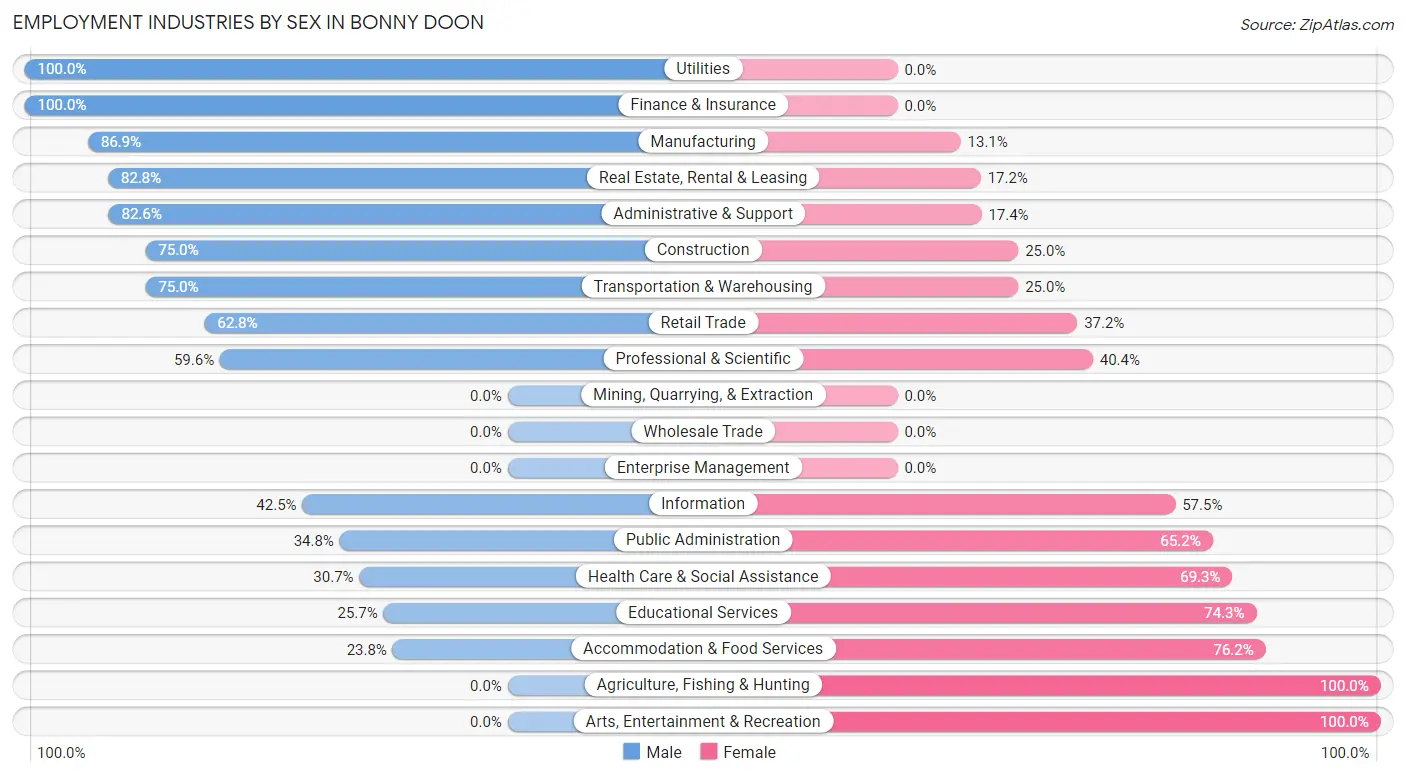
Employment Industries by Sex in Bonny Doon
The Bonny Doon industries that see more men than women are Utilities (100.0%), Finance & Insurance (100.0%), and Manufacturing (86.9%), whereas the industries that tend to have a higher number of women are Agriculture, Fishing & Hunting (100.0%), Arts, Entertainment & Recreation (100.0%), and Accommodation & Food Services (76.2%).
| Industry | Male | Female |
| Agriculture, Fishing & Hunting | 0 (0.0%) | 1 (100.0%) |
| Mining, Quarrying, & Extraction | 0 (0.0%) | 0 (0.0%) |
| Construction | 33 (75.0%) | 11 (25.0%) |
| Manufacturing | 226 (86.9%) | 34 (13.1%) |
| Wholesale Trade | 0 (0.0%) | 0 (0.0%) |
| Retail Trade | 108 (62.8%) | 64 (37.2%) |
| Transportation & Warehousing | 15 (75.0%) | 5 (25.0%) |
| Utilities | 8 (100.0%) | 0 (0.0%) |
| Information | 17 (42.5%) | 23 (57.5%) |
| Finance & Insurance | 5 (100.0%) | 0 (0.0%) |
| Real Estate, Rental & Leasing | 24 (82.8%) | 5 (17.2%) |
| Professional & Scientific | 109 (59.6%) | 74 (40.4%) |
| Enterprise Management | 0 (0.0%) | 0 (0.0%) |
| Administrative & Support | 19 (82.6%) | 4 (17.4%) |
| Educational Services | 54 (25.7%) | 156 (74.3%) |
| Health Care & Social Assistance | 35 (30.7%) | 79 (69.3%) |
| Arts, Entertainment & Recreation | 0 (0.0%) | 31 (100.0%) |
| Accommodation & Food Services | 15 (23.8%) | 48 (76.2%) |
| Public Administration | 24 (34.8%) | 45 (65.2%) |
| Total | 709 (54.0%) | 605 (46.0%) |
Education in Bonny Doon
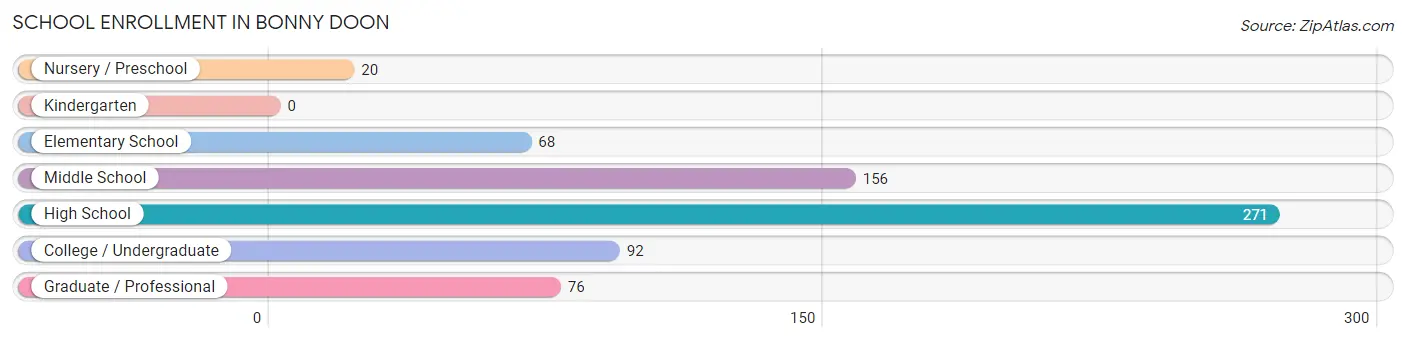
School Enrollment in Bonny Doon
The most common levels of schooling among the 683 students in Bonny Doon are high school (271 | 39.7%), middle school (156 | 22.8%), and college / undergraduate (92 | 13.5%).
| School Level | # Students | % Students |
| Nursery / Preschool | 20 | 2.9% |
| Kindergarten | 0 | 0.0% |
| Elementary School | 68 | 10.0% |
| Middle School | 156 | 22.8% |
| High School | 271 | 39.7% |
| College / Undergraduate | 92 | 13.5% |
| Graduate / Professional | 76 | 11.1% |
| Total | 683 | 100.0% |
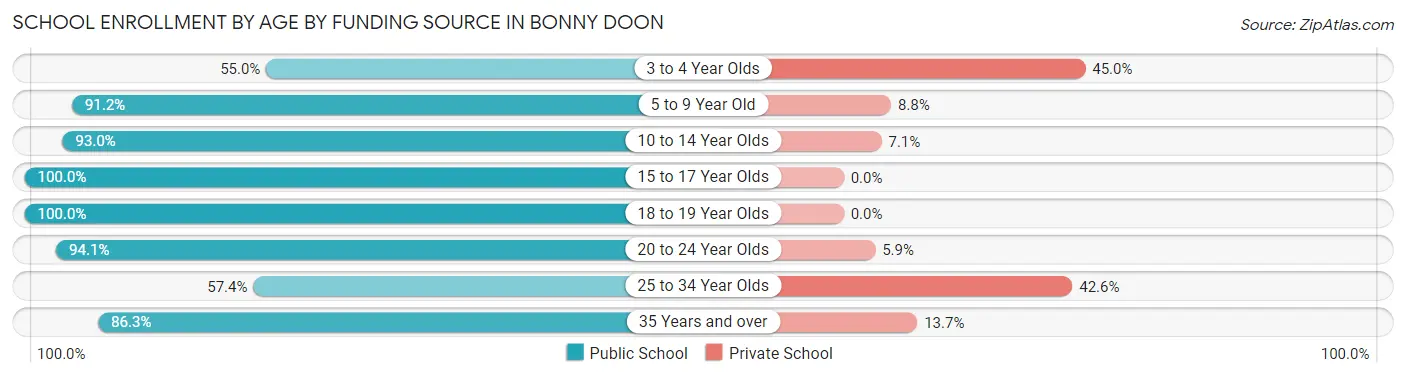
School Enrollment by Age by Funding Source in Bonny Doon
Out of a total of 683 students who are enrolled in schools in Bonny Doon, 63 (9.2%) attend a private institution, while the remaining 620 (90.8%) are enrolled in public schools. The age group of 3 to 4 year olds has the highest likelihood of being enrolled in private schools, with 9 (45.0% in the age bracket) enrolled. Conversely, the age group of 15 to 17 year olds has the lowest likelihood of being enrolled in a private school, with 136 (100.0% in the age bracket) attending a public institution.
| Age Bracket | Public School | Private School |
| 3 to 4 Year Olds | 11 (55.0%) | 9 (45.0%) |
| 5 to 9 Year Old | 31 (91.2%) | 3 (8.8%) |
| 10 to 14 Year Olds | 224 (92.9%) | 17 (7.0%) |
| 15 to 17 Year Olds | 136 (100.0%) | 0 (0.0%) |
| 18 to 19 Year Olds | 108 (100.0%) | 0 (0.0%) |
| 20 to 24 Year Olds | 16 (94.1%) | 1 (5.9%) |
| 25 to 34 Year Olds | 31 (57.4%) | 23 (42.6%) |
| 35 Years and over | 63 (86.3%) | 10 (13.7%) |
| Total | 620 (90.8%) | 63 (9.2%) |
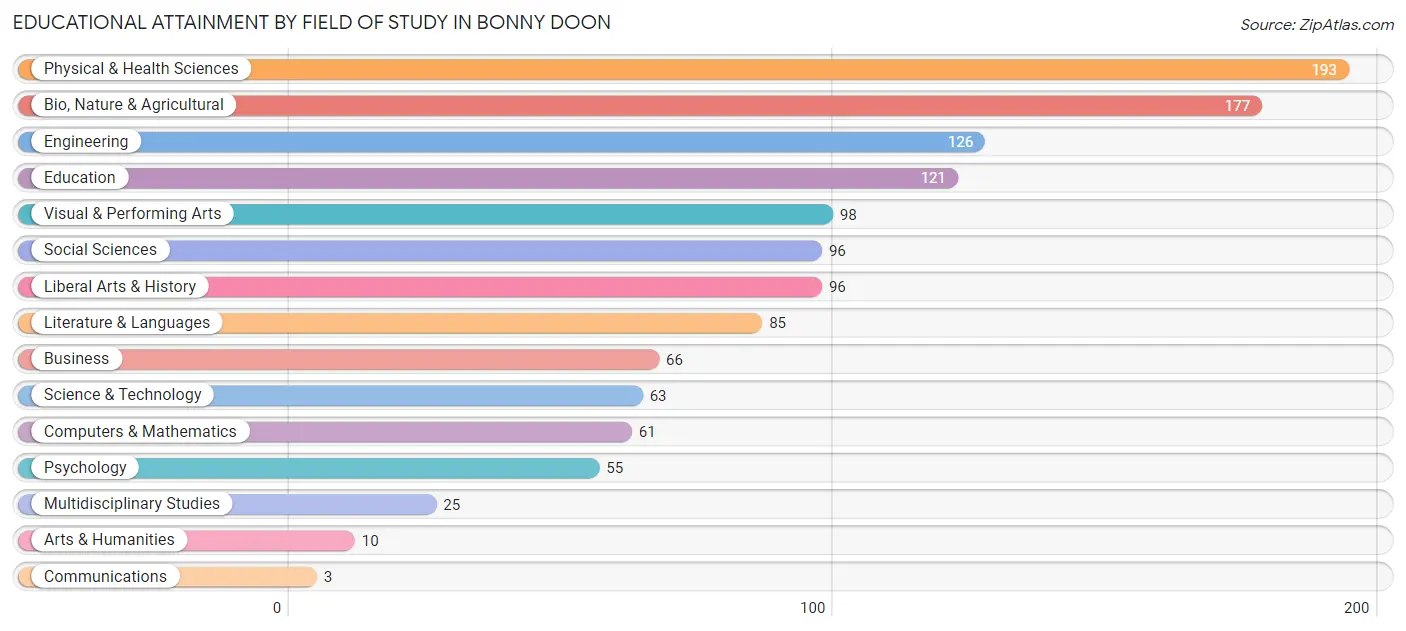
Educational Attainment by Field of Study in Bonny Doon
Physical & health sciences (193 | 15.1%), bio, nature & agricultural (177 | 13.9%), engineering (126 | 9.9%), education (121 | 9.5%), and visual & performing arts (98 | 7.7%) are the most common fields of study among 1,275 individuals in Bonny Doon who have obtained a bachelor's degree or higher.
| Field of Study | # Graduates | % Graduates |
| Computers & Mathematics | 61 | 4.8% |
| Bio, Nature & Agricultural | 177 | 13.9% |
| Physical & Health Sciences | 193 | 15.1% |
| Psychology | 55 | 4.3% |
| Social Sciences | 96 | 7.5% |
| Engineering | 126 | 9.9% |
| Multidisciplinary Studies | 25 | 2.0% |
| Science & Technology | 63 | 4.9% |
| Business | 66 | 5.2% |
| Education | 121 | 9.5% |
| Literature & Languages | 85 | 6.7% |
| Liberal Arts & History | 96 | 7.5% |
| Visual & Performing Arts | 98 | 7.7% |
| Communications | 3 | 0.2% |
| Arts & Humanities | 10 | 0.8% |
| Total | 1,275 | 100.0% |
Transportation & Commute in Bonny Doon
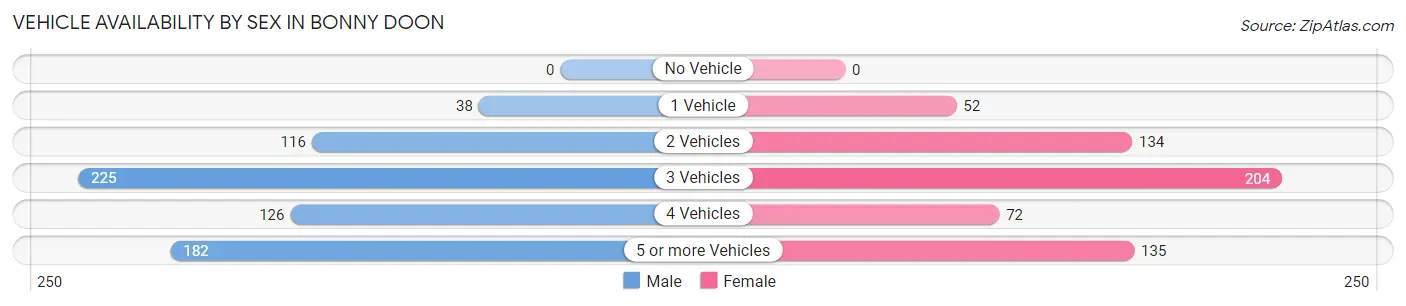
Vehicle Availability by Sex in Bonny Doon
The most prevalent vehicle ownership categories in Bonny Doon are males with 3 vehicles (225, accounting for 32.8%) and females with 3 vehicles (204, making up 37.7%).
| Vehicles Available | Male | Female |
| No Vehicle | 0 (0.0%) | 0 (0.0%) |
| 1 Vehicle | 38 (5.5%) | 52 (8.7%) |
| 2 Vehicles | 116 (16.9%) | 134 (22.5%) |
| 3 Vehicles | 225 (32.8%) | 204 (34.2%) |
| 4 Vehicles | 126 (18.3%) | 72 (12.1%) |
| 5 or more Vehicles | 182 (26.5%) | 135 (22.6%) |
| Total | 687 (100.0%) | 597 (100.0%) |
Commute Time in Bonny Doon
The most frequently occuring commute durations in Bonny Doon are 25 to 29 minutes (165 commuters, 16.9%), 30 to 34 minutes (148 commuters, 15.1%), and 20 to 24 minutes (135 commuters, 13.8%).
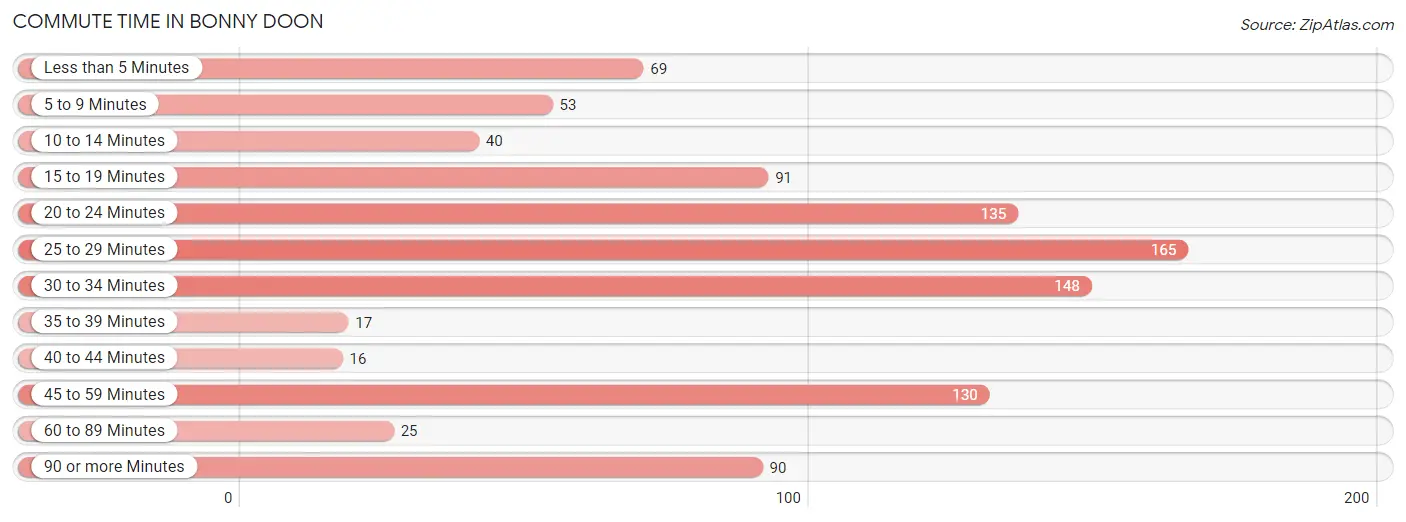
| Commute Time | # Commuters | % Commuters |
| Less than 5 Minutes | 69 | 7.0% |
| 5 to 9 Minutes | 53 | 5.4% |
| 10 to 14 Minutes | 40 | 4.1% |
| 15 to 19 Minutes | 91 | 9.3% |
| 20 to 24 Minutes | 135 | 13.8% |
| 25 to 29 Minutes | 165 | 16.9% |
| 30 to 34 Minutes | 148 | 15.1% |
| 35 to 39 Minutes | 17 | 1.7% |
| 40 to 44 Minutes | 16 | 1.6% |
| 45 to 59 Minutes | 130 | 13.3% |
| 60 to 89 Minutes | 25 | 2.5% |
| 90 or more Minutes | 90 | 9.2% |
Commute Time by Sex in Bonny Doon
The most common commute times in Bonny Doon are 30 to 34 minutes (89 commuters, 16.7%) for males and 25 to 29 minutes (112 commuters, 25.2%) for females.
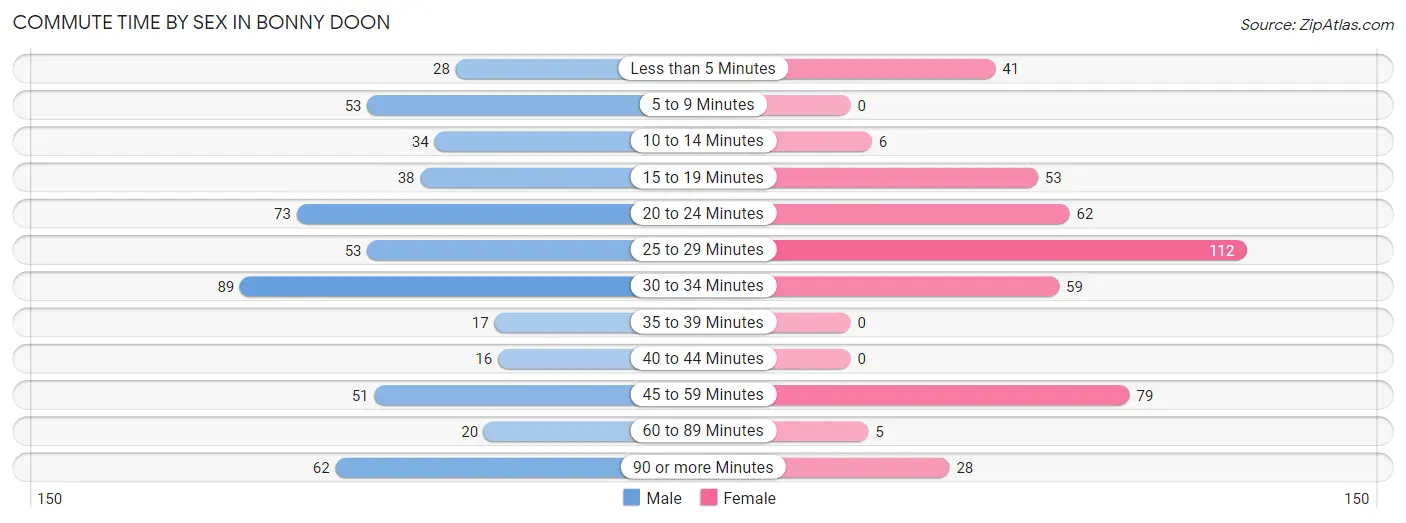
| Commute Time | Male | Female |
| Less than 5 Minutes | 28 (5.2%) | 41 (9.2%) |
| 5 to 9 Minutes | 53 (9.9%) | 0 (0.0%) |
| 10 to 14 Minutes | 34 (6.4%) | 6 (1.3%) |
| 15 to 19 Minutes | 38 (7.1%) | 53 (11.9%) |
| 20 to 24 Minutes | 73 (13.7%) | 62 (13.9%) |
| 25 to 29 Minutes | 53 (9.9%) | 112 (25.2%) |
| 30 to 34 Minutes | 89 (16.7%) | 59 (13.3%) |
| 35 to 39 Minutes | 17 (3.2%) | 0 (0.0%) |
| 40 to 44 Minutes | 16 (3.0%) | 0 (0.0%) |
| 45 to 59 Minutes | 51 (9.6%) | 79 (17.7%) |
| 60 to 89 Minutes | 20 (3.7%) | 5 (1.1%) |
| 90 or more Minutes | 62 (11.6%) | 28 (6.3%) |
Time of Departure to Work by Sex in Bonny Doon
The most frequent times of departure to work in Bonny Doon are 9:00 AM to 9:59 AM (125, 23.4%) for males and 7:00 AM to 7:29 AM (83, 18.6%) for females.
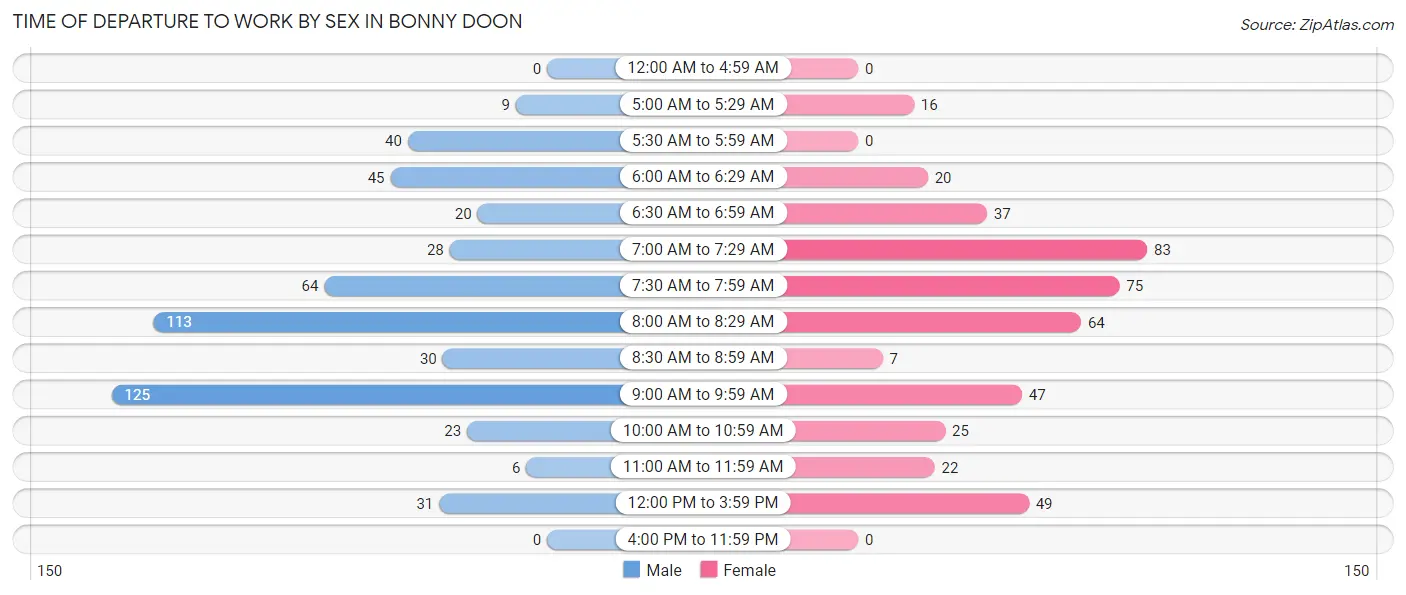
| Time of Departure | Male | Female |
| 12:00 AM to 4:59 AM | 0 (0.0%) | 0 (0.0%) |
| 5:00 AM to 5:29 AM | 9 (1.7%) | 16 (3.6%) |
| 5:30 AM to 5:59 AM | 40 (7.5%) | 0 (0.0%) |
| 6:00 AM to 6:29 AM | 45 (8.4%) | 20 (4.5%) |
| 6:30 AM to 6:59 AM | 20 (3.7%) | 37 (8.3%) |
| 7:00 AM to 7:29 AM | 28 (5.2%) | 83 (18.6%) |
| 7:30 AM to 7:59 AM | 64 (12.0%) | 75 (16.9%) |
| 8:00 AM to 8:29 AM | 113 (21.2%) | 64 (14.4%) |
| 8:30 AM to 8:59 AM | 30 (5.6%) | 7 (1.6%) |
| 9:00 AM to 9:59 AM | 125 (23.4%) | 47 (10.6%) |
| 10:00 AM to 10:59 AM | 23 (4.3%) | 25 (5.6%) |
| 11:00 AM to 11:59 AM | 6 (1.1%) | 22 (4.9%) |
| 12:00 PM to 3:59 PM | 31 (5.8%) | 49 (11.0%) |
| 4:00 PM to 11:59 PM | 0 (0.0%) | 0 (0.0%) |
| Total | 534 (100.0%) | 445 (100.0%) |
Housing Occupancy in Bonny Doon
Occupancy by Ownership in Bonny Doon
Of the total 956 dwellings in Bonny Doon, owner-occupied units account for 776 (81.2%), while renter-occupied units make up 180 (18.8%).
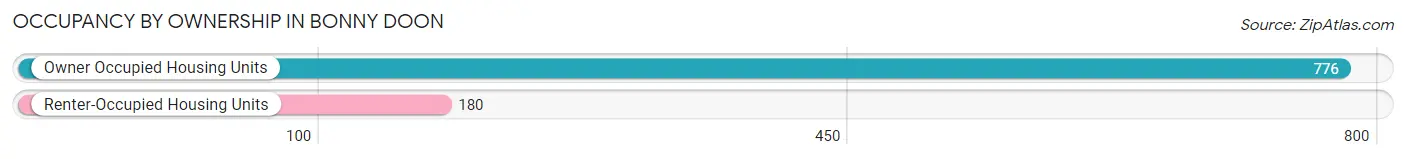
| Occupancy | # Housing Units | % Housing Units |
| Owner Occupied Housing Units | 776 | 81.2% |
| Renter-Occupied Housing Units | 180 | 18.8% |
| Total Occupied Housing Units | 956 | 100.0% |
Occupancy by Household Size in Bonny Doon
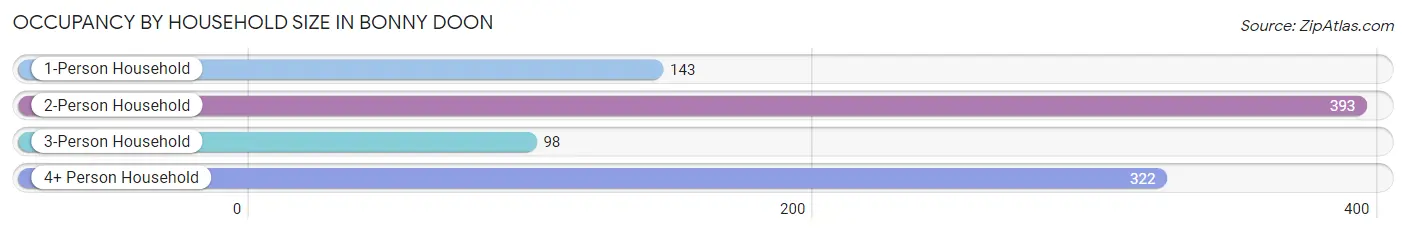
| Household Size | # Housing Units | % Housing Units |
| 1-Person Household | 143 | 15.0% |
| 2-Person Household | 393 | 41.1% |
| 3-Person Household | 98 | 10.2% |
| 4+ Person Household | 322 | 33.7% |
| Total Housing Units | 956 | 100.0% |
Occupancy by Ownership by Household Size in Bonny Doon

| Household Size | Owner-occupied | Renter-occupied |
| 1-Person Household | 118 (82.5%) | 25 (17.5%) |
| 2-Person Household | 293 (74.6%) | 100 (25.5%) |
| 3-Person Household | 91 (92.9%) | 7 (7.1%) |
| 4+ Person Household | 274 (85.1%) | 48 (14.9%) |
| Total Housing Units | 776 (81.2%) | 180 (18.8%) |
Occupancy by Educational Attainment in Bonny Doon
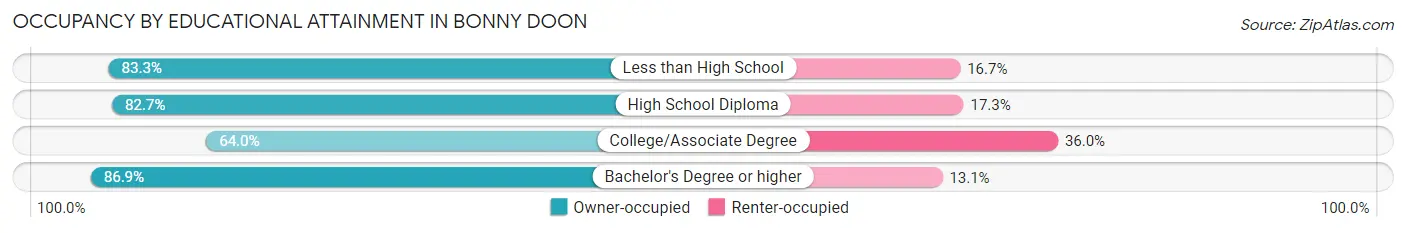
| Household Size | Owner-occupied | Renter-occupied |
| Less than High School | 10 (83.3%) | 2 (16.7%) |
| High School Diploma | 62 (82.7%) | 13 (17.3%) |
| College/Associate Degree | 142 (64.0%) | 80 (36.0%) |
| Bachelor's Degree or higher | 562 (86.9%) | 85 (13.1%) |
Occupancy by Age of Householder in Bonny Doon
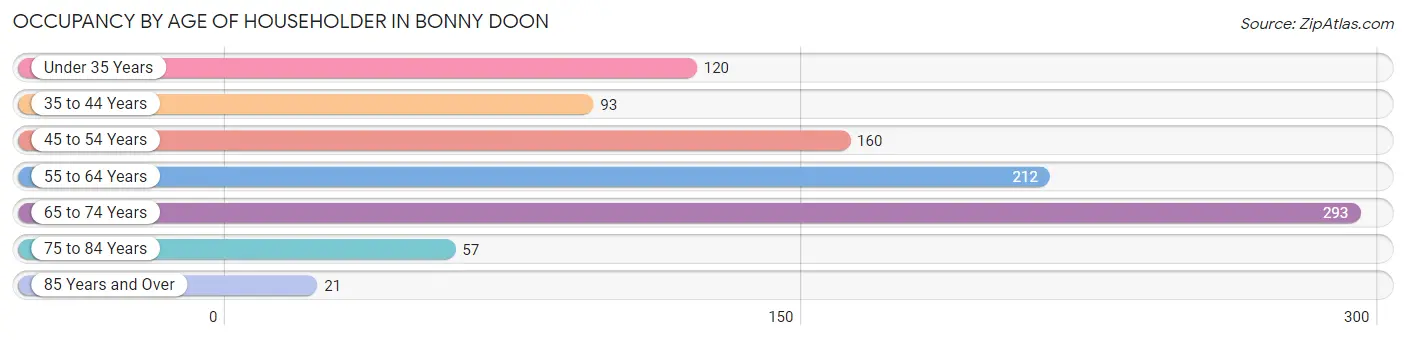
| Age Bracket | # Households | % Households |
| Under 35 Years | 120 | 12.6% |
| 35 to 44 Years | 93 | 9.7% |
| 45 to 54 Years | 160 | 16.7% |
| 55 to 64 Years | 212 | 22.2% |
| 65 to 74 Years | 293 | 30.6% |
| 75 to 84 Years | 57 | 6.0% |
| 85 Years and Over | 21 | 2.2% |
| Total | 956 | 100.0% |
Housing Finances in Bonny Doon
Median Income by Occupancy in Bonny Doon
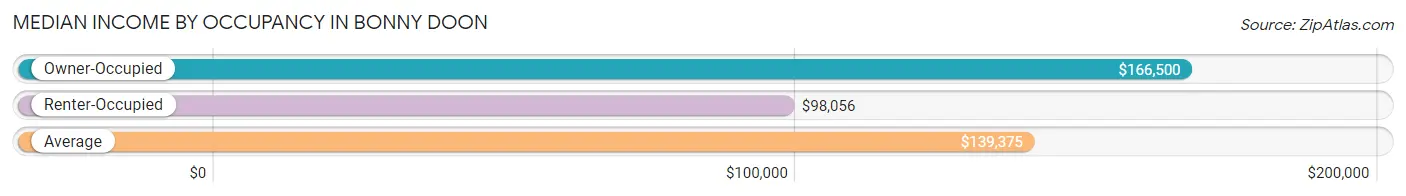
| Occupancy Type | # Households | Median Income |
| Owner-Occupied | 776 (81.2%) | $166,500 |
| Renter-Occupied | 180 (18.8%) | $98,056 |
| Average | 956 (100.0%) | $139,375 |
Occupancy by Householder Income Bracket in Bonny Doon
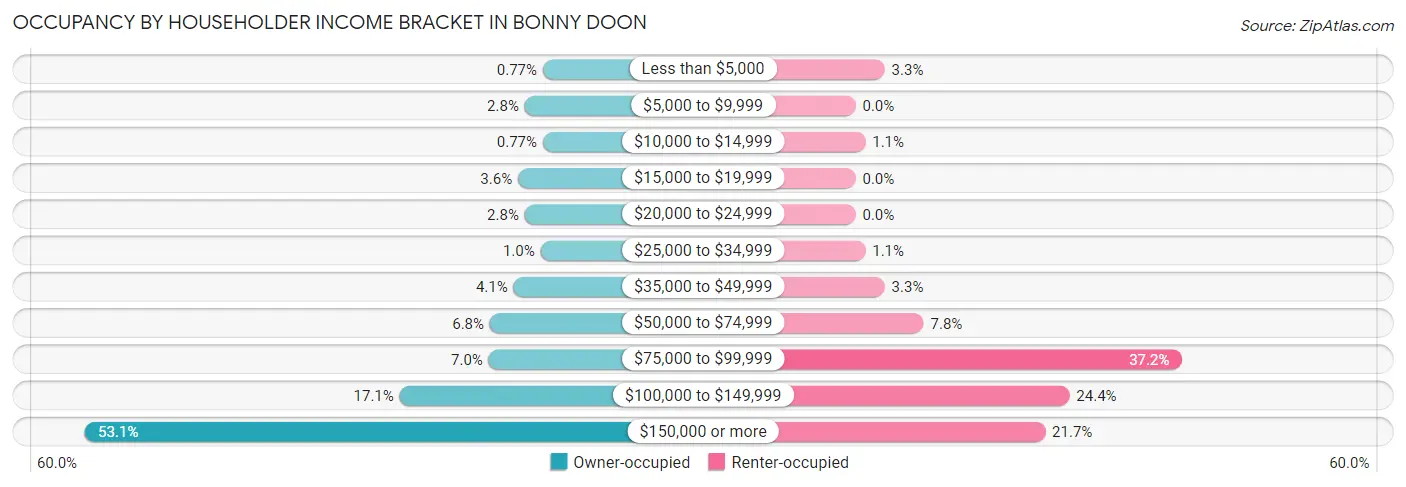
| Income Bracket | Owner-occupied | Renter-occupied |
| Less than $5,000 | 6 (0.8%) | 6 (3.3%) |
| $5,000 to $9,999 | 22 (2.8%) | 0 (0.0%) |
| $10,000 to $14,999 | 6 (0.8%) | 2 (1.1%) |
| $15,000 to $19,999 | 28 (3.6%) | 0 (0.0%) |
| $20,000 to $24,999 | 22 (2.8%) | 0 (0.0%) |
| $25,000 to $34,999 | 8 (1.0%) | 2 (1.1%) |
| $35,000 to $49,999 | 32 (4.1%) | 6 (3.3%) |
| $50,000 to $74,999 | 53 (6.8%) | 14 (7.8%) |
| $75,000 to $99,999 | 54 (7.0%) | 67 (37.2%) |
| $100,000 to $149,999 | 133 (17.1%) | 44 (24.4%) |
| $150,000 or more | 412 (53.1%) | 39 (21.7%) |
| Total | 776 (100.0%) | 180 (100.0%) |
Monthly Housing Cost Tiers in Bonny Doon
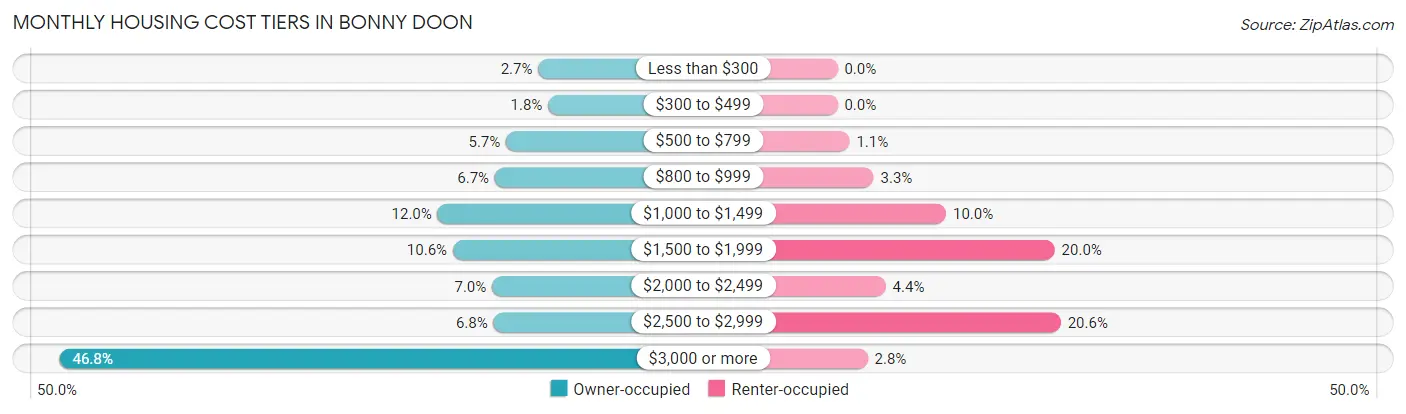
| Monthly Cost | Owner-occupied | Renter-occupied |
| Less than $300 | 21 (2.7%) | 0 (0.0%) |
| $300 to $499 | 14 (1.8%) | 0 (0.0%) |
| $500 to $799 | 44 (5.7%) | 2 (1.1%) |
| $800 to $999 | 52 (6.7%) | 6 (3.3%) |
| $1,000 to $1,499 | 93 (12.0%) | 18 (10.0%) |
| $1,500 to $1,999 | 82 (10.6%) | 36 (20.0%) |
| $2,000 to $2,499 | 54 (7.0%) | 8 (4.4%) |
| $2,500 to $2,999 | 53 (6.8%) | 37 (20.6%) |
| $3,000 or more | 363 (46.8%) | 5 (2.8%) |
| Total | 776 (100.0%) | 180 (100.0%) |
Physical Housing Characteristics in Bonny Doon
Housing Structures in Bonny Doon
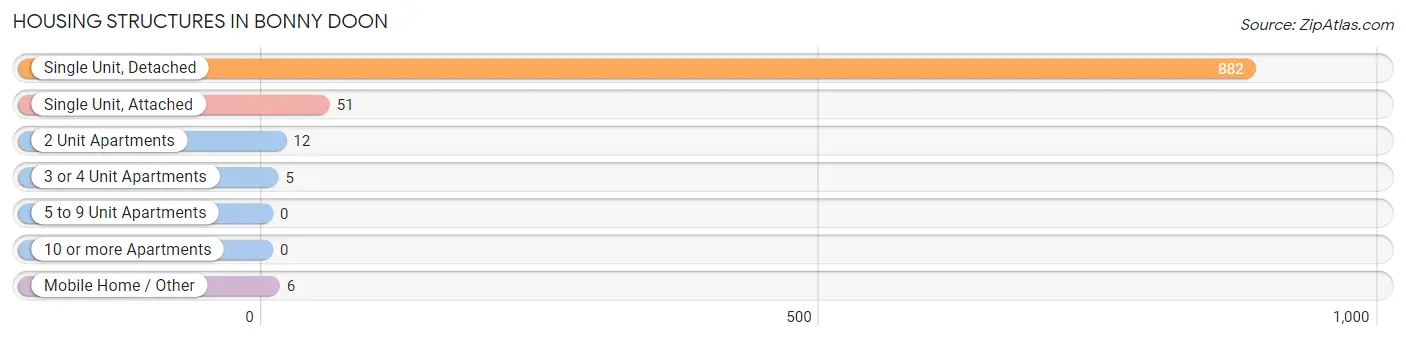
| Structure Type | # Housing Units | % Housing Units |
| Single Unit, Detached | 882 | 92.3% |
| Single Unit, Attached | 51 | 5.3% |
| 2 Unit Apartments | 12 | 1.3% |
| 3 or 4 Unit Apartments | 5 | 0.5% |
| 5 to 9 Unit Apartments | 0 | 0.0% |
| 10 or more Apartments | 0 | 0.0% |
| Mobile Home / Other | 6 | 0.6% |
| Total | 956 | 100.0% |
Housing Structures by Occupancy in Bonny Doon
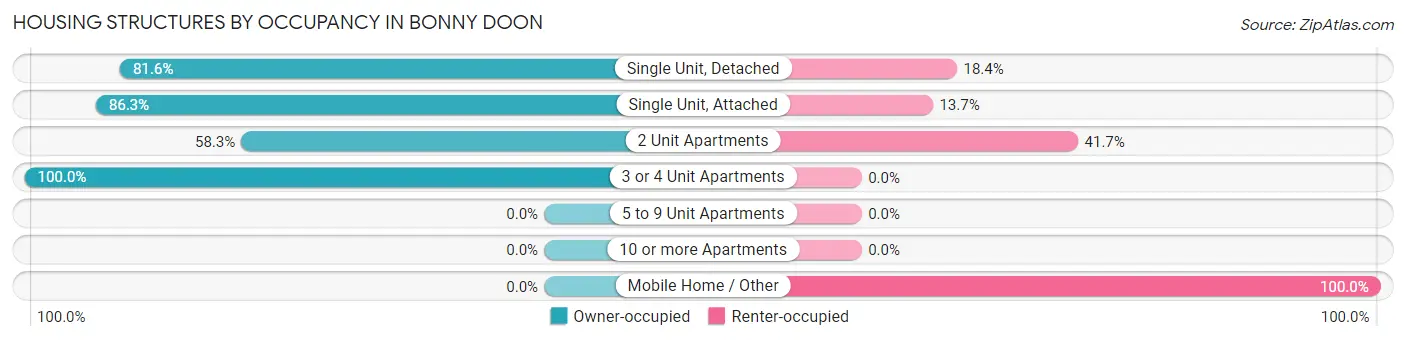
| Structure Type | Owner-occupied | Renter-occupied |
| Single Unit, Detached | 720 (81.6%) | 162 (18.4%) |
| Single Unit, Attached | 44 (86.3%) | 7 (13.7%) |
| 2 Unit Apartments | 7 (58.3%) | 5 (41.7%) |
| 3 or 4 Unit Apartments | 5 (100.0%) | 0 (0.0%) |
| 5 to 9 Unit Apartments | 0 (0.0%) | 0 (0.0%) |
| 10 or more Apartments | 0 (0.0%) | 0 (0.0%) |
| Mobile Home / Other | 0 (0.0%) | 6 (100.0%) |
| Total | 776 (81.2%) | 180 (18.8%) |
Housing Structures by Number of Rooms in Bonny Doon
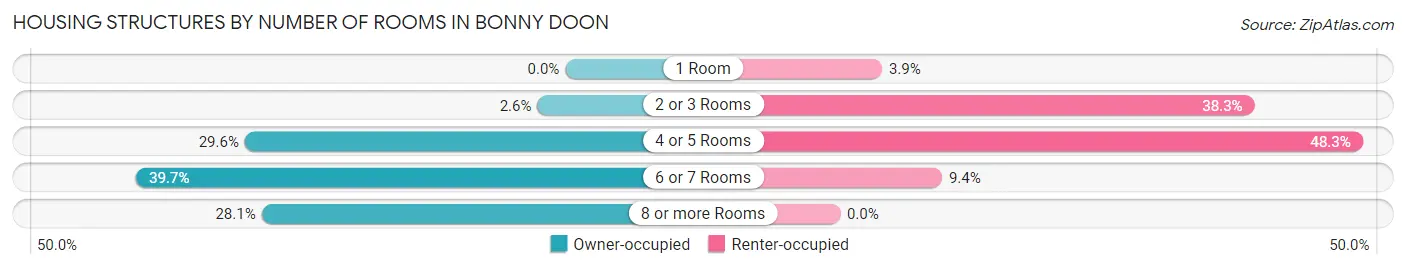
| Number of Rooms | Owner-occupied | Renter-occupied |
| 1 Room | 0 (0.0%) | 7 (3.9%) |
| 2 or 3 Rooms | 20 (2.6%) | 69 (38.3%) |
| 4 or 5 Rooms | 230 (29.6%) | 87 (48.3%) |
| 6 or 7 Rooms | 308 (39.7%) | 17 (9.4%) |
| 8 or more Rooms | 218 (28.1%) | 0 (0.0%) |
| Total | 776 (100.0%) | 180 (100.0%) |
Housing Structure by Heating Type in Bonny Doon
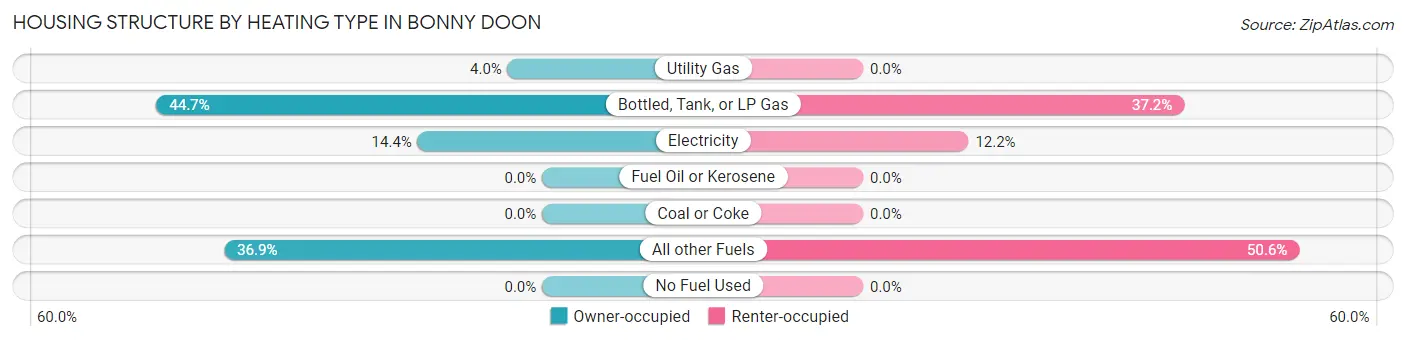
| Heating Type | Owner-occupied | Renter-occupied |
| Utility Gas | 31 (4.0%) | 0 (0.0%) |
| Bottled, Tank, or LP Gas | 347 (44.7%) | 67 (37.2%) |
| Electricity | 112 (14.4%) | 22 (12.2%) |
| Fuel Oil or Kerosene | 0 (0.0%) | 0 (0.0%) |
| Coal or Coke | 0 (0.0%) | 0 (0.0%) |
| All other Fuels | 286 (36.9%) | 91 (50.6%) |
| No Fuel Used | 0 (0.0%) | 0 (0.0%) |
| Total | 776 (100.0%) | 180 (100.0%) |
Household Vehicle Usage in Bonny Doon
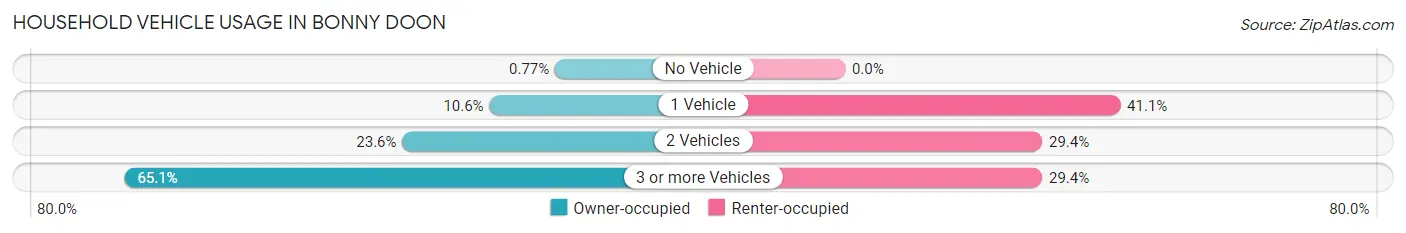
| Vehicles per Household | Owner-occupied | Renter-occupied |
| No Vehicle | 6 (0.8%) | 0 (0.0%) |
| 1 Vehicle | 82 (10.6%) | 74 (41.1%) |
| 2 Vehicles | 183 (23.6%) | 53 (29.4%) |
| 3 or more Vehicles | 505 (65.1%) | 53 (29.4%) |
| Total | 776 (100.0%) | 180 (100.0%) |
Real Estate & Mortgages in Bonny Doon
Real Estate and Mortgage Overview in Bonny Doon
| Characteristic | Without Mortgage | With Mortgage |
| Housing Units | 230 | 546 |
| Median Property Value | $1,164,200 | $1,141,000 |
| Median Household Income | $102,917 | $323 |
| Monthly Housing Costs | $958 | $363 |
| Real Estate Taxes | $4,560 | $0 |
Property Value by Mortgage Status in Bonny Doon
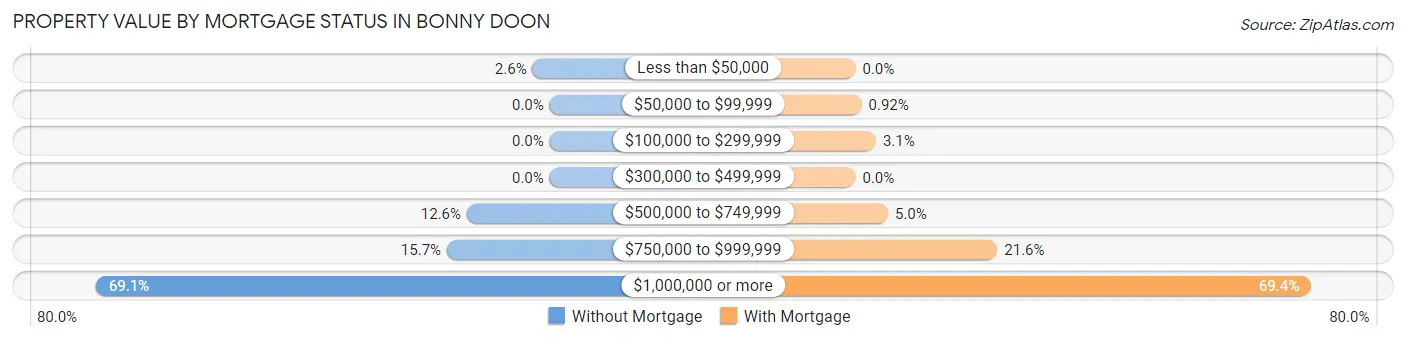
| Property Value | Without Mortgage | With Mortgage |
| Less than $50,000 | 6 (2.6%) | 0 (0.0%) |
| $50,000 to $99,999 | 0 (0.0%) | 5 (0.9%) |
| $100,000 to $299,999 | 0 (0.0%) | 17 (3.1%) |
| $300,000 to $499,999 | 0 (0.0%) | 0 (0.0%) |
| $500,000 to $749,999 | 29 (12.6%) | 27 (5.0%) |
| $750,000 to $999,999 | 36 (15.7%) | 118 (21.6%) |
| $1,000,000 or more | 159 (69.1%) | 379 (69.4%) |
| Total | 230 (100.0%) | 546 (100.0%) |
Household Income by Mortgage Status in Bonny Doon
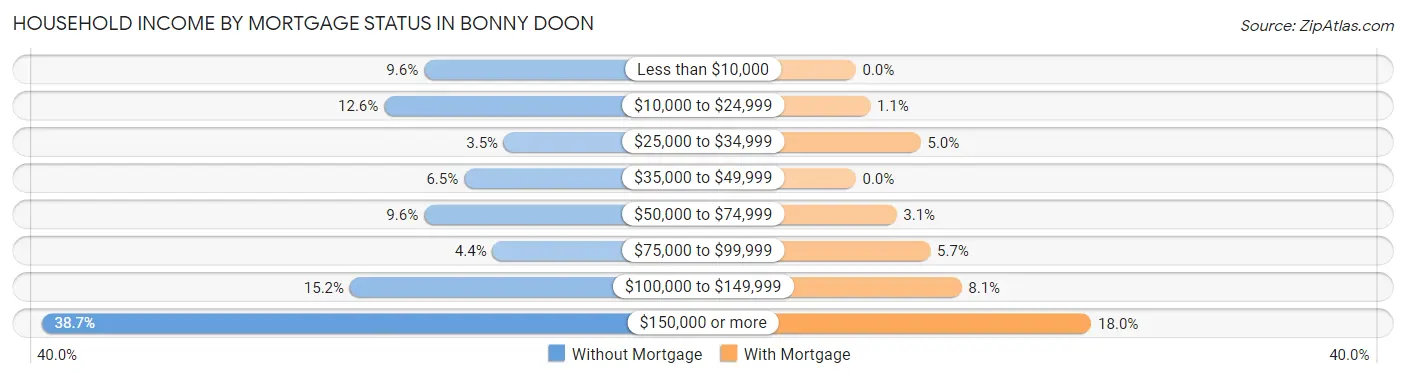
| Household Income | Without Mortgage | With Mortgage |
| Less than $10,000 | 22 (9.6%) | 0 (0.0%) |
| $10,000 to $24,999 | 29 (12.6%) | 6 (1.1%) |
| $25,000 to $34,999 | 8 (3.5%) | 27 (5.0%) |
| $35,000 to $49,999 | 15 (6.5%) | 0 (0.0%) |
| $50,000 to $74,999 | 22 (9.6%) | 17 (3.1%) |
| $75,000 to $99,999 | 10 (4.3%) | 31 (5.7%) |
| $100,000 to $149,999 | 35 (15.2%) | 44 (8.1%) |
| $150,000 or more | 89 (38.7%) | 98 (17.9%) |
| Total | 230 (100.0%) | 546 (100.0%) |
Property Value to Household Income Ratio in Bonny Doon
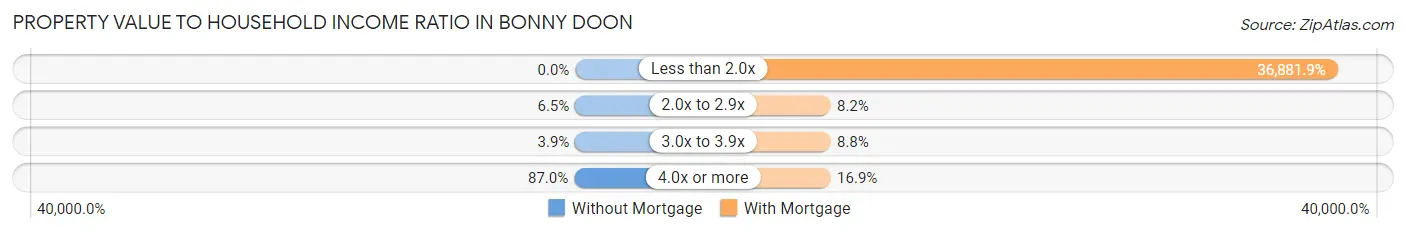
| Value-to-Income Ratio | Without Mortgage | With Mortgage |
| Less than 2.0x | 0 (0.0%) | 201,375 (36,881.9%) |
| 2.0x to 2.9x | 15 (6.5%) | 45 (8.2%) |
| 3.0x to 3.9x | 9 (3.9%) | 48 (8.8%) |
| 4.0x or more | 200 (87.0%) | 92 (16.9%) |
| Total | 230 (100.0%) | 546 (100.0%) |
Real Estate Taxes by Mortgage Status in Bonny Doon
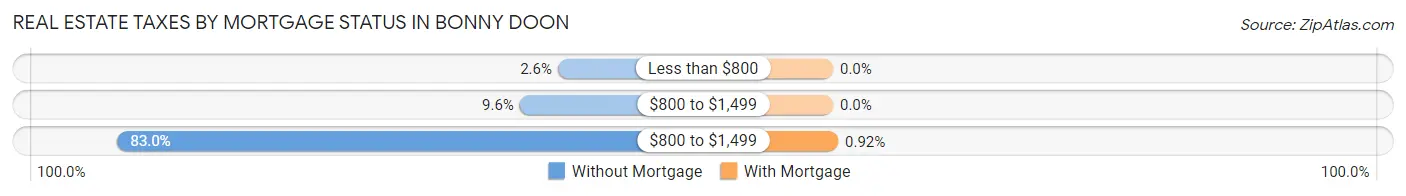
| Property Taxes | Without Mortgage | With Mortgage |
| Less than $800 | 6 (2.6%) | 0 (0.0%) |
| $800 to $1,499 | 22 (9.6%) | 0 (0.0%) |
| $800 to $1,499 | 191 (83.0%) | 5 (0.9%) |
| Total | 230 (100.0%) | 546 (100.0%) |
Health & Disability in Bonny Doon
Health Insurance Coverage by Age in Bonny Doon
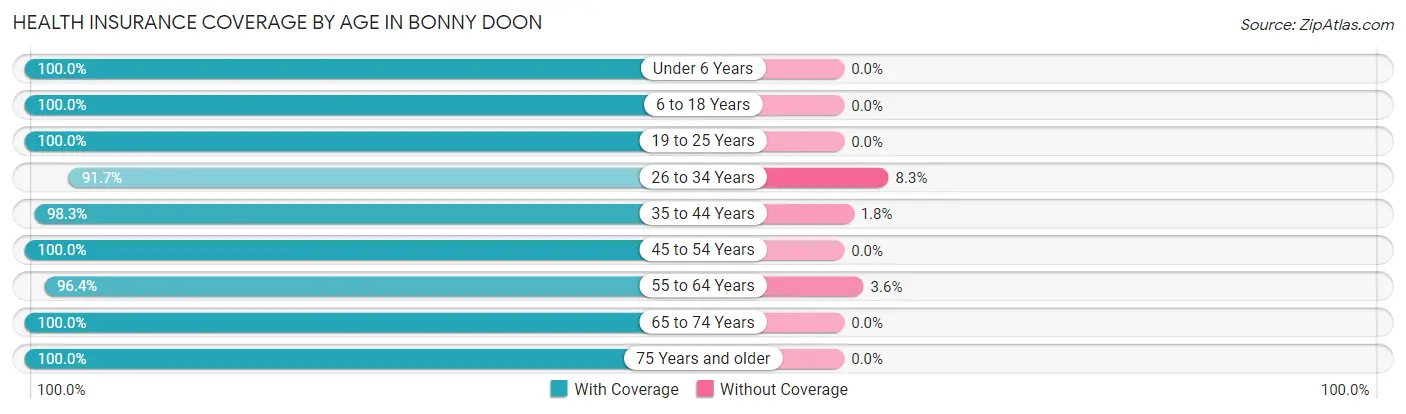
| Age Bracket | With Coverage | Without Coverage |
| Under 6 Years | 83 (100.0%) | 0 (0.0%) |
| 6 to 18 Years | 493 (100.0%) | 0 (0.0%) |
| 19 to 25 Years | 152 (100.0%) | 0 (0.0%) |
| 26 to 34 Years | 344 (91.7%) | 31 (8.3%) |
| 35 to 44 Years | 225 (98.3%) | 4 (1.8%) |
| 45 to 54 Years | 310 (100.0%) | 0 (0.0%) |
| 55 to 64 Years | 480 (96.4%) | 18 (3.6%) |
| 65 to 74 Years | 549 (100.0%) | 0 (0.0%) |
| 75 Years and older | 158 (100.0%) | 0 (0.0%) |
| Total | 2,794 (98.1%) | 53 (1.9%) |
Health Insurance Coverage by Citizenship Status in Bonny Doon
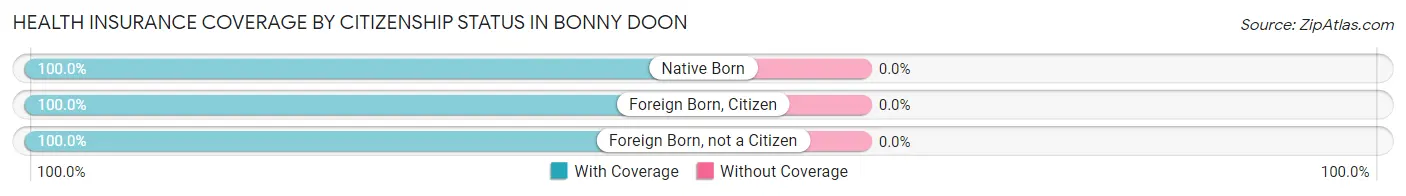
| Citizenship Status | With Coverage | Without Coverage |
| Native Born | 83 (100.0%) | 0 (0.0%) |
| Foreign Born, Citizen | 493 (100.0%) | 0 (0.0%) |
| Foreign Born, not a Citizen | 152 (100.0%) | 0 (0.0%) |
Health Insurance Coverage by Household Income in Bonny Doon
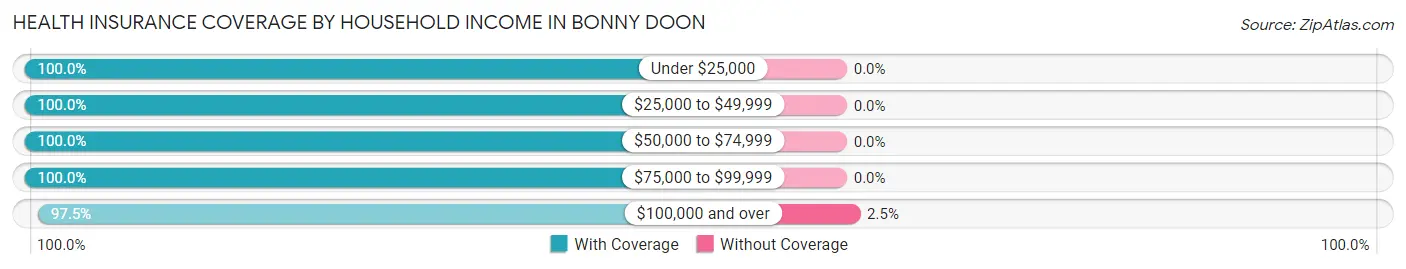
| Household Income | With Coverage | Without Coverage |
| Under $25,000 | 155 (100.0%) | 0 (0.0%) |
| $25,000 to $49,999 | 94 (100.0%) | 0 (0.0%) |
| $50,000 to $74,999 | 110 (100.0%) | 0 (0.0%) |
| $75,000 to $99,999 | 267 (100.0%) | 0 (0.0%) |
| $100,000 and over | 2,028 (97.5%) | 52 (2.5%) |
Public vs Private Health Insurance Coverage by Age in Bonny Doon
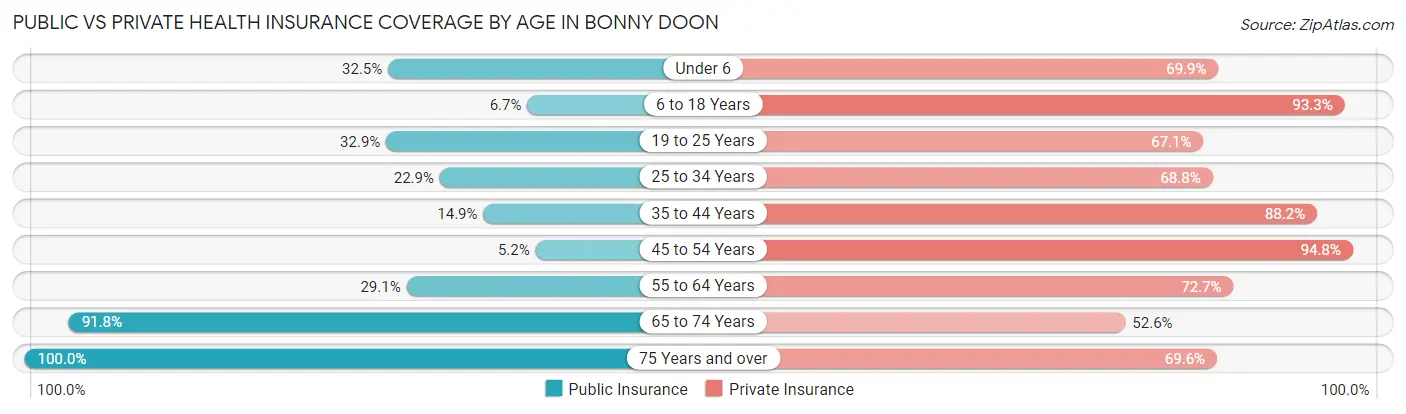
| Age Bracket | Public Insurance | Private Insurance |
| Under 6 | 27 (32.5%) | 58 (69.9%) |
| 6 to 18 Years | 33 (6.7%) | 460 (93.3%) |
| 19 to 25 Years | 50 (32.9%) | 102 (67.1%) |
| 25 to 34 Years | 86 (22.9%) | 258 (68.8%) |
| 35 to 44 Years | 34 (14.8%) | 202 (88.2%) |
| 45 to 54 Years | 16 (5.2%) | 294 (94.8%) |
| 55 to 64 Years | 145 (29.1%) | 362 (72.7%) |
| 65 to 74 Years | 504 (91.8%) | 289 (52.6%) |
| 75 Years and over | 158 (100.0%) | 110 (69.6%) |
| Total | 1,053 (37.0%) | 2,135 (75.0%) |
Disability Status by Sex by Age in Bonny Doon
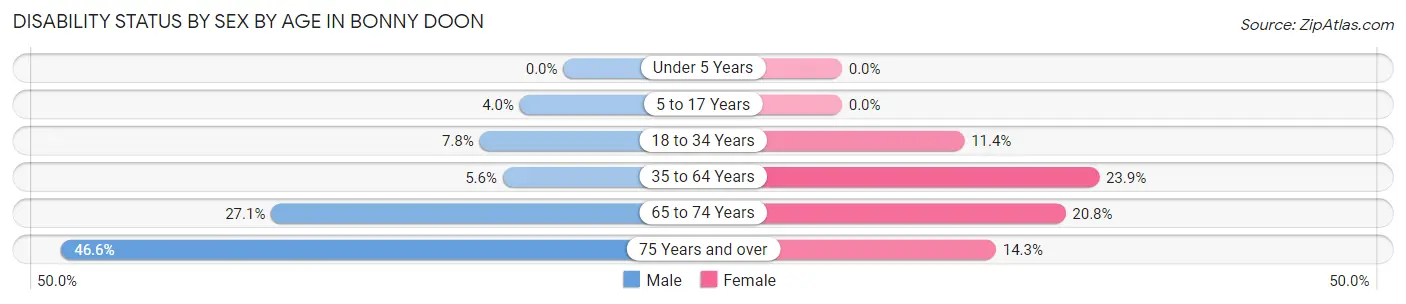
| Age Bracket | Male | Female |
| Under 5 Years | 0 (0.0%) | 0 (0.0%) |
| 5 to 17 Years | 11 (4.0%) | 0 (0.0%) |
| 18 to 34 Years | 27 (7.8%) | 30 (11.4%) |
| 35 to 64 Years | 26 (5.6%) | 137 (23.9%) |
| 65 to 74 Years | 77 (27.1%) | 55 (20.7%) |
| 75 Years and over | 41 (46.6%) | 10 (14.3%) |
Disability Class by Sex by Age in Bonny Doon
Disability Class: Hearing Difficulty
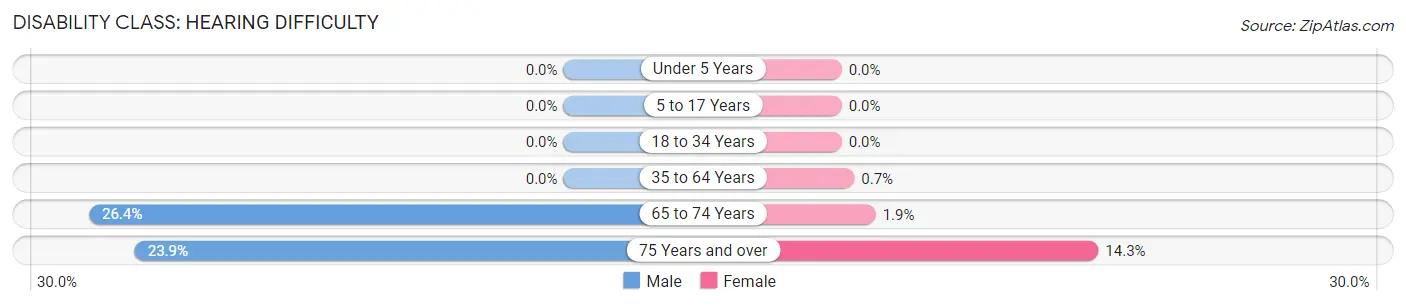
| Age Bracket | Male | Female |
| Under 5 Years | 0 (0.0%) | 0 (0.0%) |
| 5 to 17 Years | 0 (0.0%) | 0 (0.0%) |
| 18 to 34 Years | 0 (0.0%) | 0 (0.0%) |
| 35 to 64 Years | 0 (0.0%) | 4 (0.7%) |
| 65 to 74 Years | 75 (26.4%) | 5 (1.9%) |
| 75 Years and over | 21 (23.9%) | 10 (14.3%) |
Disability Class: Vision Difficulty
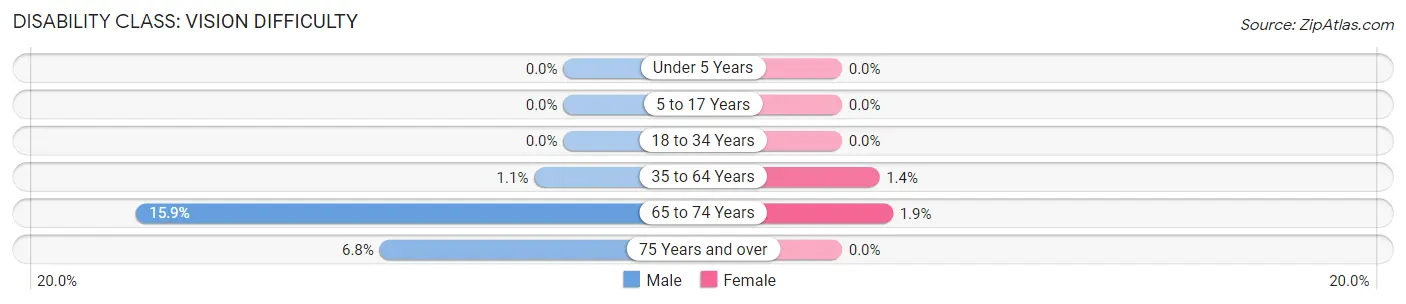
| Age Bracket | Male | Female |
| Under 5 Years | 0 (0.0%) | 0 (0.0%) |
| 5 to 17 Years | 0 (0.0%) | 0 (0.0%) |
| 18 to 34 Years | 0 (0.0%) | 0 (0.0%) |
| 35 to 64 Years | 5 (1.1%) | 8 (1.4%) |
| 65 to 74 Years | 45 (15.9%) | 5 (1.9%) |
| 75 Years and over | 6 (6.8%) | 0 (0.0%) |
Disability Class: Cognitive Difficulty
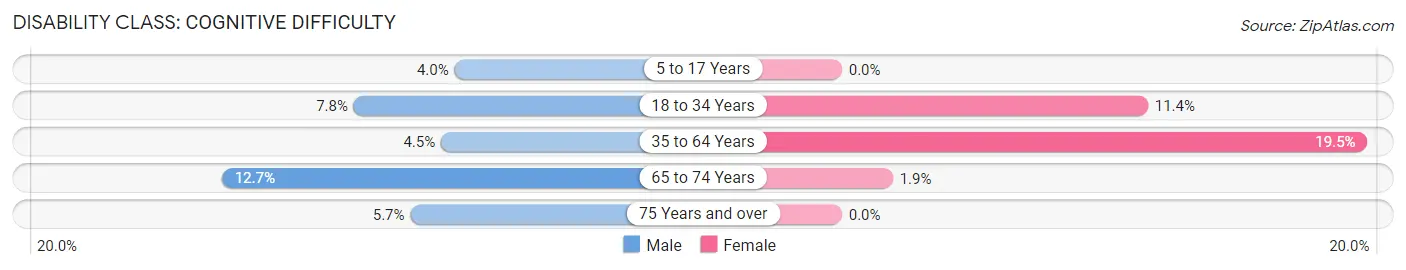
| Age Bracket | Male | Female |
| 5 to 17 Years | 11 (4.0%) | 0 (0.0%) |
| 18 to 34 Years | 27 (7.8%) | 30 (11.4%) |
| 35 to 64 Years | 21 (4.5%) | 112 (19.5%) |
| 65 to 74 Years | 36 (12.7%) | 5 (1.9%) |
| 75 Years and over | 5 (5.7%) | 0 (0.0%) |
Disability Class: Ambulatory Difficulty
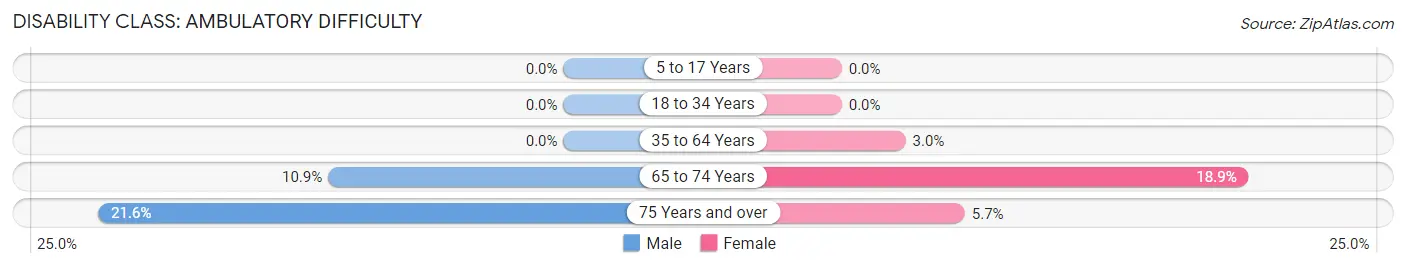
| Age Bracket | Male | Female |
| 5 to 17 Years | 0 (0.0%) | 0 (0.0%) |
| 18 to 34 Years | 0 (0.0%) | 0 (0.0%) |
| 35 to 64 Years | 0 (0.0%) | 17 (3.0%) |
| 65 to 74 Years | 31 (10.9%) | 50 (18.9%) |
| 75 Years and over | 19 (21.6%) | 4 (5.7%) |
Disability Class: Self-Care Difficulty
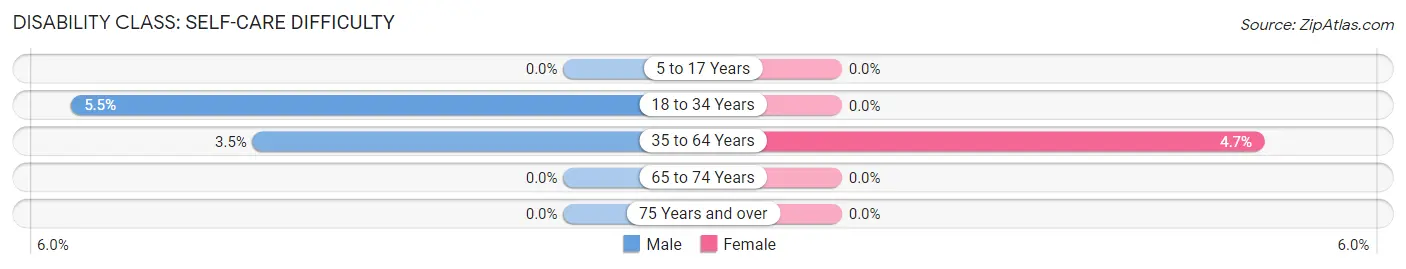
| Age Bracket | Male | Female |
| 5 to 17 Years | 0 (0.0%) | 0 (0.0%) |
| 18 to 34 Years | 19 (5.5%) | 0 (0.0%) |
| 35 to 64 Years | 16 (3.5%) | 27 (4.7%) |
| 65 to 74 Years | 0 (0.0%) | 0 (0.0%) |
| 75 Years and over | 0 (0.0%) | 0 (0.0%) |
Technology Access in Bonny Doon
Computing Device Access in Bonny Doon
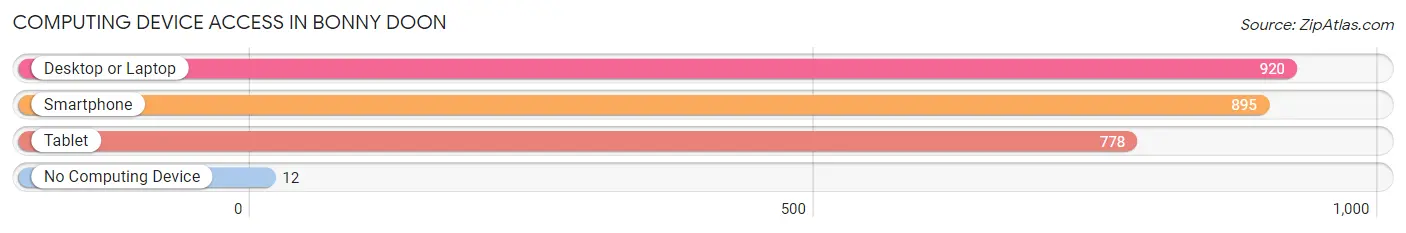
| Device Type | # Households | % Households |
| Desktop or Laptop | 920 | 96.2% |
| Smartphone | 895 | 93.6% |
| Tablet | 778 | 81.4% |
| No Computing Device | 12 | 1.3% |
| Total | 956 | 100.0% |
Internet Access in Bonny Doon
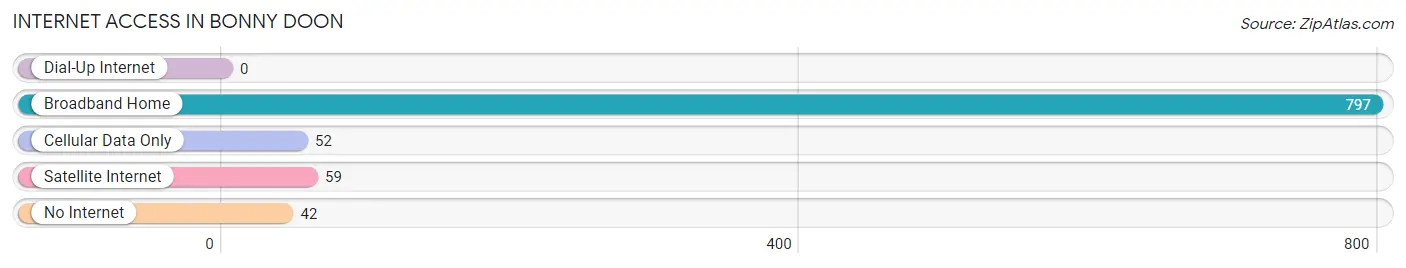
| Internet Type | # Households | % Households |
| Dial-Up Internet | 0 | 0.0% |
| Broadband Home | 797 | 83.4% |
| Cellular Data Only | 52 | 5.4% |
| Satellite Internet | 59 | 6.2% |
| No Internet | 42 | 4.4% |
| Total | 956 | 100.0% |
Bonny Doon Summary
Bonny Doon is a small unincorporated community located in Santa Cruz County, California. It is situated in the Santa Cruz Mountains, approximately 8 miles (13 km) northwest of the city of Santa Cruz. The population of Bonny Doon was estimated to be 1,845 in 2019.
History
Bonny Doon was originally inhabited by the Ohlone people, who lived in the area for thousands of years before the arrival of Europeans. The first Europeans to settle in the area were Spanish missionaries, who established the Mission Santa Cruz in 1791. The mission was abandoned in 1834, and the land was divided into large ranchos.
In the late 19th century, the area was settled by farmers and ranchers, who established small farms and orchards. The area was known as “Bonny Doon” by the early 1900s, and the name was derived from a popular song of the time.
In the 1950s, the area began to experience rapid growth as the population of Santa Cruz increased. The area was annexed by the city of Santa Cruz in 1963, and the population continued to grow.
Geography
Bonny Doon is located in the Santa Cruz Mountains, approximately 8 miles (13 km) northwest of the city of Santa Cruz. The area is characterized by rolling hills, redwood forests, and a mild Mediterranean climate. The area is home to several creeks and streams, including the San Lorenzo River, which flows through the area.
Economy
The economy of Bonny Doon is largely based on tourism and agriculture. The area is home to several wineries, and the local wine industry is a major contributor to the local economy. The area is also home to several small farms and orchards, which produce a variety of fruits and vegetables.
Demographics
As of 2019, the population of Bonny Doon was estimated to be 1,845. The population is largely white (83.3%), with smaller percentages of Hispanic (7.2%), Asian (3.7%), and African American (2.2%) residents. The median household income in Bonny Doon is $90,845, and the median home value is $1,072,000. The area is largely rural, with only a small percentage of the population living in urban areas.
Common Questions
What is the Total Population of Bonny Doon?
Total Population of Bonny Doon is 2,858.
What is the Total Male Population of Bonny Doon?
Total Male Population of Bonny Doon is 1,485.
What is the Total Female Population of Bonny Doon?
Total Female Population of Bonny Doon is 1,373.
What is the Ratio of Males per 100 Females in Bonny Doon?
There are 108.16 Males per 100 Females in Bonny Doon.
What is the Ratio of Females per 100 Males in Bonny Doon?
There are 92.46 Females per 100 Males in Bonny Doon.
What is the Median Population Age in Bonny Doon?
Median Population Age in Bonny Doon is 49.6 Years.
What is the Average Family Size in Bonny Doon
Average Family Size in Bonny Doon is 3.0 People.
What is the Average Household Size in Bonny Doon
Average Household Size in Bonny Doon is 2.8 People.
What is Per Capita Income in Bonny Doon?
Per Capita income in Bonny Doon is $58,821.
What is the Median Family Income in Bonny Doon?
Median Family Income in Bonny Doon is $140,125.
What is the Median Household income in Bonny Doon?
Median Household Income in Bonny Doon is $139,375.
What is Income or Wage Gap in Bonny Doon?
Income or Wage Gap in Bonny Doon is 42.1%.
Women in Bonny Doon earn 57.9 cents for every dollar earned by a man.
What is Inequality or Gini Index in Bonny Doon?
Inequality or Gini Index in Bonny Doon is 0.49.
How Large is the Labor Force in Bonny Doon?
There are 1,364 People in the Labor Forcein in Bonny Doon.
What is the Percentage of People in the Labor Force in Bonny Doon?
55.1% of People are in the Labor Force in Bonny Doon.
What is the Unemployment Rate in Bonny Doon?
Unemployment Rate in Bonny Doon is 3.7%.