Zip Codes with the Most Immigrants from Africa in Phoenix, AZ
RELATED REPORTS & OPTIONS
Africa
Phoenix
Compare Zip Codes
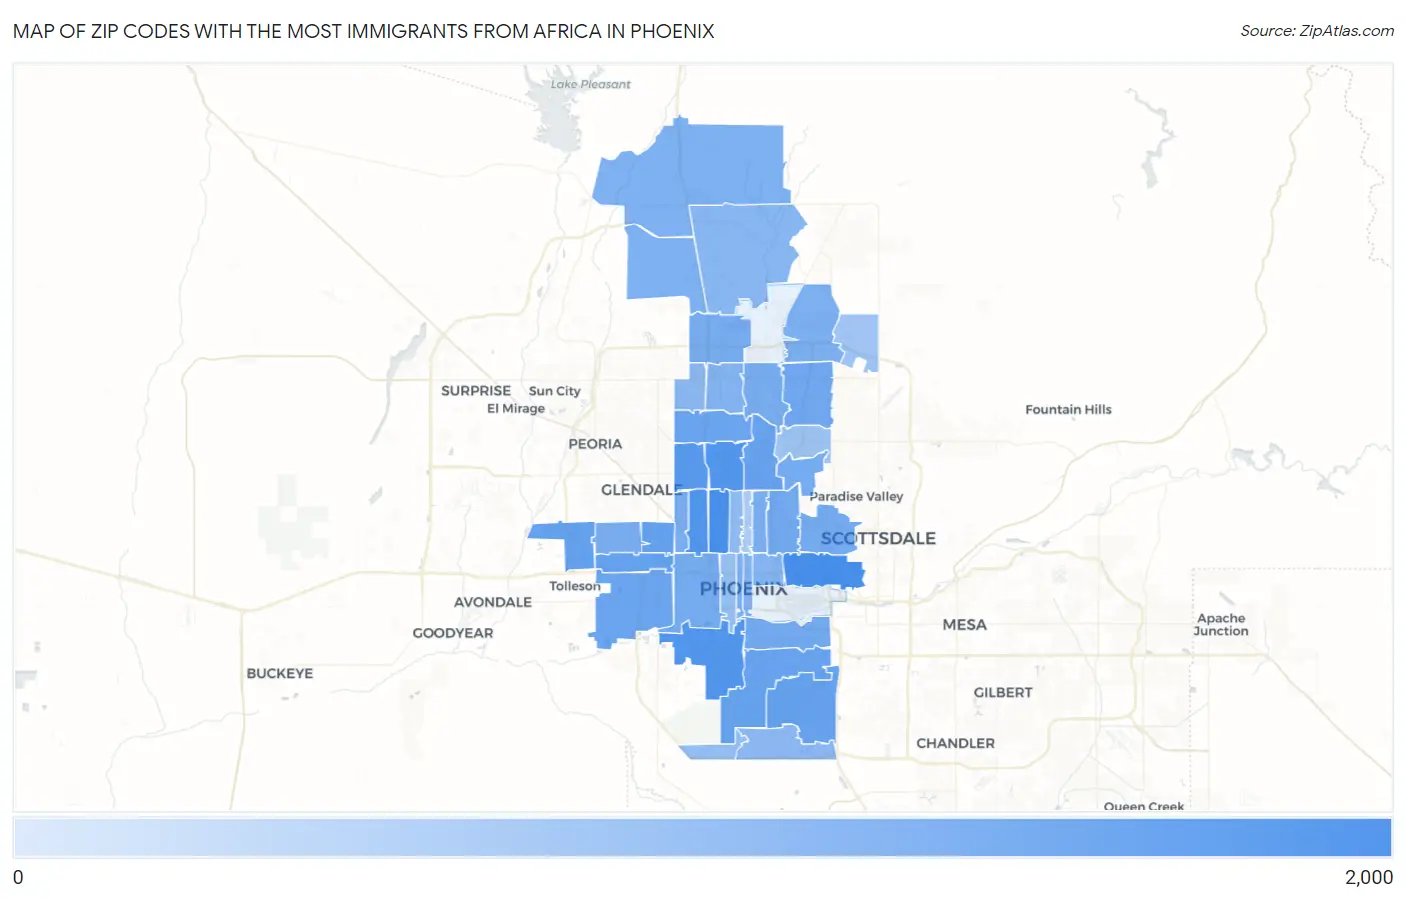
Map of Zip Codes with the Most Immigrants from Africa in Phoenix
0
2,000
Zip Codes with the Most Immigrants from Africa in Phoenix, AZ
| Zip Code | Africa | vs State | vs National | |
| 1. | 85008 | 1,800 | 36,308(4.96%)#1 | 2,580,172(0.07%)#226 |
| 2. | 85015 | 1,783 | 36,308(4.91%)#2 | 2,580,172(0.07%)#234 |
| 3. | 85041 | 1,056 | 36,308(2.91%)#4 | 2,580,172(0.04%)#505 |
| 4. | 85017 | 1,007 | 36,308(2.77%)#5 | 2,580,172(0.04%)#530 |
| 5. | 85021 | 955 | 36,308(2.63%)#6 | 2,580,172(0.04%)#570 |
| 6. | 85051 | 785 | 36,308(2.16%)#8 | 2,580,172(0.03%)#730 |
| 7. | 85031 | 415 | 36,308(1.14%)#22 | 2,580,172(0.02%)#1,518 |
| 8. | 85037 | 398 | 36,308(1.10%)#24 | 2,580,172(0.02%)#1,596 |
| 9. | 85035 | 381 | 36,308(1.05%)#25 | 2,580,172(0.01%)#1,665 |
| 10. | 85020 | 375 | 36,308(1.03%)#26 | 2,580,172(0.01%)#1,688 |
| 11. | 85044 | 369 | 36,308(1.02%)#28 | 2,580,172(0.01%)#1,721 |
| 12. | 85042 | 315 | 36,308(0.87%)#33 | 2,580,172(0.01%)#1,981 |
| 13. | 85043 | 278 | 36,308(0.77%)#39 | 2,580,172(0.01%)#2,209 |
| 14. | 85029 | 271 | 36,308(0.75%)#40 | 2,580,172(0.01%)#2,265 |
| 15. | 85032 | 224 | 36,308(0.62%)#47 | 2,580,172(0.01%)#2,668 |
| 16. | 85040 | 202 | 36,308(0.56%)#53 | 2,580,172(0.01%)#2,914 |
| 17. | 85016 | 190 | 36,308(0.52%)#55 | 2,580,172(0.01%)#3,051 |
| 18. | 85009 | 179 | 36,308(0.49%)#58 | 2,580,172(0.01%)#3,177 |
| 19. | 85018 | 175 | 36,308(0.48%)#60 | 2,580,172(0.01%)#3,220 |
| 20. | 85027 | 164 | 36,308(0.45%)#65 | 2,580,172(0.01%)#3,358 |
| 21. | 85022 | 153 | 36,308(0.42%)#70 | 2,580,172(0.01%)#3,540 |
| 22. | 85019 | 145 | 36,308(0.40%)#72 | 2,580,172(0.01%)#3,663 |
| 23. | 85033 | 142 | 36,308(0.39%)#75 | 2,580,172(0.01%)#3,691 |
| 24. | 85014 | 131 | 36,308(0.36%)#79 | 2,580,172(0.01%)#3,880 |
| 25. | 85050 | 125 | 36,308(0.34%)#82 | 2,580,172(0.00%)#4,000 |
| 26. | 85083 | 113 | 36,308(0.31%)#89 | 2,580,172(0.00%)#4,277 |
| 27. | 85003 | 110 | 36,308(0.30%)#90 | 2,580,172(0.00%)#4,352 |
| 28. | 85086 | 108 | 36,308(0.30%)#91 | 2,580,172(0.00%)#4,383 |
| 29. | 85004 | 105 | 36,308(0.29%)#93 | 2,580,172(0.00%)#4,456 |
| 30. | 85023 | 87 | 36,308(0.24%)#102 | 2,580,172(0.00%)#4,841 |
| 31. | 85006 | 81 | 36,308(0.22%)#105 | 2,580,172(0.00%)#5,012 |
| 32. | 85085 | 73 | 36,308(0.20%)#113 | 2,580,172(0.00%)#5,251 |
| 33. | 85053 | 63 | 36,308(0.17%)#124 | 2,580,172(0.00%)#5,610 |
| 34. | 85048 | 53 | 36,308(0.15%)#128 | 2,580,172(0.00%)#5,987 |
| 35. | 85013 | 46 | 36,308(0.13%)#135 | 2,580,172(0.00%)#6,298 |
| 36. | 85007 | 36 | 36,308(0.10%)#145 | 2,580,172(0.00%)#6,853 |
| 37. | 85045 | 34 | 36,308(0.09%)#148 | 2,580,172(0.00%)#6,990 |
| 38. | 85028 | 22 | 36,308(0.06%)#164 | 2,580,172(0.00%)#7,868 |
| 39. | 85054 | 19 | 36,308(0.05%)#169 | 2,580,172(0.00%)#8,186 |
| 40. | 85012 | 10 | 36,308(0.03%)#181 | 2,580,172(0.00%)#9,362 |
1
Common Questions
What are the Top 10 Zip Codes with the Most Immigrants from Africa in Phoenix, AZ?
Top 10 Zip Codes with the Most Immigrants from Africa in Phoenix, AZ are:
What zip code has the Most Immigrants from Africa in Phoenix, AZ?
85008 has the Most Immigrants from Africa in Phoenix, AZ with 1,800.
What is the Total Immigrants from Africa in Phoenix, AZ?
Total Immigrants from Africa in Phoenix is 14,377.
What is the Total Immigrants from Africa in Arizona?
Total Immigrants from Africa in Arizona is 36,308.
What is the Total Immigrants from Africa in the United States?
Total Immigrants from Africa in the United States is 2,580,172.