Peterstown, WV
Peterstown Map
Peterstown Overview
673
TOTAL POPULATION
340
MALE POPULATION
333
FEMALE POPULATION
102.10
MALES / 100 FEMALES
97.94
FEMALES / 100 MALES
31.2
MEDIAN AGE
4.7
AVG FAMILY SIZE
3.3
AVG HOUSEHOLD SIZE
$22,833
PER CAPITA INCOME
$78,750
AVG FAMILY INCOME
$39,167
AVG HOUSEHOLD INCOME
24.8%
WAGE / INCOME GAP [ % ]
75.2¢/ $1
WAGE / INCOME GAP [ $ ]
0.43
INEQUALITY / GINI INDEX
148
LABOR FORCE [ PEOPLE ]
32.4%
PERCENT IN LABOR FORCE
10.8%
UNEMPLOYMENT RATE
Peterstown Zip Codes
Peterstown Area Codes
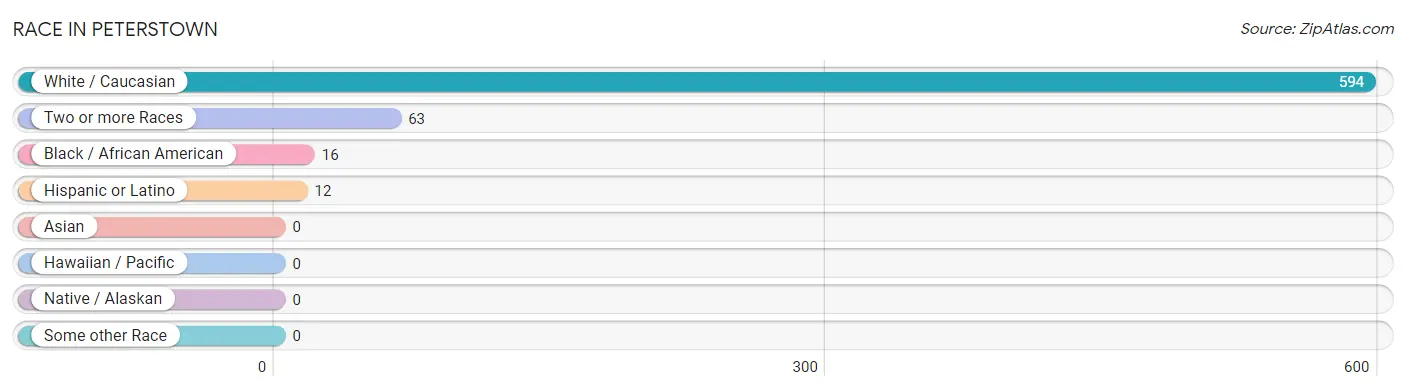
Race in Peterstown
The most populous races in Peterstown are White / Caucasian (594 | 88.3%), Two or more Races (63 | 9.4%), and Black / African American (16 | 2.4%).
| Race | # Population | % Population |
| Asian | 0 | 0.0% |
| Black / African American | 16 | 2.4% |
| Hawaiian / Pacific | 0 | 0.0% |
| Hispanic or Latino | 12 | 1.8% |
| Native / Alaskan | 0 | 0.0% |
| White / Caucasian | 594 | 88.3% |
| Two or more Races | 63 | 9.4% |
| Some other Race | 0 | 0.0% |
| Total | 673 | 100.0% |
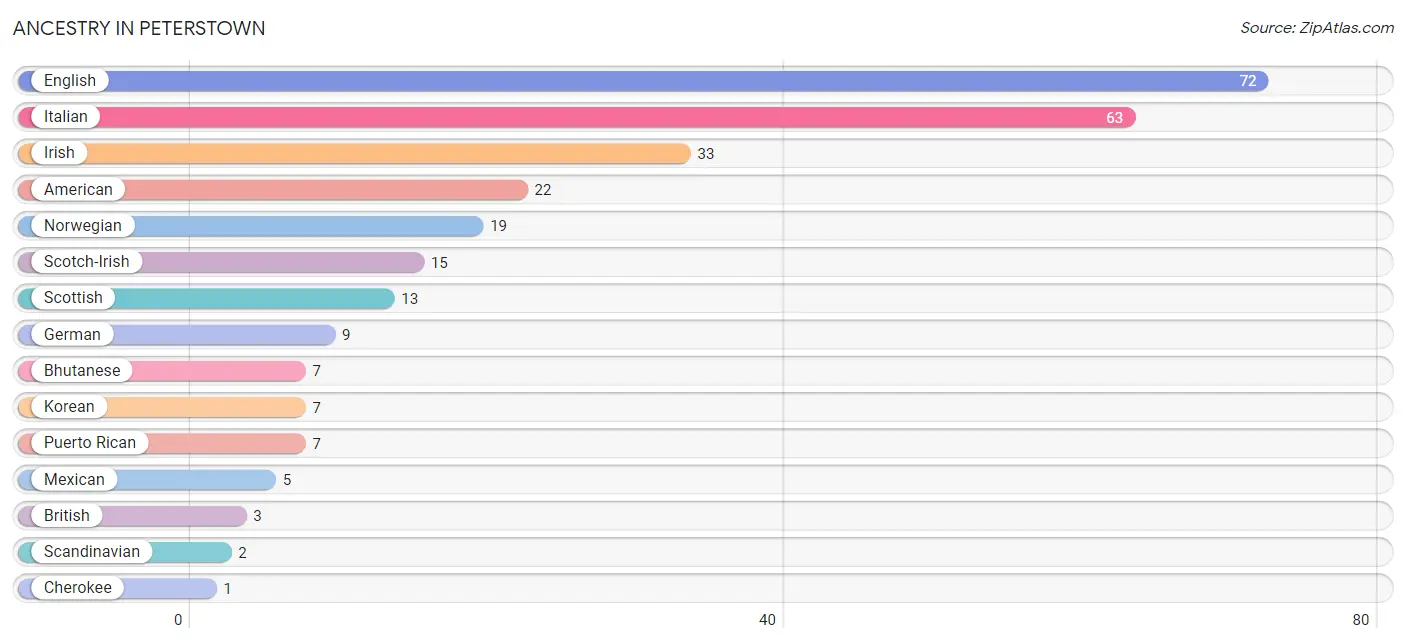
Ancestry in Peterstown
The most populous ancestries reported in Peterstown are English (72 | 10.7%), Italian (63 | 9.4%), Irish (33 | 4.9%), American (22 | 3.3%), and Norwegian (19 | 2.8%), together accounting for 31.0% of all Peterstown residents.
| Ancestry | # Population | % Population |
| American | 22 | 3.3% |
| Bhutanese | 7 | 1.0% |
| British | 3 | 0.4% |
| Cherokee | 1 | 0.2% |
| English | 72 | 10.7% |
| German | 9 | 1.3% |
| Irish | 33 | 4.9% |
| Italian | 63 | 9.4% |
| Korean | 7 | 1.0% |
| Mexican | 5 | 0.7% |
| Norwegian | 19 | 2.8% |
| Puerto Rican | 7 | 1.0% |
| Russian | 1 | 0.2% |
| Scandinavian | 2 | 0.3% |
| Scotch-Irish | 15 | 2.2% |
| Scottish | 13 | 1.9% |
| Ukrainian | 1 | 0.2% | View All 17 Rows |
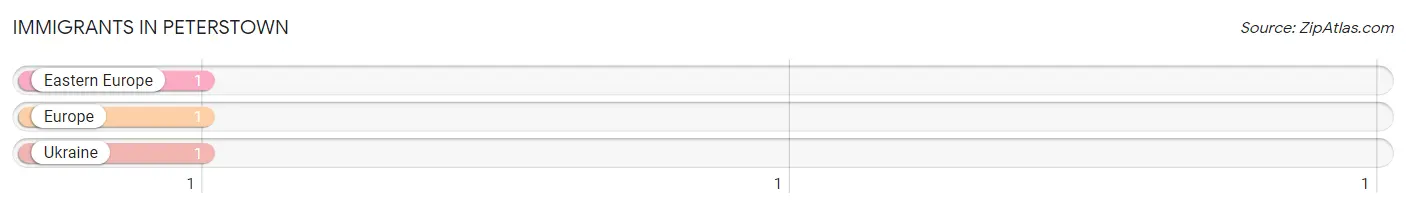
Immigrants in Peterstown
The most numerous immigrant groups reported in Peterstown came from Eastern Europe (1 | 0.2%), Europe (1 | 0.2%), and Ukraine (1 | 0.2%), together accounting for 0.5% of all Peterstown residents.
| Immigration Origin | # Population | % Population |
| Eastern Europe | 1 | 0.2% |
| Europe | 1 | 0.2% |
| Ukraine | 1 | 0.2% | View All 3 Rows |
Sex and Age in Peterstown
Sex and Age in Peterstown
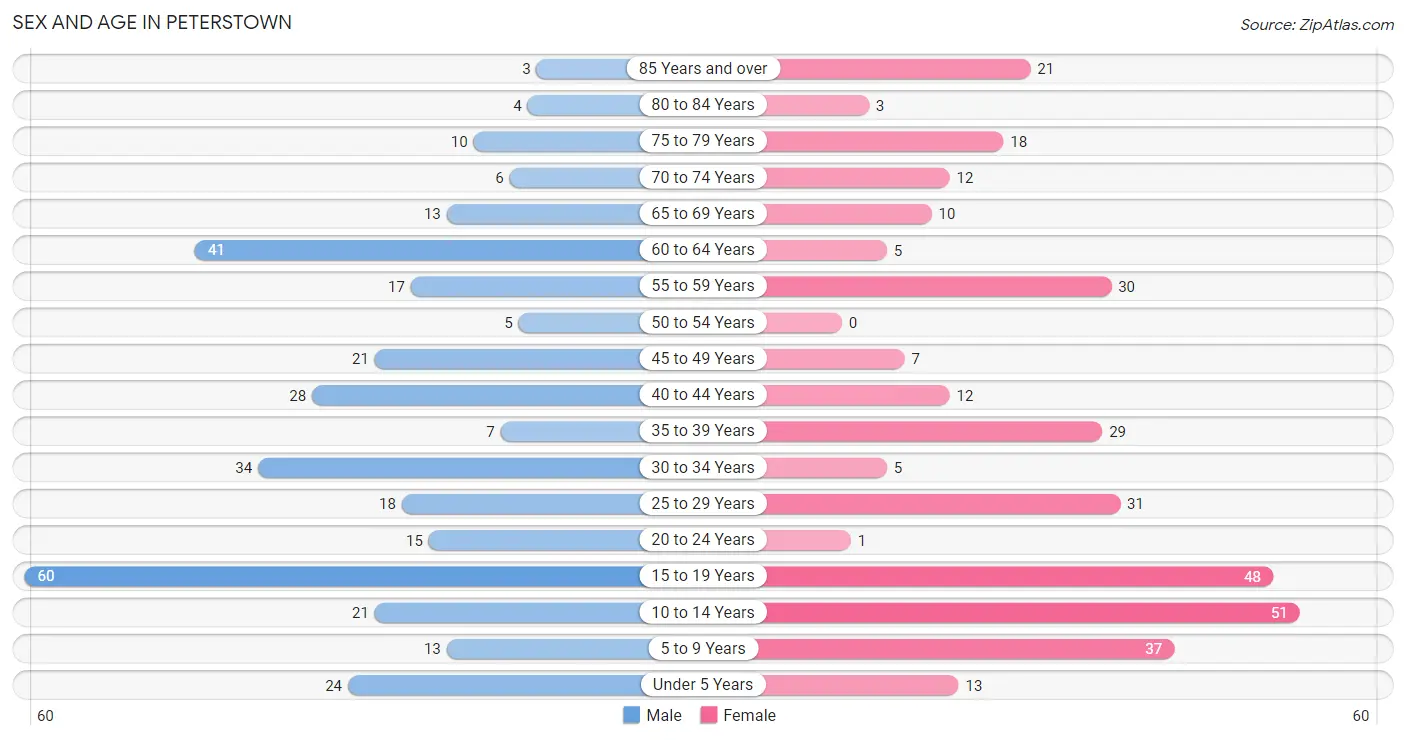
The most populous age groups in Peterstown are 15 to 19 Years (60 | 17.6%) for men and 10 to 14 Years (51 | 15.3%) for women.
| Age Bracket | Male | Female |
| Under 5 Years | 24 (7.1%) | 13 (3.9%) |
| 5 to 9 Years | 13 (3.8%) | 37 (11.1%) |
| 10 to 14 Years | 21 (6.2%) | 51 (15.3%) |
| 15 to 19 Years | 60 (17.6%) | 48 (14.4%) |
| 20 to 24 Years | 15 (4.4%) | 1 (0.3%) |
| 25 to 29 Years | 18 (5.3%) | 31 (9.3%) |
| 30 to 34 Years | 34 (10.0%) | 5 (1.5%) |
| 35 to 39 Years | 7 (2.1%) | 29 (8.7%) |
| 40 to 44 Years | 28 (8.2%) | 12 (3.6%) |
| 45 to 49 Years | 21 (6.2%) | 7 (2.1%) |
| 50 to 54 Years | 5 (1.5%) | 0 (0.0%) |
| 55 to 59 Years | 17 (5.0%) | 30 (9.0%) |
| 60 to 64 Years | 41 (12.1%) | 5 (1.5%) |
| 65 to 69 Years | 13 (3.8%) | 10 (3.0%) |
| 70 to 74 Years | 6 (1.8%) | 12 (3.6%) |
| 75 to 79 Years | 10 (2.9%) | 18 (5.4%) |
| 80 to 84 Years | 4 (1.2%) | 3 (0.9%) |
| 85 Years and over | 3 (0.9%) | 21 (6.3%) |
| Total | 340 (100.0%) | 333 (100.0%) |
Families and Households in Peterstown
Median Family Size in Peterstown
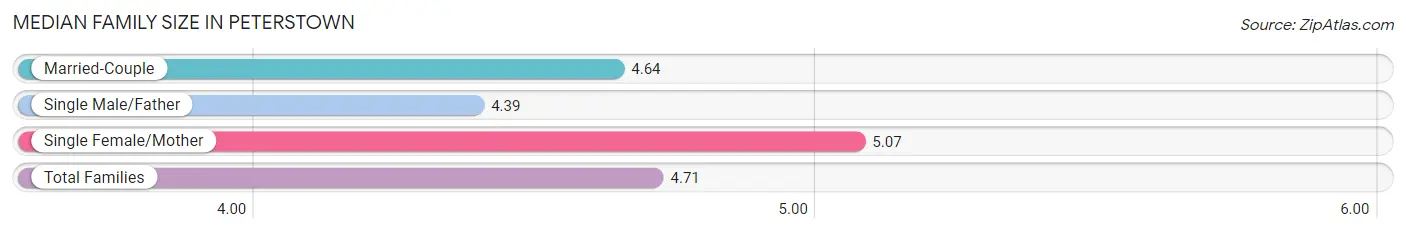
The median family size in Peterstown is 4.71 persons per family, with single female/mother families (28 | 26.2%) accounting for the largest median family size of 5.07 persons per family. On the other hand, single male/father families (18 | 16.8%) represent the smallest median family size with 4.39 persons per family.
| Family Type | # Families | Family Size |
| Married-Couple | 61 (57.0%) | 4.64 |
| Single Male/Father | 18 (16.8%) | 4.39 |
| Single Female/Mother | 28 (26.2%) | 5.07 |
| Total Families | 107 (100.0%) | 4.71 |
Median Household Size in Peterstown
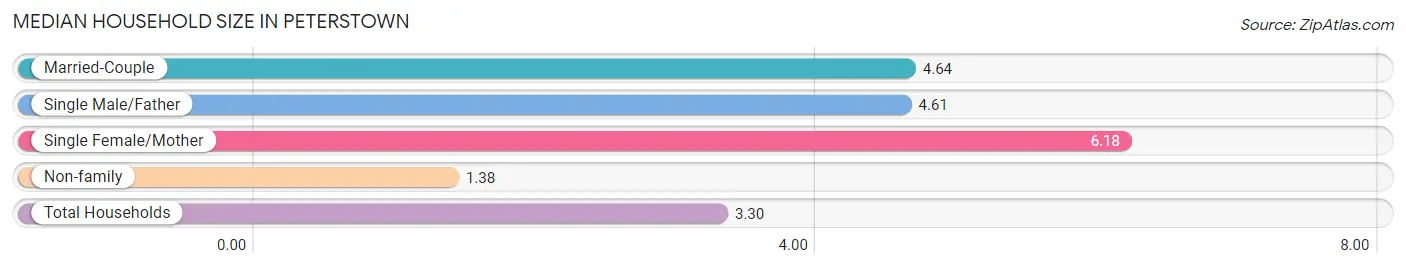
The median household size in Peterstown is 3.30 persons per household, with single female/mother households (28 | 13.7%) accounting for the largest median household size of 6.18 persons per household. non-family households (97 | 47.5%) represent the smallest median household size with 1.38 persons per household.
| Household Type | # Households | Household Size |
| Married-Couple | 61 (29.9%) | 4.64 |
| Single Male/Father | 18 (8.8%) | 4.61 |
| Single Female/Mother | 28 (13.7%) | 6.18 |
| Non-family | 97 (47.5%) | 1.38 |
| Total Households | 204 (100.0%) | 3.30 |
Household Size by Marriage Status in Peterstown
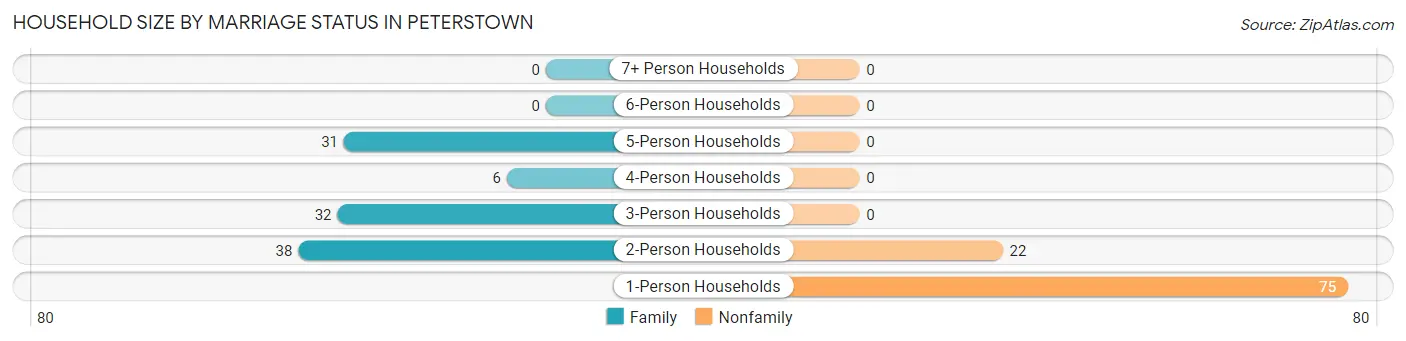
Out of a total of 204 households in Peterstown, 107 (52.4%) are family households, while 97 (47.5%) are nonfamily households. The most numerous type of family households are 2-person households, comprising 38, and the most common type of nonfamily households are 1-person households, comprising 75.
| Household Size | Family Households | Nonfamily Households |
| 1-Person Households | - | 75 (36.8%) |
| 2-Person Households | 38 (18.6%) | 22 (10.8%) |
| 3-Person Households | 32 (15.7%) | 0 (0.0%) |
| 4-Person Households | 6 (2.9%) | 0 (0.0%) |
| 5-Person Households | 31 (15.2%) | 0 (0.0%) |
| 6-Person Households | 0 (0.0%) | 0 (0.0%) |
| 7+ Person Households | 0 (0.0%) | 0 (0.0%) |
| Total | 107 (52.4%) | 97 (47.5%) |
Female Fertility in Peterstown
Fertility by Age in Peterstown
| Age Bracket | Women with Births | Births / 1,000 Women |
| 15 to 19 years | 0 (0.0%) | 0.0 |
| 20 to 34 years | 0 (0.0%) | 0.0 |
| 35 to 50 years | 0 (0.0%) | 0.0 |
| Total | 0 (0.0%) | 0.0 |
Fertility by Age by Marriage Status in Peterstown
| Age Bracket | Married | Unmarried |
| 15 to 19 years | 0 (0.0%) | 0 (0.0%) |
| 20 to 34 years | 0 (0.0%) | 0 (0.0%) |
| 35 to 50 years | 0 (0.0%) | 0 (0.0%) |
| Total | 0 (0.0%) | 0 (0.0%) |
Fertility by Education in Peterstown
| Educational Attainment | Women with Births | Births / 1,000 Women |
| Less than High School | 0 (0.0%) | 0.0 |
| High School Diploma | 0 (0.0%) | 0.0 |
| College or Associate's Degree | 0 (0.0%) | 0.0 |
| Bachelor's Degree | 0 (0.0%) | 0.0 |
| Graduate Degree | 0 (0.0%) | 0.0 |
| Total | 0 (0.0%) | 0.0 |
Fertility by Education by Marriage Status in Peterstown
| Educational Attainment | Married | Unmarried |
| Less than High School | 0 (0.0%) | 0 (0.0%) |
| High School Diploma | 0 (0.0%) | 0 (0.0%) |
| College or Associate's Degree | 0 (0.0%) | 0 (0.0%) |
| Bachelor's Degree | 0 (0.0%) | 0 (0.0%) |
| Graduate Degree | 0 (0.0%) | 0 (0.0%) |
| Total | 0 (0.0%) | 0 (0.0%) |
Income in Peterstown
Income Overview in Peterstown
Per Capita Income in Peterstown is $22,833, while median incomes of families and households are $78,750 and $39,167 respectively.
| Characteristic | Number | Measure |
| Per Capita Income | 673 | $22,833 |
| Median Family Income | 107 | $78,750 |
| Mean Family Income | 107 | $86,690 |
| Median Household Income | 204 | $39,167 |
| Mean Household Income | 204 | $60,796 |
| Income Deficit | 107 | $0 |
| Wage / Income Gap (%) | 673 | 24.81% |
| Wage / Income Gap ($) | 673 | 75.19¢ per $1 |
| Gini / Inequality Index | 673 | 0.43 |
Earnings by Sex in Peterstown
Average Earnings in Peterstown are $34,583, $40,921 for men and $30,769 for women, a difference of 24.8%.
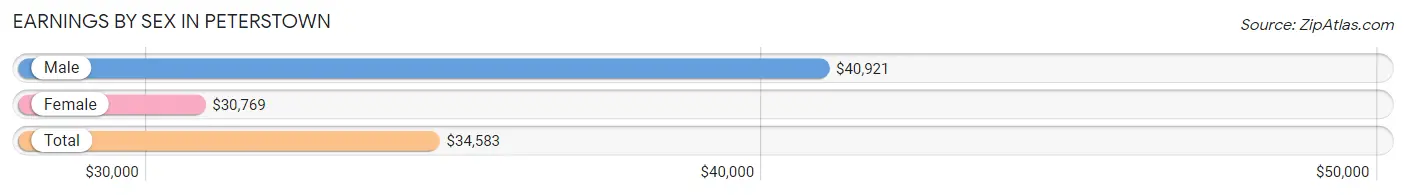
| Sex | Number | Average Earnings |
| Male | 90 (54.9%) | $40,921 |
| Female | 74 (45.1%) | $30,769 |
| Total | 164 (100.0%) | $34,583 |
Earnings by Sex by Income Bracket in Peterstown
The most common earnings brackets in Peterstown are $40,000 to $44,999 for men (19 | 21.1%) and $100,000+ for women (17 | 23.0%).
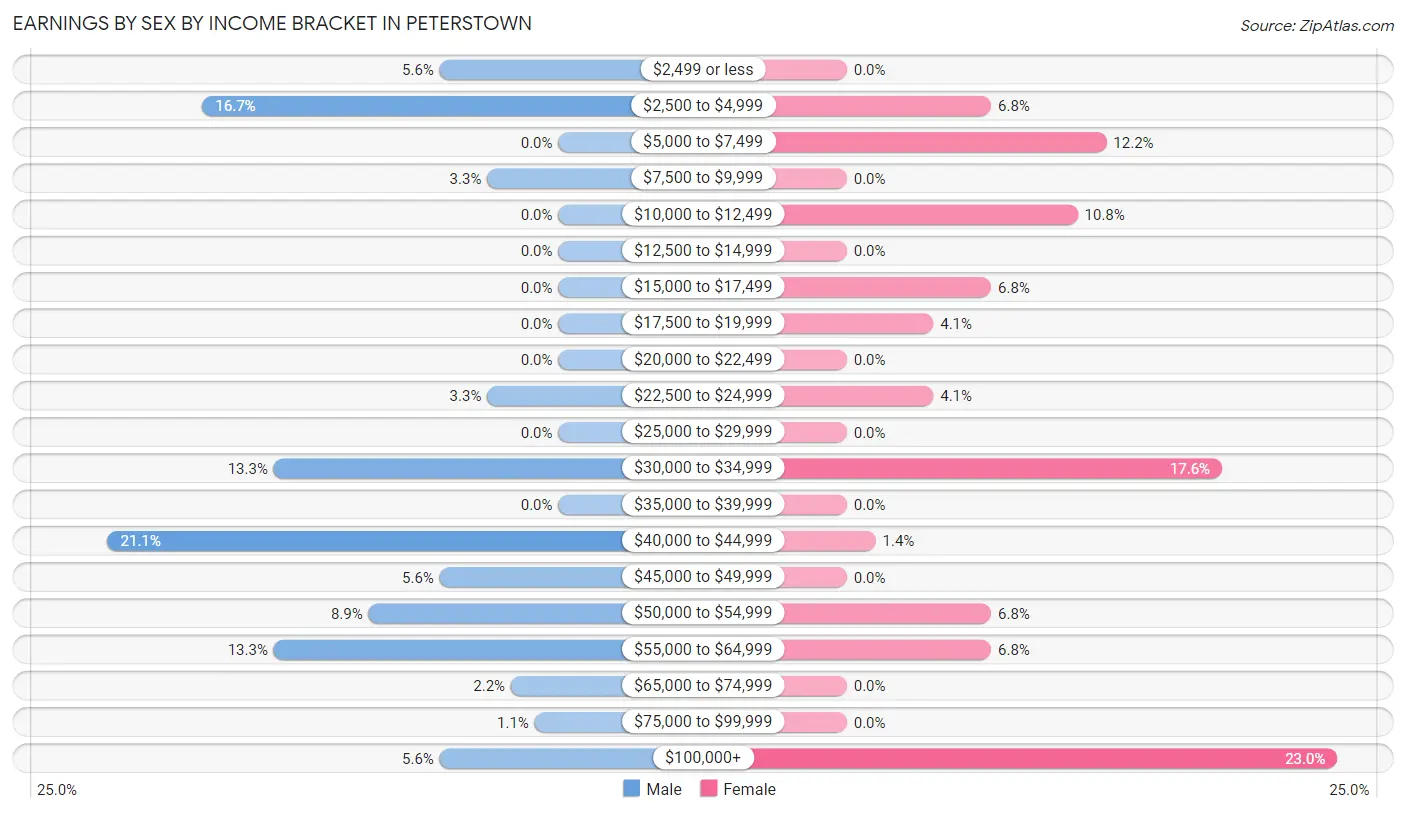
| Income | Male | Female |
| $2,499 or less | 5 (5.6%) | 0 (0.0%) |
| $2,500 to $4,999 | 15 (16.7%) | 5 (6.8%) |
| $5,000 to $7,499 | 0 (0.0%) | 9 (12.2%) |
| $7,500 to $9,999 | 3 (3.3%) | 0 (0.0%) |
| $10,000 to $12,499 | 0 (0.0%) | 8 (10.8%) |
| $12,500 to $14,999 | 0 (0.0%) | 0 (0.0%) |
| $15,000 to $17,499 | 0 (0.0%) | 5 (6.8%) |
| $17,500 to $19,999 | 0 (0.0%) | 3 (4.1%) |
| $20,000 to $22,499 | 0 (0.0%) | 0 (0.0%) |
| $22,500 to $24,999 | 3 (3.3%) | 3 (4.1%) |
| $25,000 to $29,999 | 0 (0.0%) | 0 (0.0%) |
| $30,000 to $34,999 | 12 (13.3%) | 13 (17.6%) |
| $35,000 to $39,999 | 0 (0.0%) | 0 (0.0%) |
| $40,000 to $44,999 | 19 (21.1%) | 1 (1.3%) |
| $45,000 to $49,999 | 5 (5.6%) | 0 (0.0%) |
| $50,000 to $54,999 | 8 (8.9%) | 5 (6.8%) |
| $55,000 to $64,999 | 12 (13.3%) | 5 (6.8%) |
| $65,000 to $74,999 | 2 (2.2%) | 0 (0.0%) |
| $75,000 to $99,999 | 1 (1.1%) | 0 (0.0%) |
| $100,000+ | 5 (5.6%) | 17 (23.0%) |
| Total | 90 (100.0%) | 74 (100.0%) |
Earnings by Sex by Educational Attainment in Peterstown
Average earnings in Peterstown are $40,987 for men and $31,635 for women, a difference of 22.8%. Men with an educational attainment of high school diploma enjoy the highest average annual earnings of $42,422, while those with high school diploma education earn the least with $42,422. Women with an educational attainment of college or associate's degree earn the most with the average annual earnings of $31,042, while those with college or associate's degree education have the smallest earnings of $31,042.
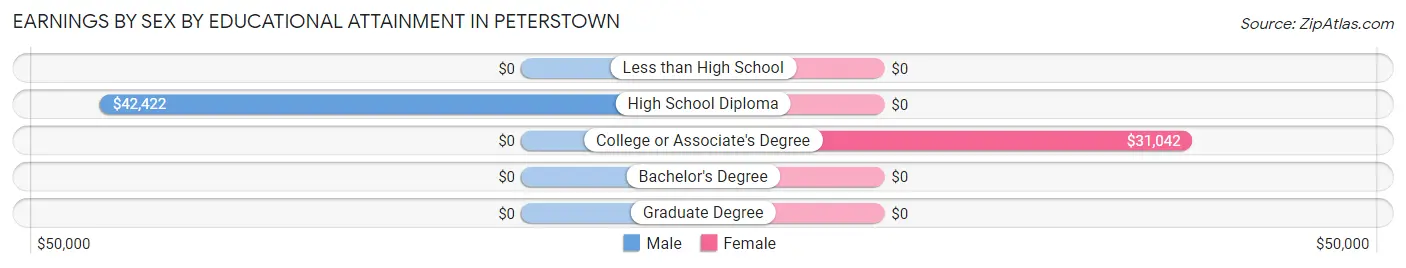
| Educational Attainment | Male Income | Female Income |
| Less than High School | - | - |
| High School Diploma | $42,422 | $0 |
| College or Associate's Degree | - | - |
| Bachelor's Degree | - | - |
| Graduate Degree | - | - |
| Total | $40,987 | $31,635 |
Family Income in Peterstown
Family Income Brackets in Peterstown
According to the Peterstown family income data, there are 23 families falling into the $75,000 to $99,999 income range, which is the most common income bracket and makes up 21.5% of all families.
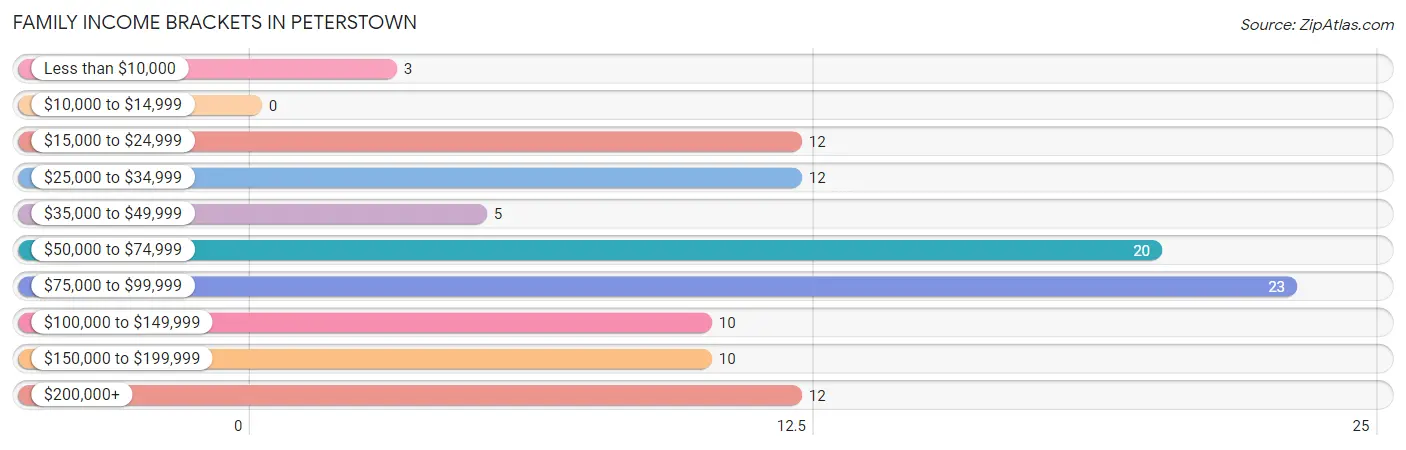
| Income Bracket | # Families | % Families |
| Less than $10,000 | 3 | 2.8% |
| $10,000 to $14,999 | 0 | 0.0% |
| $15,000 to $24,999 | 12 | 11.2% |
| $25,000 to $34,999 | 12 | 11.2% |
| $35,000 to $49,999 | 5 | 4.7% |
| $50,000 to $74,999 | 20 | 18.7% |
| $75,000 to $99,999 | 23 | 21.5% |
| $100,000 to $149,999 | 10 | 9.3% |
| $150,000 to $199,999 | 10 | 9.3% |
| $200,000+ | 12 | 11.2% |
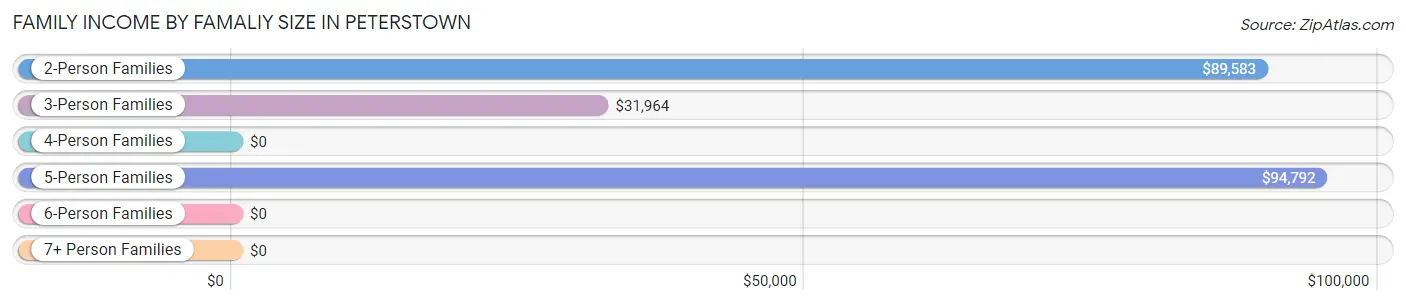
Family Income by Famaliy Size in Peterstown
5-person families (21 | 19.6%) account for the highest median family income in Peterstown with $94,792 per family, while 2-person families (45 | 42.1%) have the highest median income of $44,792 per family member.
| Income Bracket | # Families | Median Income |
| 2-Person Families | 45 (42.1%) | $89,583 |
| 3-Person Families | 31 (29.0%) | $31,964 |
| 4-Person Families | 10 (9.3%) | $0 |
| 5-Person Families | 21 (19.6%) | $94,792 |
| 6-Person Families | 0 (0.0%) | $0 |
| 7+ Person Families | 0 (0.0%) | $0 |
| Total | 107 (100.0%) | $78,750 |
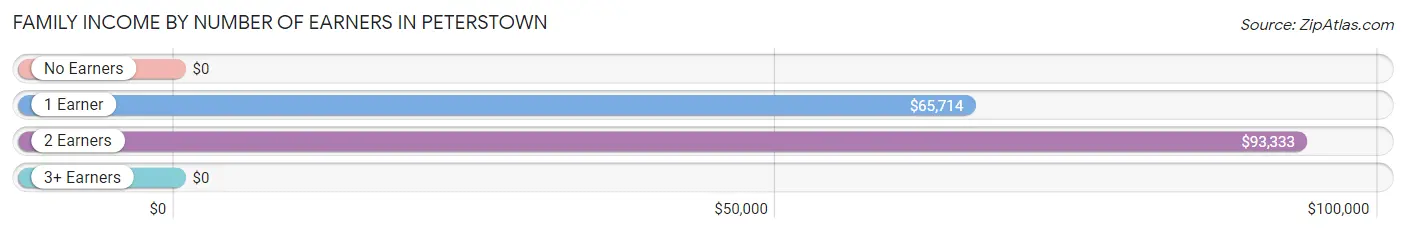
Family Income by Number of Earners in Peterstown
| Number of Earners | # Families | Median Income |
| No Earners | 35 (32.7%) | $0 |
| 1 Earner | 42 (39.3%) | $65,714 |
| 2 Earners | 30 (28.0%) | $93,333 |
| 3+ Earners | 0 (0.0%) | $0 |
| Total | 107 (100.0%) | $78,750 |
Household Income in Peterstown
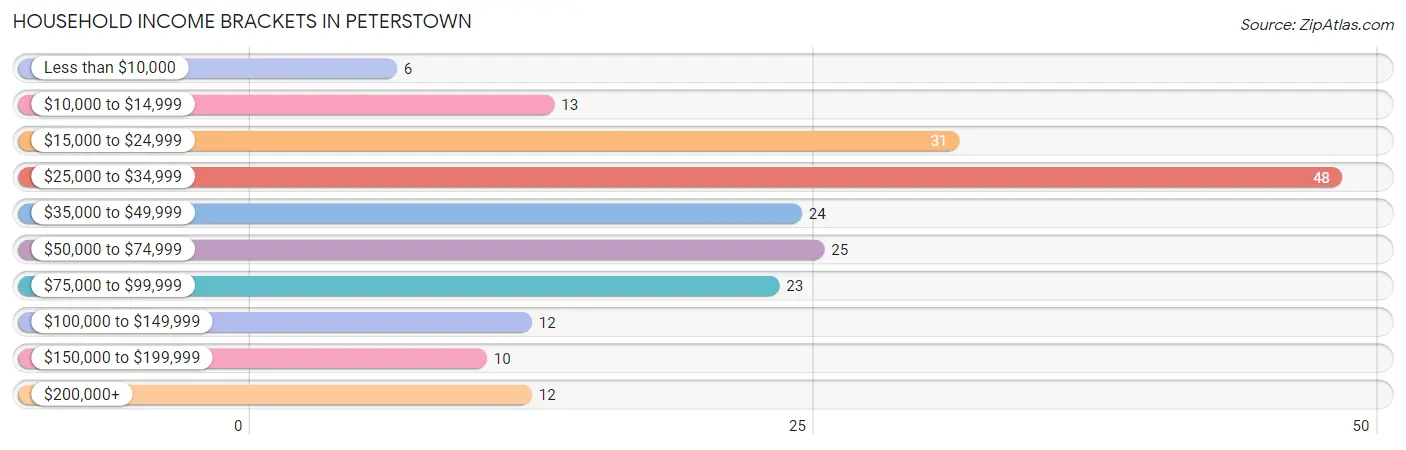
Household Income Brackets in Peterstown
With 48 households falling in the category, the $25,000 to $34,999 income range is the most frequent in Peterstown, accounting for 23.5% of all households. In contrast, only 6 households (2.9%) fall into the less than $10,000 income bracket, making it the least populous group.
| Income Bracket | # Households | % Households |
| Less than $10,000 | 6 | 2.9% |
| $10,000 to $14,999 | 13 | 6.4% |
| $15,000 to $24,999 | 31 | 15.2% |
| $25,000 to $34,999 | 48 | 23.5% |
| $35,000 to $49,999 | 24 | 11.8% |
| $50,000 to $74,999 | 25 | 12.3% |
| $75,000 to $99,999 | 23 | 11.3% |
| $100,000 to $149,999 | 12 | 5.9% |
| $150,000 to $199,999 | 10 | 4.9% |
| $200,000+ | 12 | 5.9% |
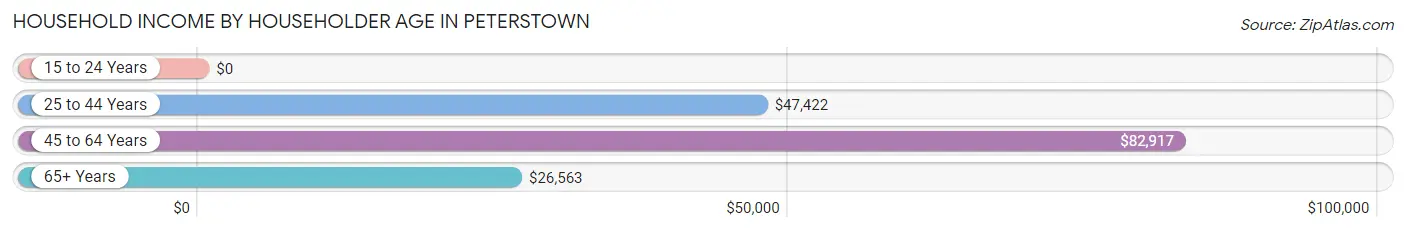
Household Income by Householder Age in Peterstown
The median household income in Peterstown is $39,167, with the highest median household income of $82,917 found in the 45 to 64 years age bracket for the primary householder. A total of 45 households (22.1%) fall into this category. Meanwhile, the 15 to 24 years age bracket for the primary householder has the lowest median household income of $0, with 1 households (0.5%) in this group.
| Income Bracket | # Households | Median Income |
| 15 to 24 Years | 1 (0.5%) | $0 |
| 25 to 44 Years | 73 (35.8%) | $47,422 |
| 45 to 64 Years | 45 (22.1%) | $82,917 |
| 65+ Years | 85 (41.7%) | $26,563 |
| Total | 204 (100.0%) | $39,167 |
Poverty in Peterstown
Income Below Poverty by Sex and Age in Peterstown
With 27.9% poverty level for males and 19.5% for females among the residents of Peterstown, 16 and 17 year old males and under 5 year old females are the most vulnerable to poverty, with 22 males (78.6%) and 13 females (100.0%) in their respective age groups living below the poverty level.
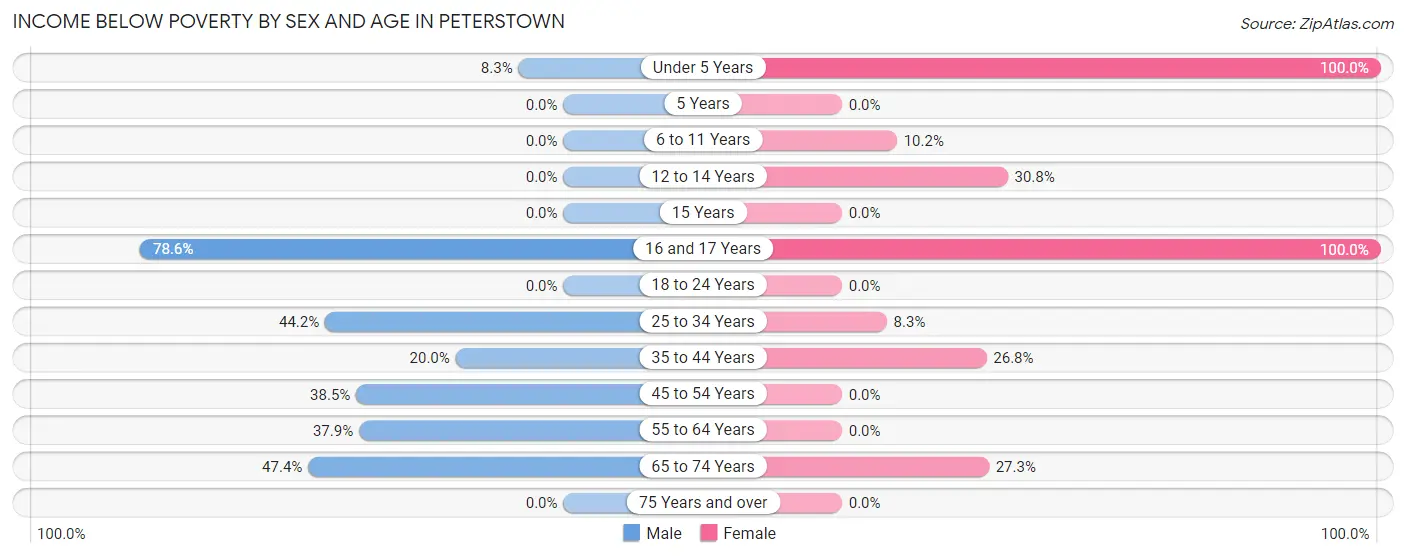
| Age Bracket | Male | Female |
| Under 5 Years | 2 (8.3%) | 13 (100.0%) |
| 5 Years | 0 (0.0%) | 0 (0.0%) |
| 6 to 11 Years | 0 (0.0%) | 5 (10.2%) |
| 12 to 14 Years | 0 (0.0%) | 12 (30.8%) |
| 15 Years | 0 (0.0%) | 0 (0.0%) |
| 16 and 17 Years | 22 (78.6%) | 15 (100.0%) |
| 18 to 24 Years | 0 (0.0%) | 0 (0.0%) |
| 25 to 34 Years | 23 (44.2%) | 3 (8.3%) |
| 35 to 44 Years | 7 (20.0%) | 11 (26.8%) |
| 45 to 54 Years | 10 (38.5%) | 0 (0.0%) |
| 55 to 64 Years | 22 (37.9%) | 0 (0.0%) |
| 65 to 74 Years | 9 (47.4%) | 6 (27.3%) |
| 75 Years and over | 0 (0.0%) | 0 (0.0%) |
| Total | 95 (27.9%) | 65 (19.5%) |
Income Above Poverty by Sex and Age in Peterstown
According to the poverty statistics in Peterstown, males aged 6 to 11 years and females aged 15 years are the age groups that are most secure financially, with 100.0% of males and 100.0% of females in these age groups living above the poverty line.
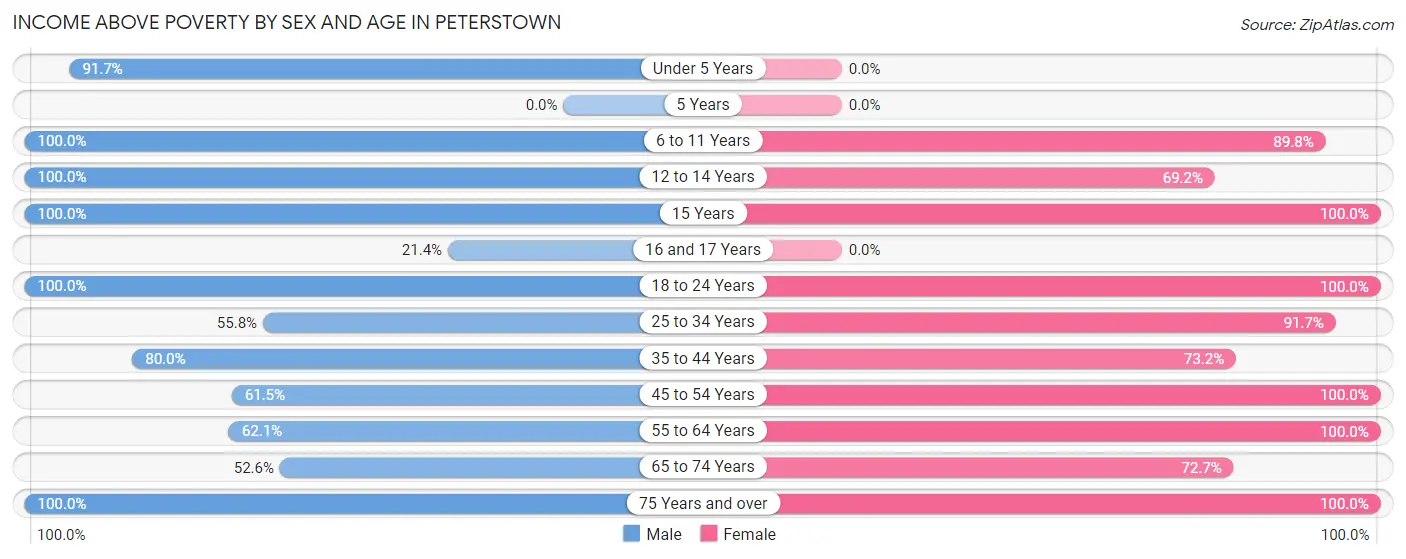
| Age Bracket | Male | Female |
| Under 5 Years | 22 (91.7%) | 0 (0.0%) |
| 5 Years | 0 (0.0%) | 0 (0.0%) |
| 6 to 11 Years | 13 (100.0%) | 44 (89.8%) |
| 12 to 14 Years | 21 (100.0%) | 27 (69.2%) |
| 15 Years | 32 (100.0%) | 25 (100.0%) |
| 16 and 17 Years | 6 (21.4%) | 0 (0.0%) |
| 18 to 24 Years | 15 (100.0%) | 9 (100.0%) |
| 25 to 34 Years | 29 (55.8%) | 33 (91.7%) |
| 35 to 44 Years | 28 (80.0%) | 30 (73.2%) |
| 45 to 54 Years | 16 (61.5%) | 7 (100.0%) |
| 55 to 64 Years | 36 (62.1%) | 35 (100.0%) |
| 65 to 74 Years | 10 (52.6%) | 16 (72.7%) |
| 75 Years and over | 17 (100.0%) | 42 (100.0%) |
| Total | 245 (72.1%) | 268 (80.5%) |
Income Below Poverty Among Married-Couple Families in Peterstown
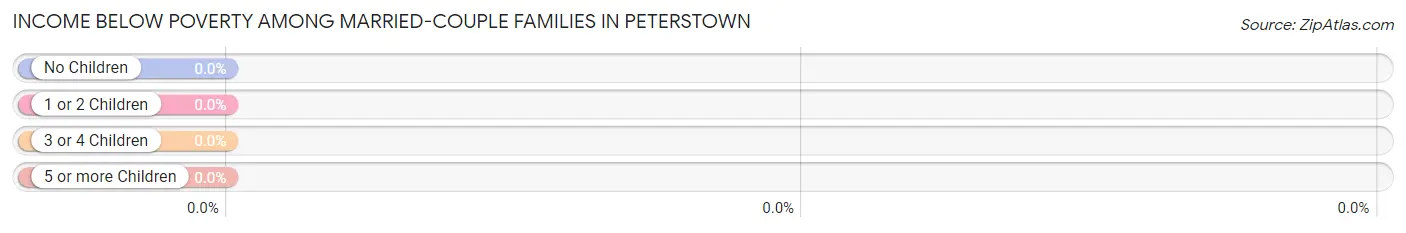
| Children | Above Poverty | Below Poverty |
| No Children | 29 (100.0%) | 0 (0.0%) |
| 1 or 2 Children | 16 (100.0%) | 0 (0.0%) |
| 3 or 4 Children | 16 (100.0%) | 0 (0.0%) |
| 5 or more Children | 0 (0.0%) | 0 (0.0%) |
| Total | 61 (100.0%) | 0 (0.0%) |
Income Below Poverty Among Single-Parent Households in Peterstown
According to the poverty data in Peterstown, 50.0% or 9 single-father households and 21.4% or 6 single-mother households are living below the poverty line. Among single-father households, those with 1 or 2 children have the highest poverty rate, with 6 households (100.0%) experiencing poverty. Likewise, among single-mother households, those with 1 or 2 children have the highest poverty rate, with 6 households (33.3%) falling below the poverty line.
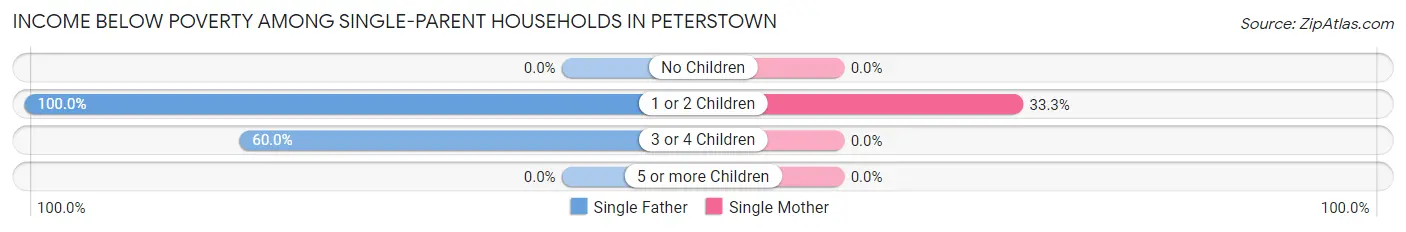
| Children | Single Father | Single Mother |
| No Children | 0 (0.0%) | 0 (0.0%) |
| 1 or 2 Children | 6 (100.0%) | 6 (33.3%) |
| 3 or 4 Children | 3 (60.0%) | 0 (0.0%) |
| 5 or more Children | 0 (0.0%) | 0 (0.0%) |
| Total | 9 (50.0%) | 6 (21.4%) |
Income Below Poverty Among Married-Couple vs Single-Parent Households in Peterstown
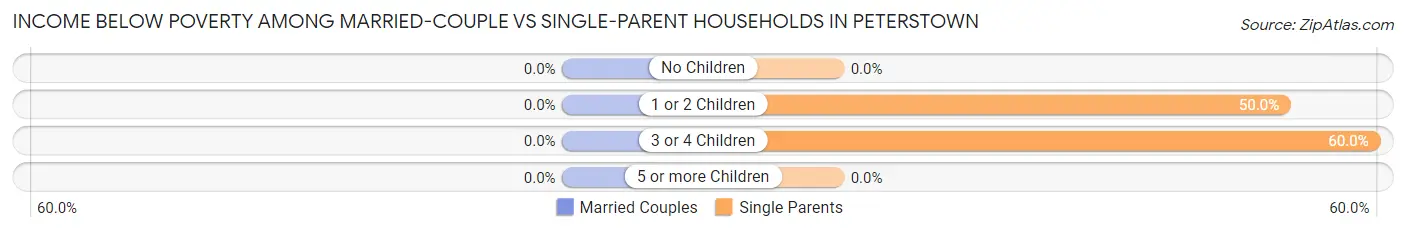
| Children | Married-Couple Families | Single-Parent Households |
| No Children | 0 (0.0%) | 0 (0.0%) |
| 1 or 2 Children | 0 (0.0%) | 12 (50.0%) |
| 3 or 4 Children | 0 (0.0%) | 3 (60.0%) |
| 5 or more Children | 0 (0.0%) | 0 (0.0%) |
| Total | 0 (0.0%) | 15 (32.6%) |
Employment Characteristics in Peterstown
Employment by Class of Employer in Peterstown
Among the 132 employed individuals in Peterstown, private company employees (115 | 87.1%), federal government employees (8 | 6.1%), and not-for-profit organizations (5 | 3.8%) make up the most common classes of employment.
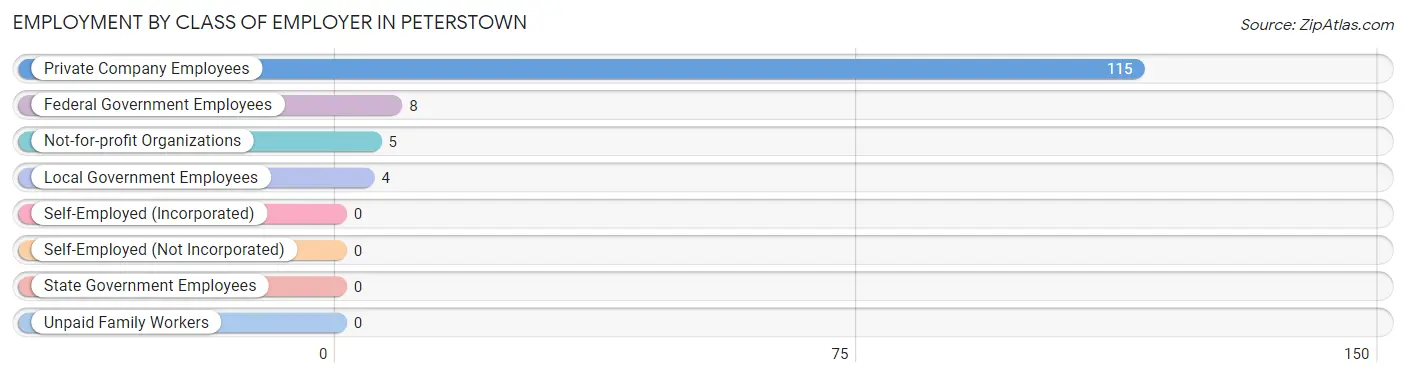
| Employer Class | # Employees | % Employees |
| Private Company Employees | 115 | 87.1% |
| Self-Employed (Incorporated) | 0 | 0.0% |
| Self-Employed (Not Incorporated) | 0 | 0.0% |
| Not-for-profit Organizations | 5 | 3.8% |
| Local Government Employees | 4 | 3.0% |
| State Government Employees | 0 | 0.0% |
| Federal Government Employees | 8 | 6.1% |
| Unpaid Family Workers | 0 | 0.0% |
| Total | 132 | 100.0% |
Employment Status by Age in Peterstown
According to the labor force statistics for Peterstown, out of the total population over 16 years of age (457), 32.4% or 148 individuals are in the labor force, with 10.8% or 16 of them unemployed. The age group with the highest labor force participation rate is 25 to 29 years, with 98.0% or 48 individuals in the labor force. Within the labor force, the 30 to 34 years age range has the highest percentage of unemployed individuals, with 53.6% or 15 of them being unemployed.
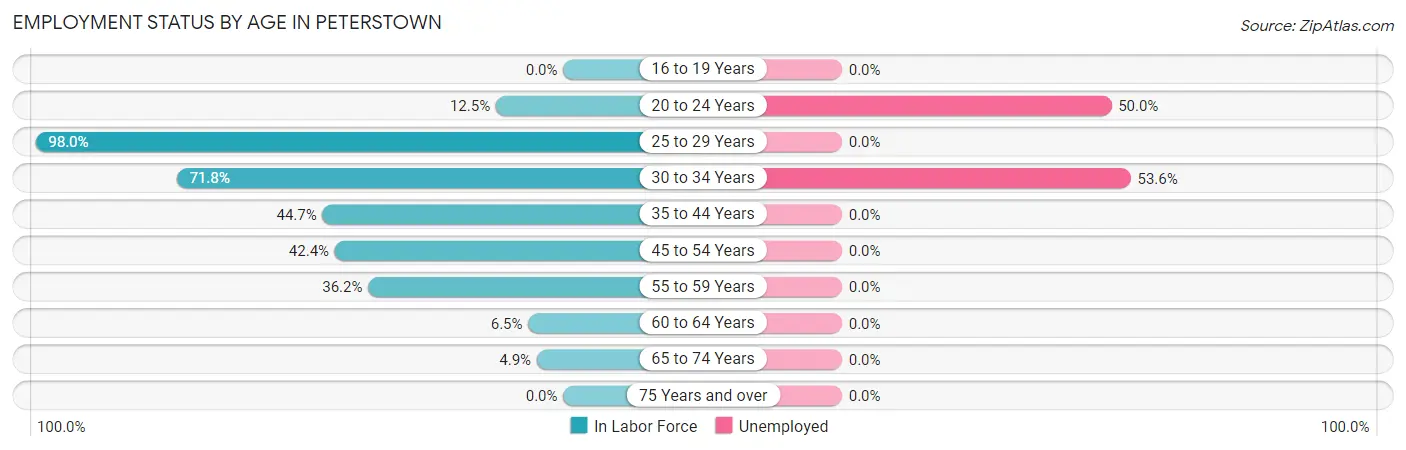
| Age Bracket | In Labor Force | Unemployed |
| 16 to 19 Years | 0 (0.0%) | 0 (0.0%) |
| 20 to 24 Years | 2 (12.5%) | 1 (50.0%) |
| 25 to 29 Years | 48 (98.0%) | 0 (0.0%) |
| 30 to 34 Years | 28 (71.8%) | 15 (53.6%) |
| 35 to 44 Years | 34 (44.7%) | 0 (0.0%) |
| 45 to 54 Years | 14 (42.4%) | 0 (0.0%) |
| 55 to 59 Years | 17 (36.2%) | 0 (0.0%) |
| 60 to 64 Years | 3 (6.5%) | 0 (0.0%) |
| 65 to 74 Years | 2 (4.9%) | 0 (0.0%) |
| 75 Years and over | 0 (0.0%) | 0 (0.0%) |
| Total | 148 (32.4%) | 16 (10.8%) |
Employment Status by Educational Attainment in Peterstown
According to labor force statistics for Peterstown, 49.7% of individuals (144) out of the total population between 25 and 64 years of age (290) are in the labor force, with 10.4% or 15 of them being unemployed. The group with the highest labor force participation rate are those with the educational attainment of college / associate degree, with 71.1% or 54 individuals in the labor force. Within the labor force, individuals with college / associate degree education have the highest percentage of unemployment, with 27.8% or 15 of them being unemployed.
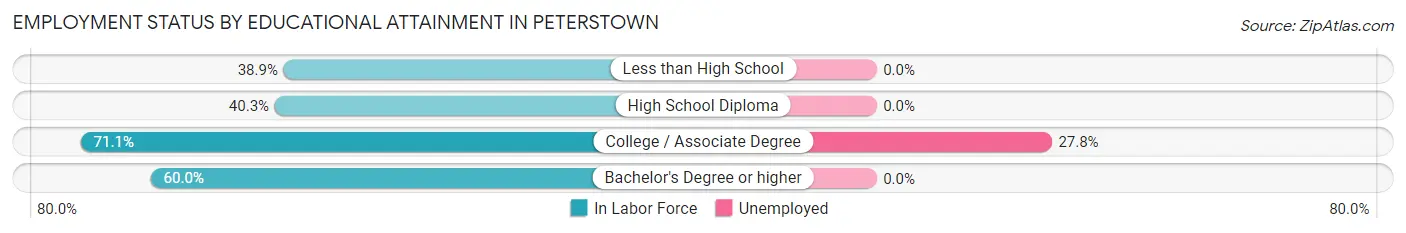
| Educational Attainment | In Labor Force | Unemployed |
| Less than High School | 7 (38.9%) | 0 (0.0%) |
| High School Diploma | 71 (40.3%) | 0 (0.0%) |
| College / Associate Degree | 54 (71.1%) | 21 (27.8%) |
| Bachelor's Degree or higher | 12 (60.0%) | 0 (0.0%) |
| Total | 144 (49.7%) | 30 (10.4%) |
Employment Occupations by Sex in Peterstown
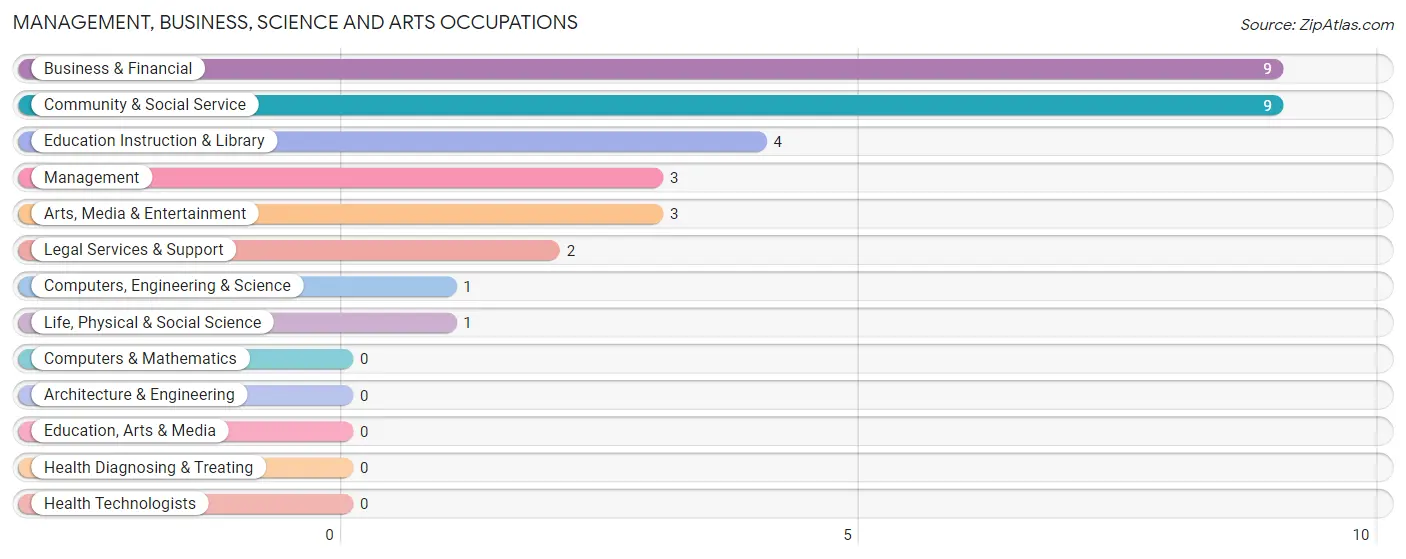
Management, Business, Science and Arts Occupations
The most common Management, Business, Science and Arts occupations in Peterstown are Business & Financial (9 | 6.8%), Community & Social Service (9 | 6.8%), Education Instruction & Library (4 | 3.0%), Management (3 | 2.3%), and Arts, Media & Entertainment (3 | 2.3%).
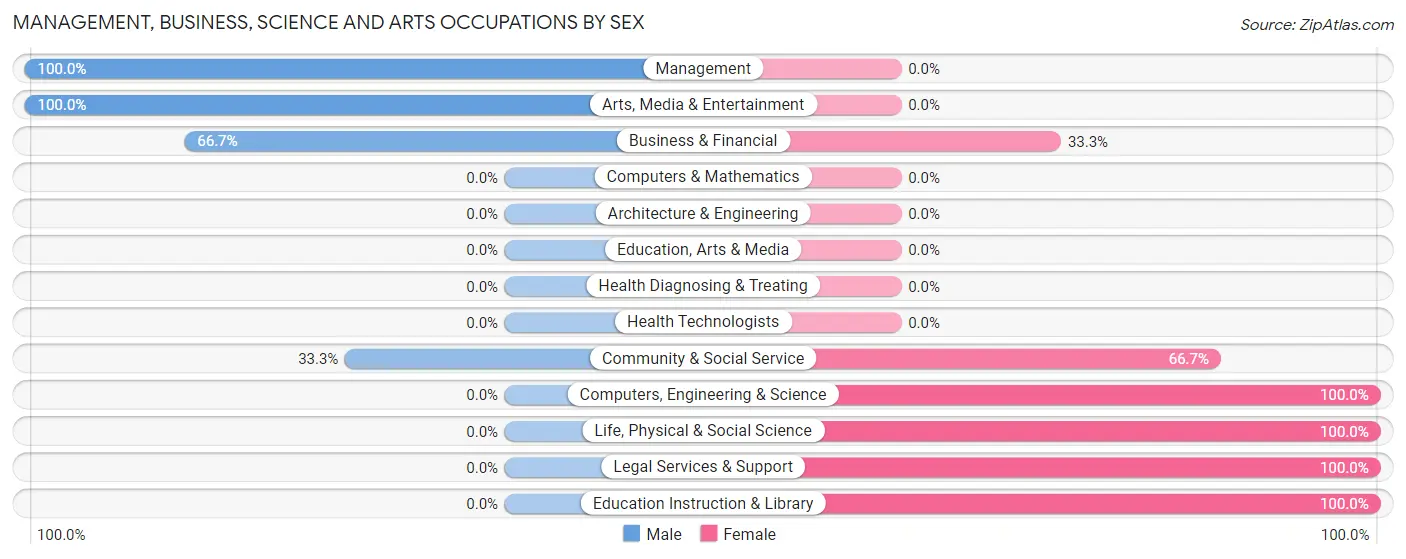
Management, Business, Science and Arts Occupations by Sex
Within the Management, Business, Science and Arts occupations in Peterstown, the most male-oriented occupations are Management (100.0%), Arts, Media & Entertainment (100.0%), and Business & Financial (66.7%), while the most female-oriented occupations are Computers, Engineering & Science (100.0%), Life, Physical & Social Science (100.0%), and Legal Services & Support (100.0%).
| Occupation | Male | Female |
| Management | 3 (100.0%) | 0 (0.0%) |
| Business & Financial | 6 (66.7%) | 3 (33.3%) |
| Computers, Engineering & Science | 0 (0.0%) | 1 (100.0%) |
| Computers & Mathematics | 0 (0.0%) | 0 (0.0%) |
| Architecture & Engineering | 0 (0.0%) | 0 (0.0%) |
| Life, Physical & Social Science | 0 (0.0%) | 1 (100.0%) |
| Community & Social Service | 3 (33.3%) | 6 (66.7%) |
| Education, Arts & Media | 0 (0.0%) | 0 (0.0%) |
| Legal Services & Support | 0 (0.0%) | 2 (100.0%) |
| Education Instruction & Library | 0 (0.0%) | 4 (100.0%) |
| Arts, Media & Entertainment | 3 (100.0%) | 0 (0.0%) |
| Health Diagnosing & Treating | 0 (0.0%) | 0 (0.0%) |
| Health Technologists | 0 (0.0%) | 0 (0.0%) |
| Total (Category) | 12 (54.5%) | 10 (45.5%) |
| Total (Overall) | 69 (52.3%) | 63 (47.7%) |
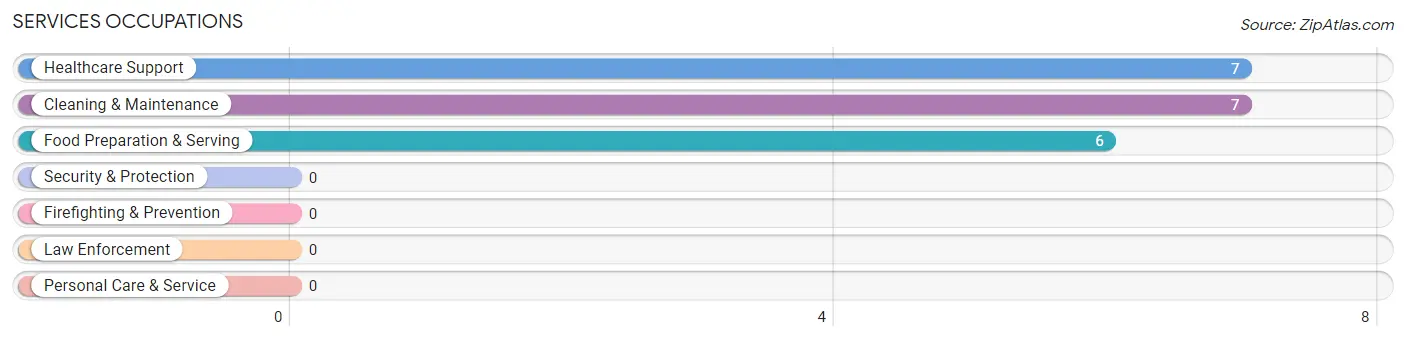
Services Occupations
The most common Services occupations in Peterstown are Healthcare Support (7 | 5.3%), Cleaning & Maintenance (7 | 5.3%), and Food Preparation & Serving (6 | 4.5%).
Services Occupations by Sex
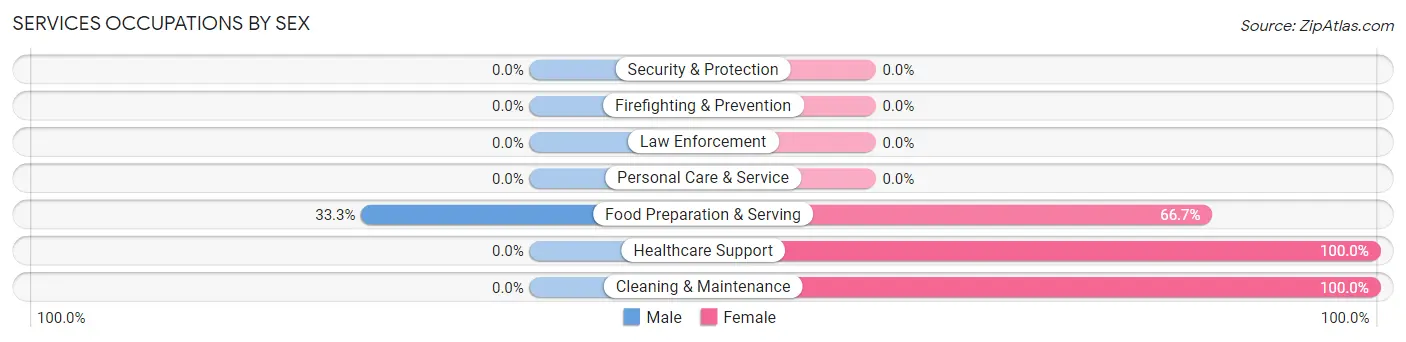
| Occupation | Male | Female |
| Healthcare Support | 0 (0.0%) | 7 (100.0%) |
| Security & Protection | 0 (0.0%) | 0 (0.0%) |
| Firefighting & Prevention | 0 (0.0%) | 0 (0.0%) |
| Law Enforcement | 0 (0.0%) | 0 (0.0%) |
| Food Preparation & Serving | 2 (33.3%) | 4 (66.7%) |
| Cleaning & Maintenance | 0 (0.0%) | 7 (100.0%) |
| Personal Care & Service | 0 (0.0%) | 0 (0.0%) |
| Total (Category) | 2 (10.0%) | 18 (90.0%) |
| Total (Overall) | 69 (52.3%) | 63 (47.7%) |
Sales and Office Occupations
The most common Sales and Office occupations in Peterstown are Sales & Related (16 | 12.1%), and Office & Administration (13 | 9.9%).
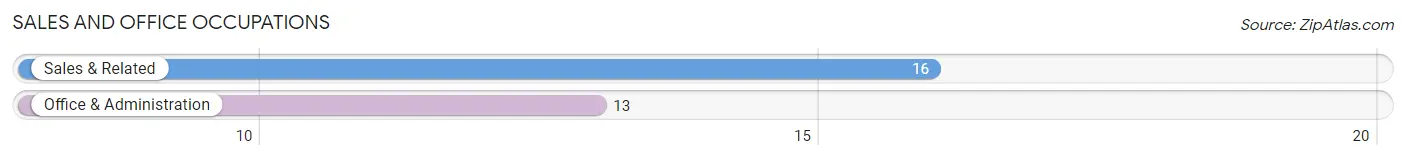
Sales and Office Occupations by Sex

| Occupation | Male | Female |
| Sales & Related | 16 (100.0%) | 0 (0.0%) |
| Office & Administration | 0 (0.0%) | 13 (100.0%) |
| Total (Category) | 16 (55.2%) | 13 (44.8%) |
| Total (Overall) | 69 (52.3%) | 63 (47.7%) |
Natural Resources, Construction and Maintenance Occupations
The most common Natural Resources, Construction and Maintenance occupations in Peterstown are Construction & Extraction (5 | 3.8%), and Installation, Maintenance & Repair (5 | 3.8%).
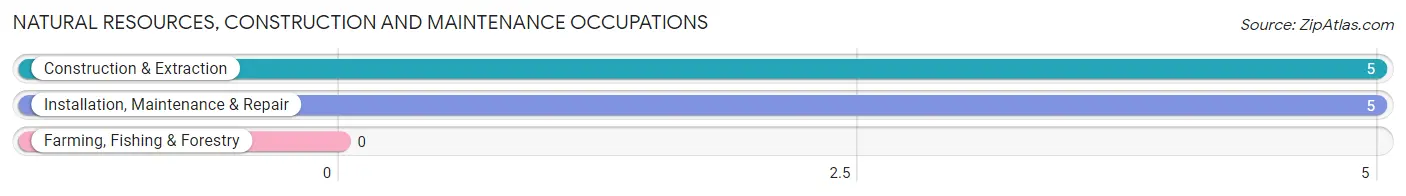
Natural Resources, Construction and Maintenance Occupations by Sex
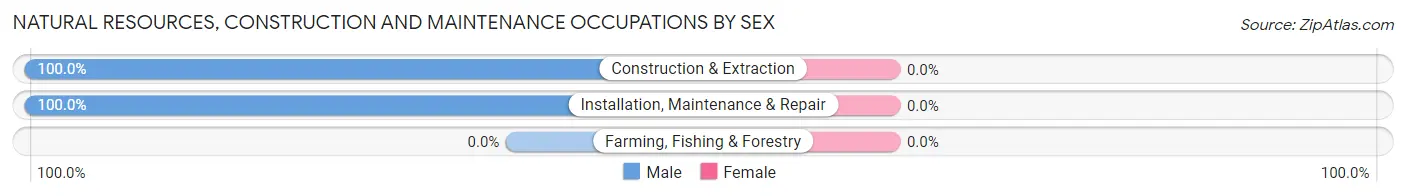
| Occupation | Male | Female |
| Farming, Fishing & Forestry | 0 (0.0%) | 0 (0.0%) |
| Construction & Extraction | 5 (100.0%) | 0 (0.0%) |
| Installation, Maintenance & Repair | 5 (100.0%) | 0 (0.0%) |
| Total (Category) | 10 (100.0%) | 0 (0.0%) |
| Total (Overall) | 69 (52.3%) | 63 (47.7%) |
Production, Transportation and Moving Occupations
The most common Production, Transportation and Moving occupations in Peterstown are Material Moving (20 | 15.1%), Transportation (17 | 12.9%), and Production (14 | 10.6%).
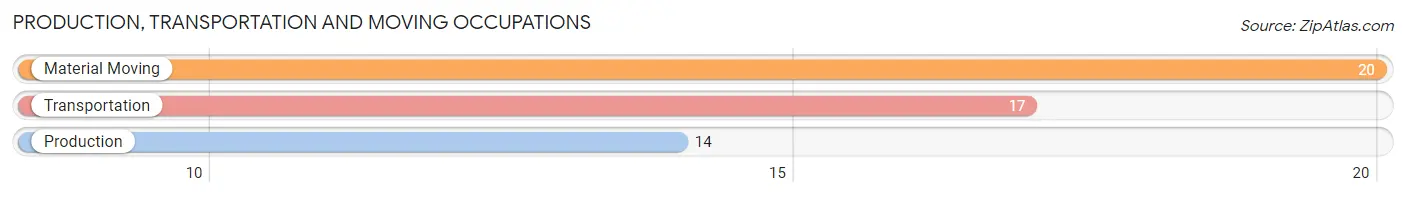
Production, Transportation and Moving Occupations by Sex
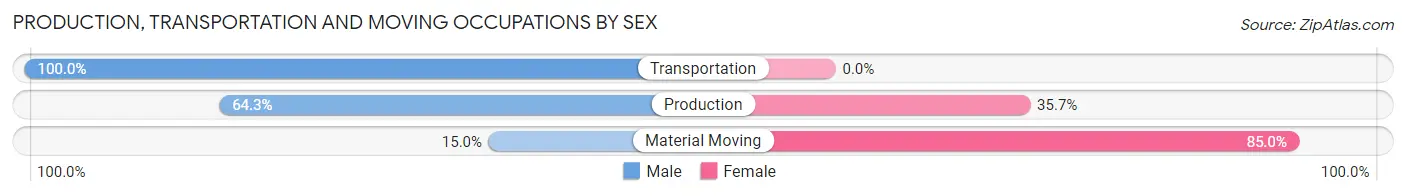
| Occupation | Male | Female |
| Production | 9 (64.3%) | 5 (35.7%) |
| Transportation | 17 (100.0%) | 0 (0.0%) |
| Material Moving | 3 (15.0%) | 17 (85.0%) |
| Total (Category) | 29 (56.9%) | 22 (43.1%) |
| Total (Overall) | 69 (52.3%) | 63 (47.7%) |
Employment Industries by Sex in Peterstown
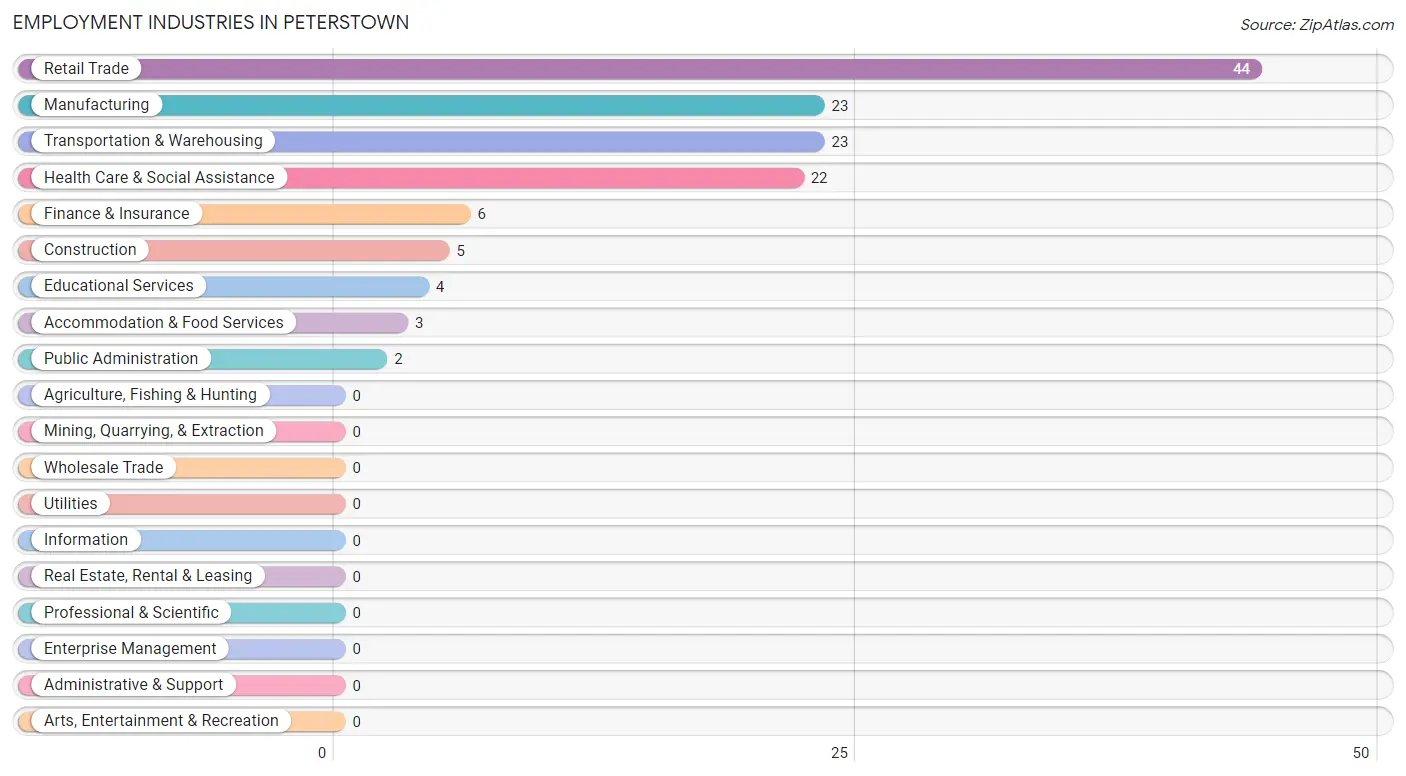
Employment Industries in Peterstown
The major employment industries in Peterstown include Retail Trade (44 | 33.3%), Manufacturing (23 | 17.4%), Transportation & Warehousing (23 | 17.4%), Health Care & Social Assistance (22 | 16.7%), and Finance & Insurance (6 | 4.5%).
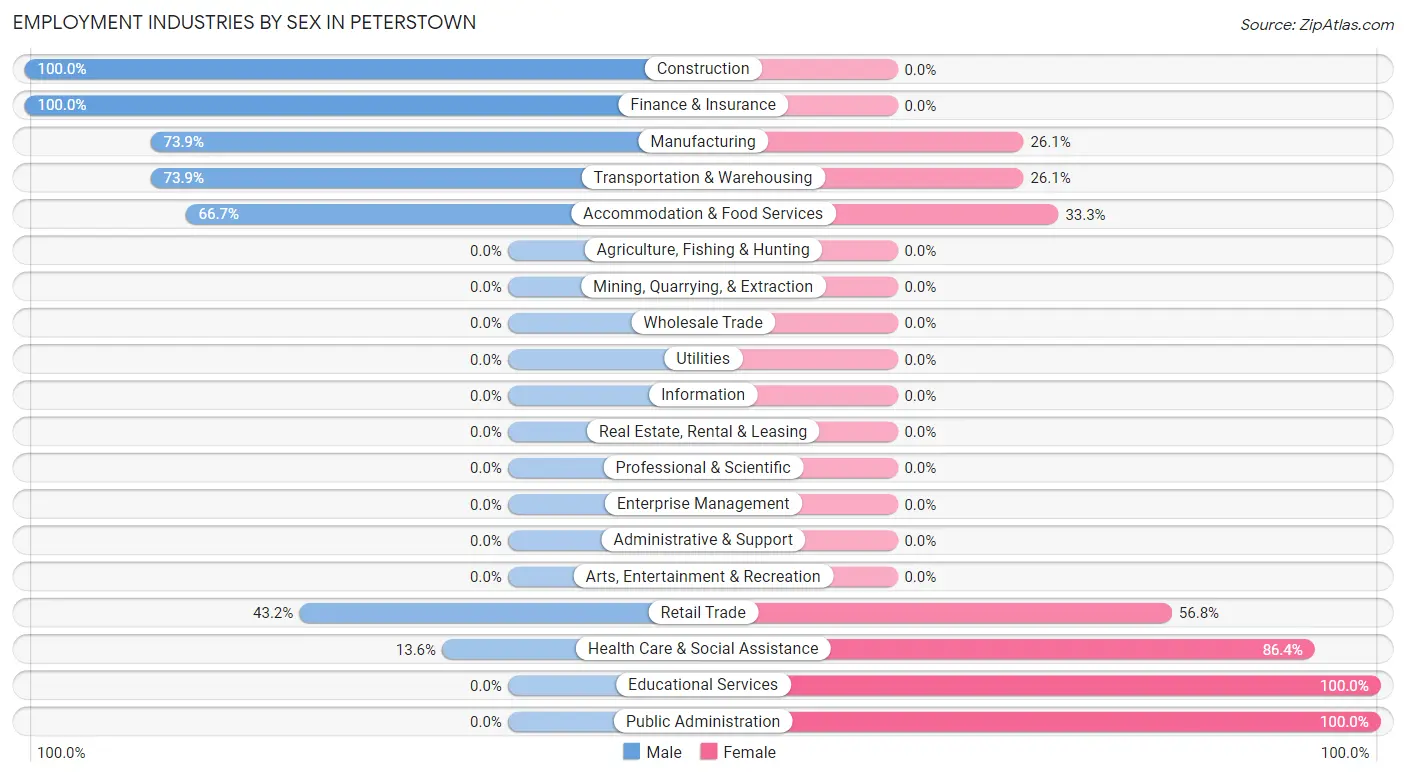
Employment Industries by Sex in Peterstown
The Peterstown industries that see more men than women are Construction (100.0%), Finance & Insurance (100.0%), and Manufacturing (73.9%), whereas the industries that tend to have a higher number of women are Educational Services (100.0%), Public Administration (100.0%), and Health Care & Social Assistance (86.4%).
| Industry | Male | Female |
| Agriculture, Fishing & Hunting | 0 (0.0%) | 0 (0.0%) |
| Mining, Quarrying, & Extraction | 0 (0.0%) | 0 (0.0%) |
| Construction | 5 (100.0%) | 0 (0.0%) |
| Manufacturing | 17 (73.9%) | 6 (26.1%) |
| Wholesale Trade | 0 (0.0%) | 0 (0.0%) |
| Retail Trade | 19 (43.2%) | 25 (56.8%) |
| Transportation & Warehousing | 17 (73.9%) | 6 (26.1%) |
| Utilities | 0 (0.0%) | 0 (0.0%) |
| Information | 0 (0.0%) | 0 (0.0%) |
| Finance & Insurance | 6 (100.0%) | 0 (0.0%) |
| Real Estate, Rental & Leasing | 0 (0.0%) | 0 (0.0%) |
| Professional & Scientific | 0 (0.0%) | 0 (0.0%) |
| Enterprise Management | 0 (0.0%) | 0 (0.0%) |
| Administrative & Support | 0 (0.0%) | 0 (0.0%) |
| Educational Services | 0 (0.0%) | 4 (100.0%) |
| Health Care & Social Assistance | 3 (13.6%) | 19 (86.4%) |
| Arts, Entertainment & Recreation | 0 (0.0%) | 0 (0.0%) |
| Accommodation & Food Services | 2 (66.7%) | 1 (33.3%) |
| Public Administration | 0 (0.0%) | 2 (100.0%) |
| Total | 69 (52.3%) | 63 (47.7%) |
Education in Peterstown
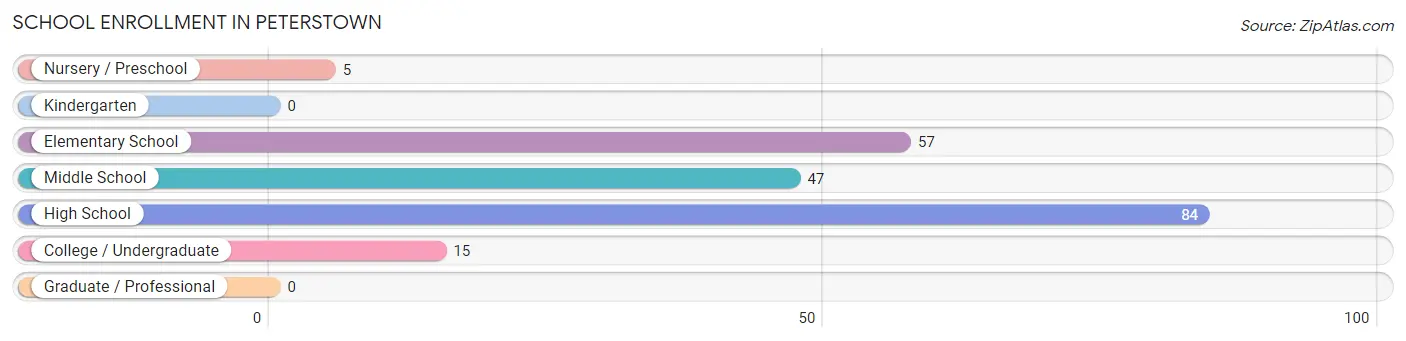
School Enrollment in Peterstown
The most common levels of schooling among the 208 students in Peterstown are high school (84 | 40.4%), elementary school (57 | 27.4%), and middle school (47 | 22.6%).
| School Level | # Students | % Students |
| Nursery / Preschool | 5 | 2.4% |
| Kindergarten | 0 | 0.0% |
| Elementary School | 57 | 27.4% |
| Middle School | 47 | 22.6% |
| High School | 84 | 40.4% |
| College / Undergraduate | 15 | 7.2% |
| Graduate / Professional | 0 | 0.0% |
| Total | 208 | 100.0% |
School Enrollment by Age by Funding Source in Peterstown
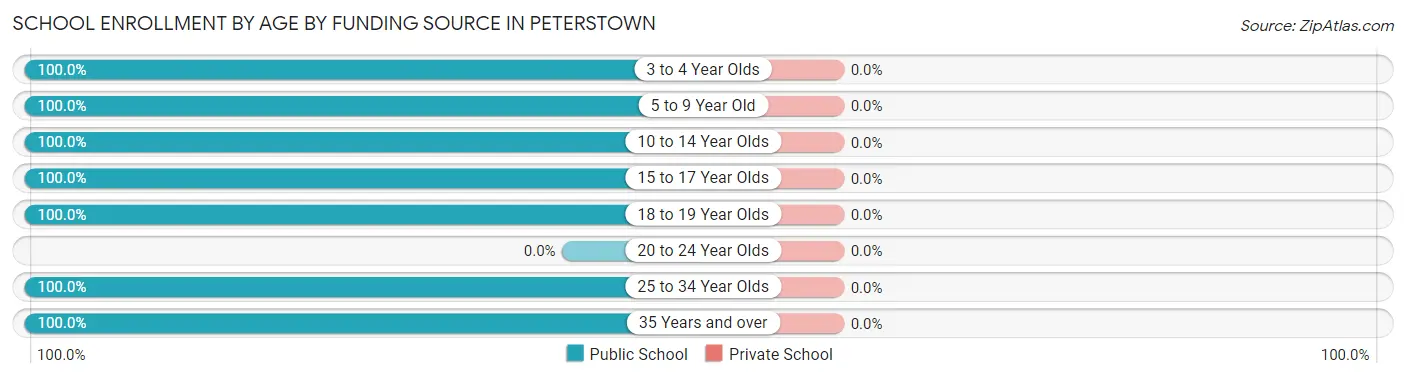
| Age Bracket | Public School | Private School |
| 3 to 4 Year Olds | 5 (100.0%) | 0 (0.0%) |
| 5 to 9 Year Old | 50 (100.0%) | 0 (0.0%) |
| 10 to 14 Year Olds | 54 (100.0%) | 0 (0.0%) |
| 15 to 17 Year Olds | 84 (100.0%) | 0 (0.0%) |
| 18 to 19 Year Olds | 8 (100.0%) | 0 (0.0%) |
| 20 to 24 Year Olds | 0 (0.0%) | 0 (0.0%) |
| 25 to 34 Year Olds | 6 (100.0%) | 0 (0.0%) |
| 35 Years and over | 1 (100.0%) | 0 (0.0%) |
| Total | 208 (100.0%) | 0 (0.0%) |
Educational Attainment by Field of Study in Peterstown
Education (23 | 43.4%), business (11 | 20.7%), literature & languages (7 | 13.2%), liberal arts & history (7 | 13.2%), and bio, nature & agricultural (3 | 5.7%) are the most common fields of study among 53 individuals in Peterstown who have obtained a bachelor's degree or higher.
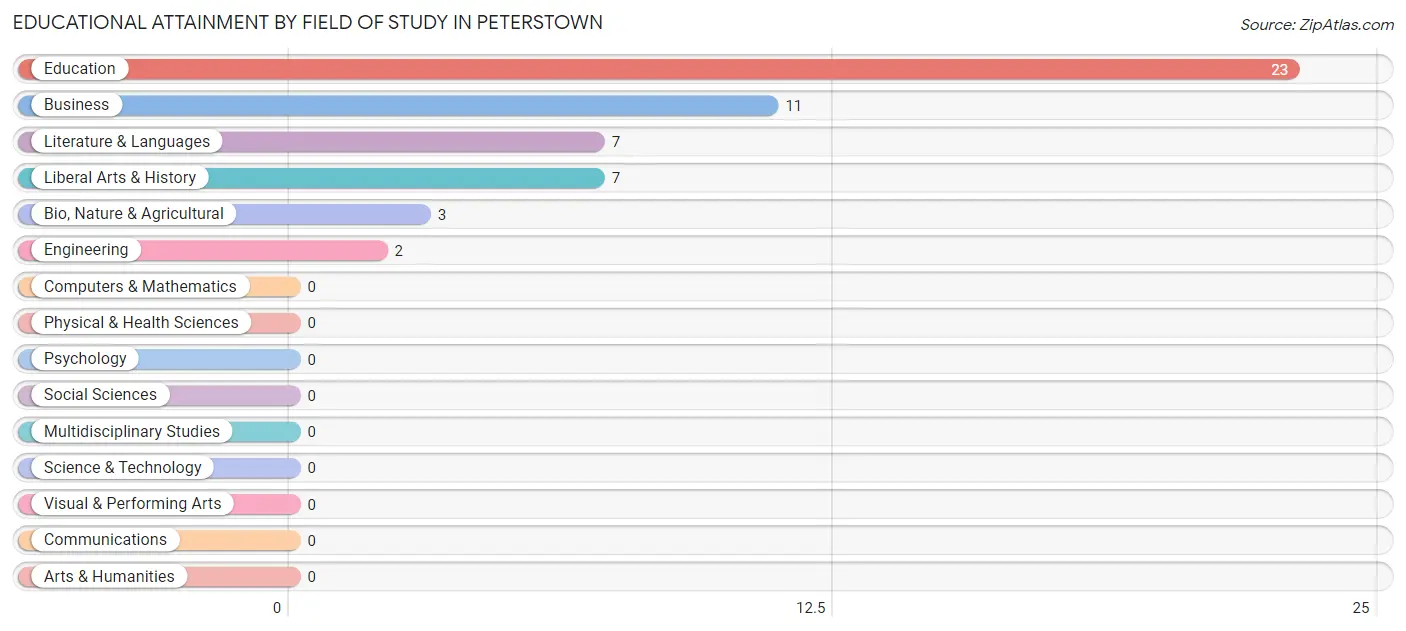
| Field of Study | # Graduates | % Graduates |
| Computers & Mathematics | 0 | 0.0% |
| Bio, Nature & Agricultural | 3 | 5.7% |
| Physical & Health Sciences | 0 | 0.0% |
| Psychology | 0 | 0.0% |
| Social Sciences | 0 | 0.0% |
| Engineering | 2 | 3.8% |
| Multidisciplinary Studies | 0 | 0.0% |
| Science & Technology | 0 | 0.0% |
| Business | 11 | 20.7% |
| Education | 23 | 43.4% |
| Literature & Languages | 7 | 13.2% |
| Liberal Arts & History | 7 | 13.2% |
| Visual & Performing Arts | 0 | 0.0% |
| Communications | 0 | 0.0% |
| Arts & Humanities | 0 | 0.0% |
| Total | 53 | 100.0% |
Transportation & Commute in Peterstown
Vehicle Availability by Sex in Peterstown
The most prevalent vehicle ownership categories in Peterstown are males with 1 vehicle (34, accounting for 49.3%) and females with 1 vehicle (9, making up 54.0%).
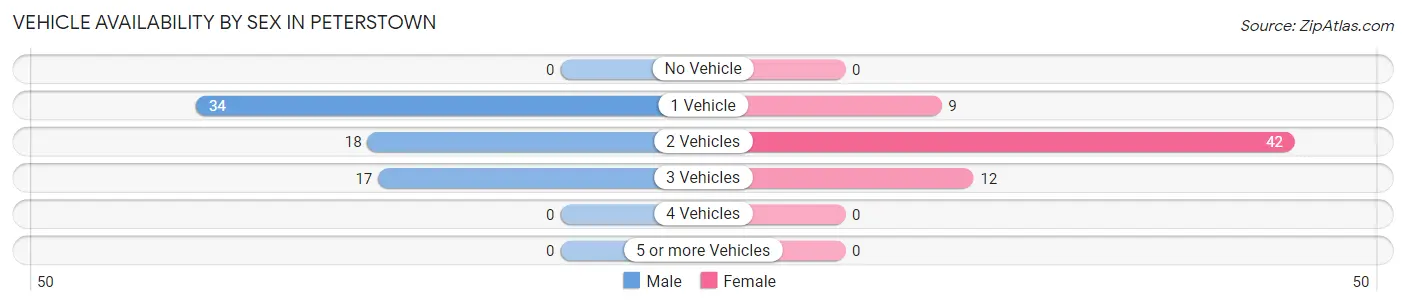
| Vehicles Available | Male | Female |
| No Vehicle | 0 (0.0%) | 0 (0.0%) |
| 1 Vehicle | 34 (49.3%) | 9 (14.3%) |
| 2 Vehicles | 18 (26.1%) | 42 (66.7%) |
| 3 Vehicles | 17 (24.6%) | 12 (19.1%) |
| 4 Vehicles | 0 (0.0%) | 0 (0.0%) |
| 5 or more Vehicles | 0 (0.0%) | 0 (0.0%) |
| Total | 69 (100.0%) | 63 (100.0%) |
Commute Time in Peterstown
The most frequently occuring commute durations in Peterstown are 5 to 9 minutes (25 commuters, 19.2%), 60 to 89 minutes (22 commuters, 16.9%), and less than 5 minutes (19 commuters, 14.6%).
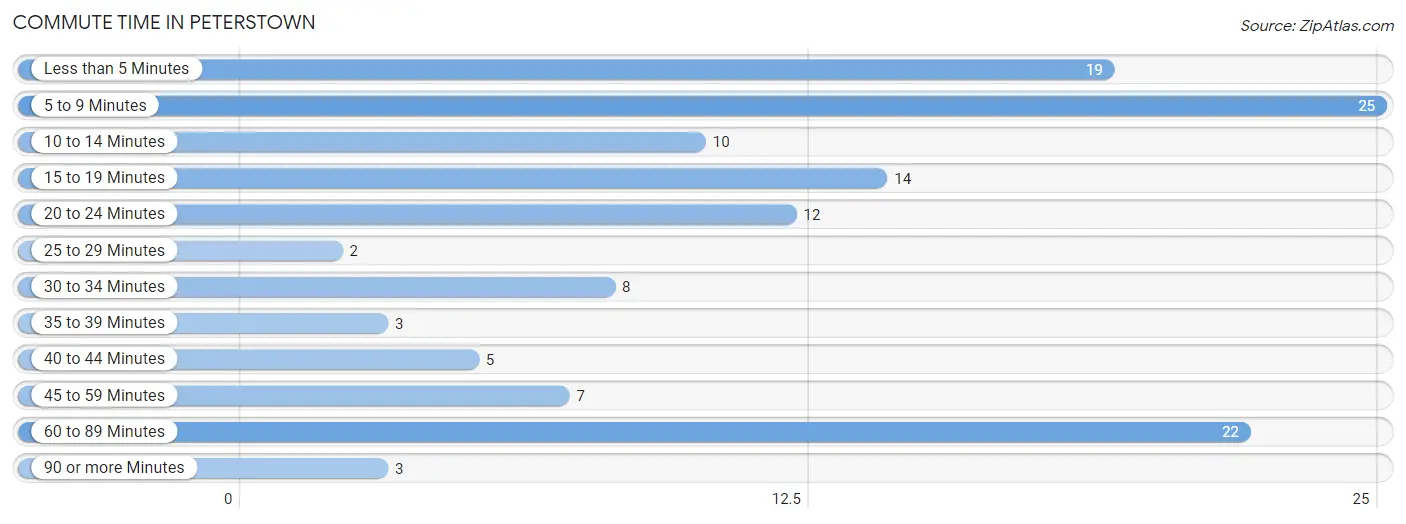
| Commute Time | # Commuters | % Commuters |
| Less than 5 Minutes | 19 | 14.6% |
| 5 to 9 Minutes | 25 | 19.2% |
| 10 to 14 Minutes | 10 | 7.7% |
| 15 to 19 Minutes | 14 | 10.8% |
| 20 to 24 Minutes | 12 | 9.2% |
| 25 to 29 Minutes | 2 | 1.5% |
| 30 to 34 Minutes | 8 | 6.1% |
| 35 to 39 Minutes | 3 | 2.3% |
| 40 to 44 Minutes | 5 | 3.8% |
| 45 to 59 Minutes | 7 | 5.4% |
| 60 to 89 Minutes | 22 | 16.9% |
| 90 or more Minutes | 3 | 2.3% |
Commute Time by Sex in Peterstown
The most common commute times in Peterstown are 5 to 9 minutes (16 commuters, 23.2%) for males and 60 to 89 minutes (17 commuters, 27.9%) for females.
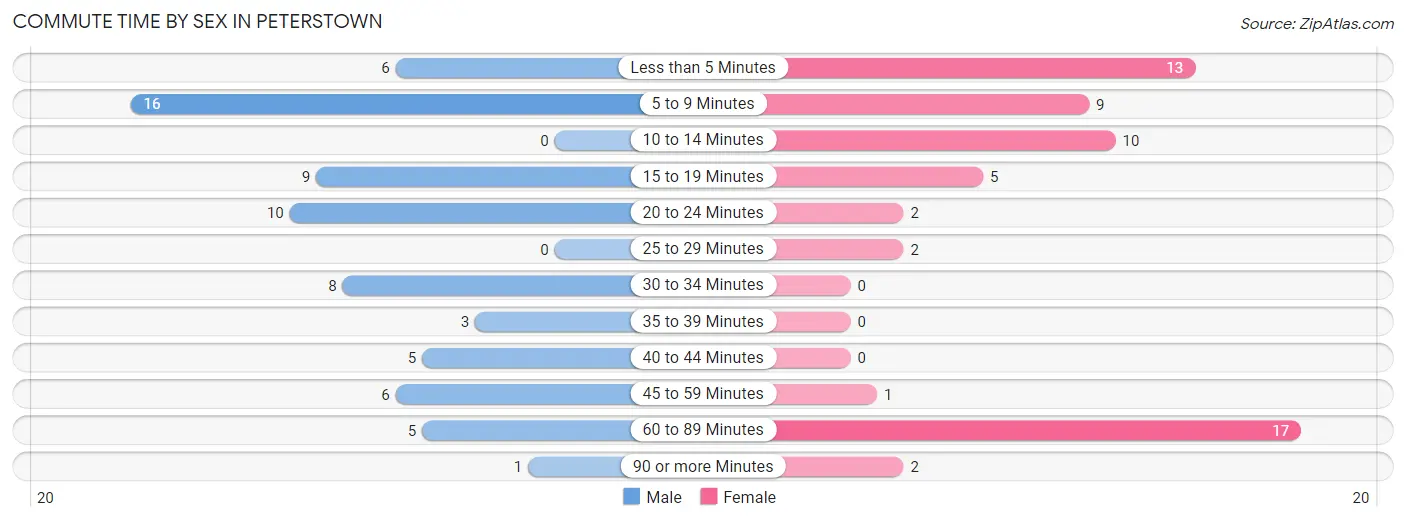
| Commute Time | Male | Female |
| Less than 5 Minutes | 6 (8.7%) | 13 (21.3%) |
| 5 to 9 Minutes | 16 (23.2%) | 9 (14.7%) |
| 10 to 14 Minutes | 0 (0.0%) | 10 (16.4%) |
| 15 to 19 Minutes | 9 (13.0%) | 5 (8.2%) |
| 20 to 24 Minutes | 10 (14.5%) | 2 (3.3%) |
| 25 to 29 Minutes | 0 (0.0%) | 2 (3.3%) |
| 30 to 34 Minutes | 8 (11.6%) | 0 (0.0%) |
| 35 to 39 Minutes | 3 (4.3%) | 0 (0.0%) |
| 40 to 44 Minutes | 5 (7.2%) | 0 (0.0%) |
| 45 to 59 Minutes | 6 (8.7%) | 1 (1.6%) |
| 60 to 89 Minutes | 5 (7.2%) | 17 (27.9%) |
| 90 or more Minutes | 1 (1.5%) | 2 (3.3%) |
Time of Departure to Work by Sex in Peterstown
The most frequent times of departure to work in Peterstown are 12:00 PM to 3:59 PM (18, 26.1%) for males and 10:00 AM to 10:59 AM (18, 29.5%) for females.
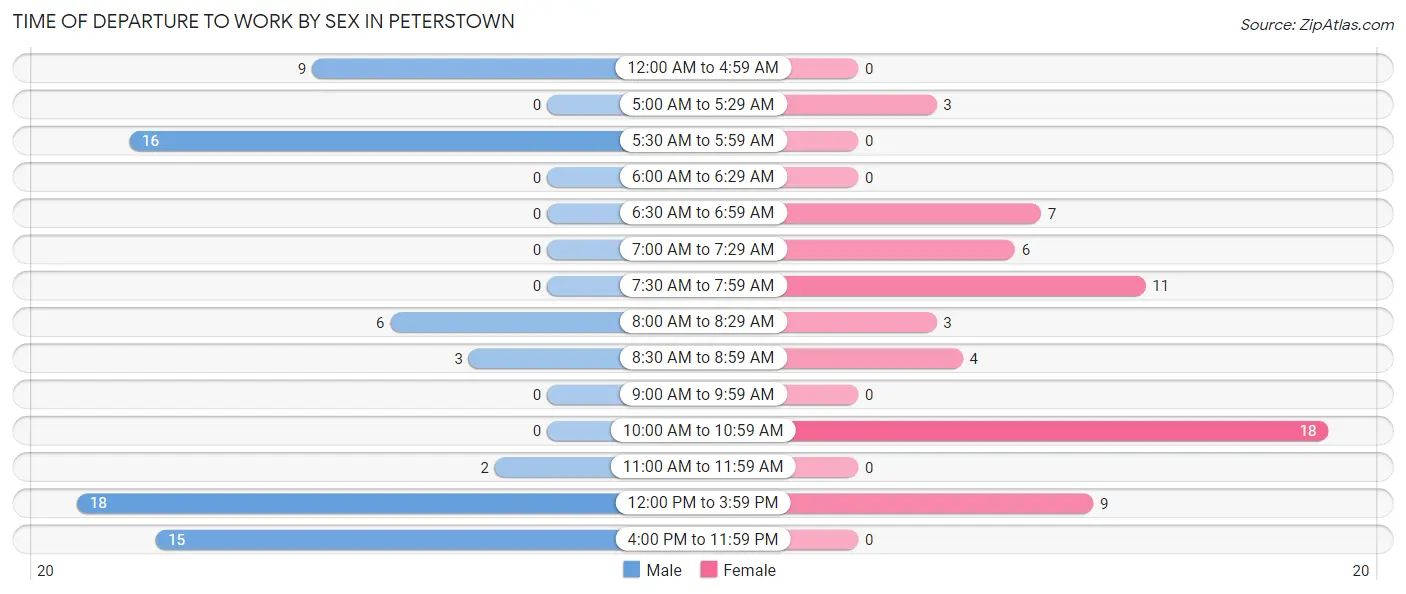
| Time of Departure | Male | Female |
| 12:00 AM to 4:59 AM | 9 (13.0%) | 0 (0.0%) |
| 5:00 AM to 5:29 AM | 0 (0.0%) | 3 (4.9%) |
| 5:30 AM to 5:59 AM | 16 (23.2%) | 0 (0.0%) |
| 6:00 AM to 6:29 AM | 0 (0.0%) | 0 (0.0%) |
| 6:30 AM to 6:59 AM | 0 (0.0%) | 7 (11.5%) |
| 7:00 AM to 7:29 AM | 0 (0.0%) | 6 (9.8%) |
| 7:30 AM to 7:59 AM | 0 (0.0%) | 11 (18.0%) |
| 8:00 AM to 8:29 AM | 6 (8.7%) | 3 (4.9%) |
| 8:30 AM to 8:59 AM | 3 (4.3%) | 4 (6.6%) |
| 9:00 AM to 9:59 AM | 0 (0.0%) | 0 (0.0%) |
| 10:00 AM to 10:59 AM | 0 (0.0%) | 18 (29.5%) |
| 11:00 AM to 11:59 AM | 2 (2.9%) | 0 (0.0%) |
| 12:00 PM to 3:59 PM | 18 (26.1%) | 9 (14.7%) |
| 4:00 PM to 11:59 PM | 15 (21.7%) | 0 (0.0%) |
| Total | 69 (100.0%) | 61 (100.0%) |
Housing Occupancy in Peterstown
Occupancy by Ownership in Peterstown
Of the total 204 dwellings in Peterstown, owner-occupied units account for 153 (75.0%), while renter-occupied units make up 51 (25.0%).
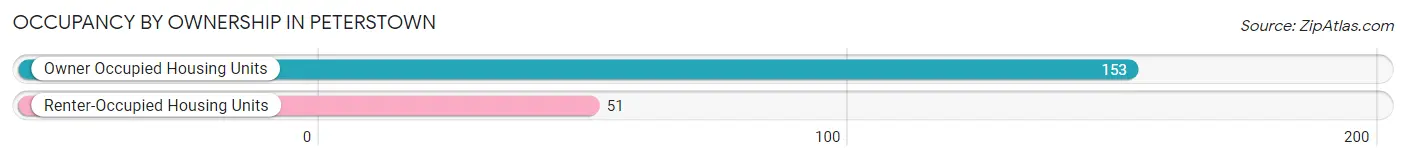
| Occupancy | # Housing Units | % Housing Units |
| Owner Occupied Housing Units | 153 | 75.0% |
| Renter-Occupied Housing Units | 51 | 25.0% |
| Total Occupied Housing Units | 204 | 100.0% |
Occupancy by Household Size in Peterstown
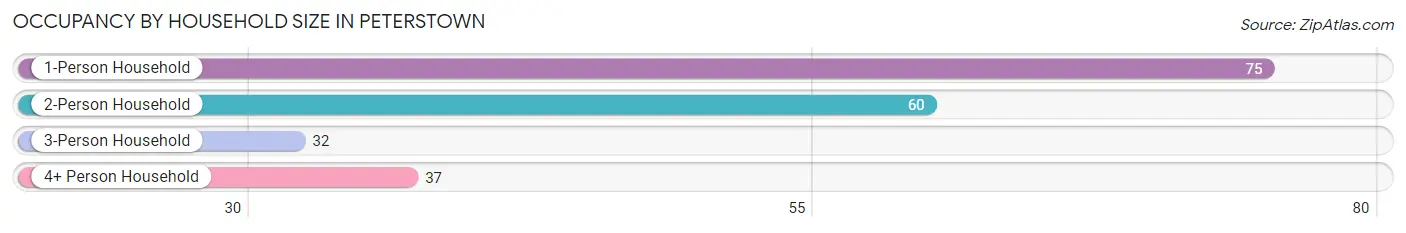
| Household Size | # Housing Units | % Housing Units |
| 1-Person Household | 75 | 36.8% |
| 2-Person Household | 60 | 29.4% |
| 3-Person Household | 32 | 15.7% |
| 4+ Person Household | 37 | 18.1% |
| Total Housing Units | 204 | 100.0% |
Occupancy by Ownership by Household Size in Peterstown
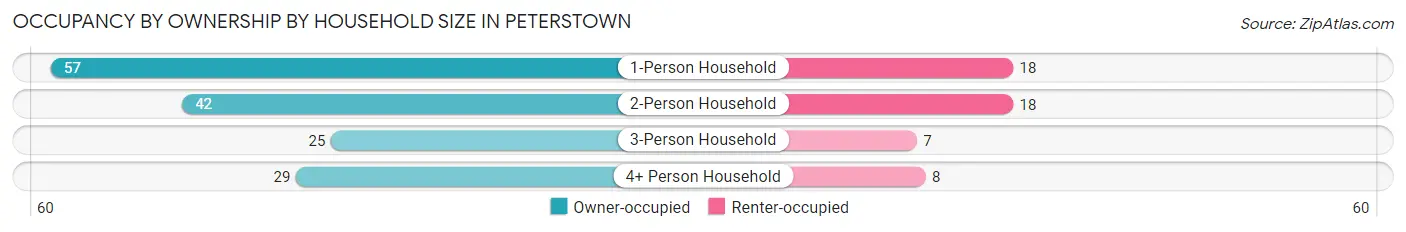
| Household Size | Owner-occupied | Renter-occupied |
| 1-Person Household | 57 (76.0%) | 18 (24.0%) |
| 2-Person Household | 42 (70.0%) | 18 (30.0%) |
| 3-Person Household | 25 (78.1%) | 7 (21.9%) |
| 4+ Person Household | 29 (78.4%) | 8 (21.6%) |
| Total Housing Units | 153 (75.0%) | 51 (25.0%) |
Occupancy by Educational Attainment in Peterstown
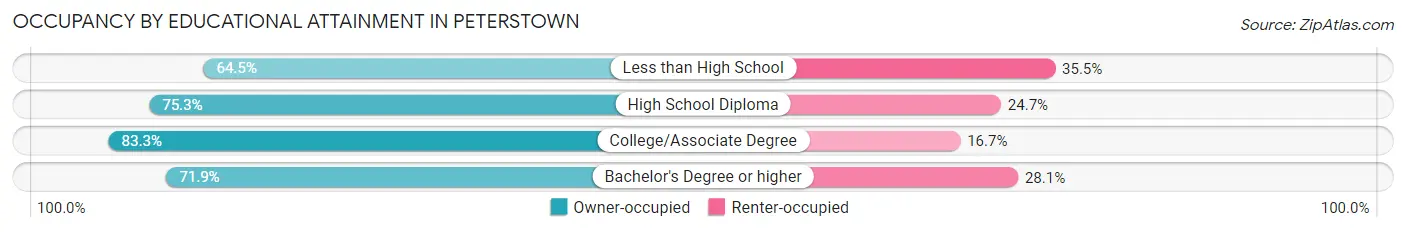
| Household Size | Owner-occupied | Renter-occupied |
| Less than High School | 20 (64.5%) | 11 (35.5%) |
| High School Diploma | 70 (75.3%) | 23 (24.7%) |
| College/Associate Degree | 40 (83.3%) | 8 (16.7%) |
| Bachelor's Degree or higher | 23 (71.9%) | 9 (28.1%) |
Occupancy by Age of Householder in Peterstown
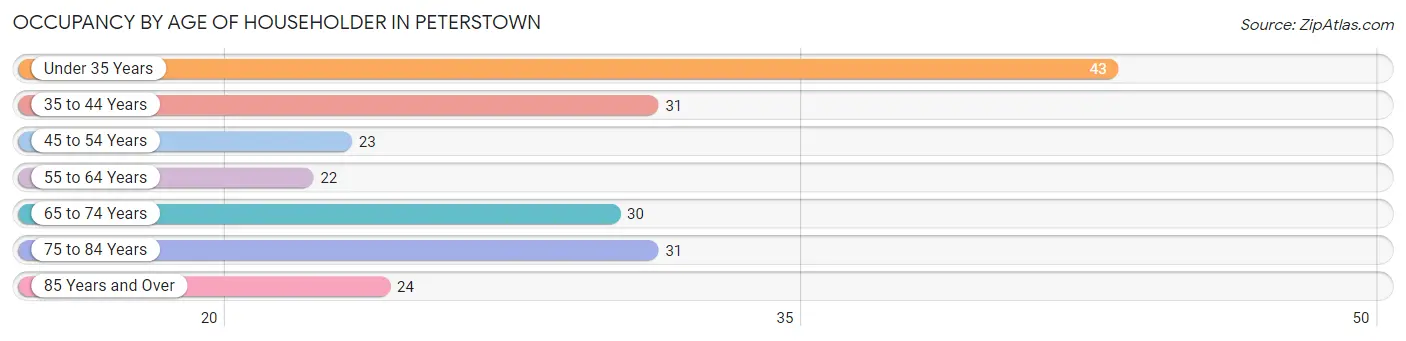
| Age Bracket | # Households | % Households |
| Under 35 Years | 43 | 21.1% |
| 35 to 44 Years | 31 | 15.2% |
| 45 to 54 Years | 23 | 11.3% |
| 55 to 64 Years | 22 | 10.8% |
| 65 to 74 Years | 30 | 14.7% |
| 75 to 84 Years | 31 | 15.2% |
| 85 Years and Over | 24 | 11.8% |
| Total | 204 | 100.0% |
Housing Finances in Peterstown
Median Income by Occupancy in Peterstown
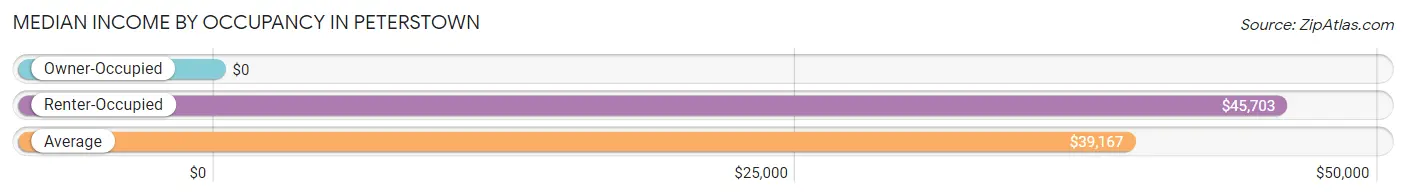
| Occupancy Type | # Households | Median Income |
| Owner-Occupied | 153 (75.0%) | $0 |
| Renter-Occupied | 51 (25.0%) | $45,703 |
| Average | 204 (100.0%) | $39,167 |
Occupancy by Householder Income Bracket in Peterstown
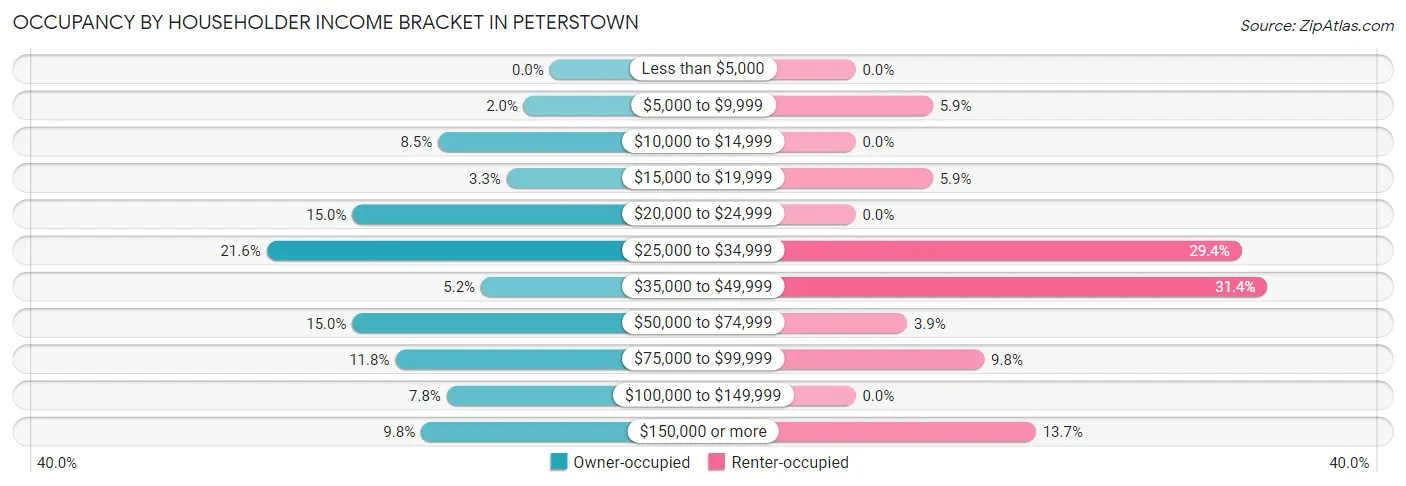
| Income Bracket | Owner-occupied | Renter-occupied |
| Less than $5,000 | 0 (0.0%) | 0 (0.0%) |
| $5,000 to $9,999 | 3 (2.0%) | 3 (5.9%) |
| $10,000 to $14,999 | 13 (8.5%) | 0 (0.0%) |
| $15,000 to $19,999 | 5 (3.3%) | 3 (5.9%) |
| $20,000 to $24,999 | 23 (15.0%) | 0 (0.0%) |
| $25,000 to $34,999 | 33 (21.6%) | 15 (29.4%) |
| $35,000 to $49,999 | 8 (5.2%) | 16 (31.4%) |
| $50,000 to $74,999 | 23 (15.0%) | 2 (3.9%) |
| $75,000 to $99,999 | 18 (11.8%) | 5 (9.8%) |
| $100,000 to $149,999 | 12 (7.8%) | 0 (0.0%) |
| $150,000 or more | 15 (9.8%) | 7 (13.7%) |
| Total | 153 (100.0%) | 51 (100.0%) |
Monthly Housing Cost Tiers in Peterstown
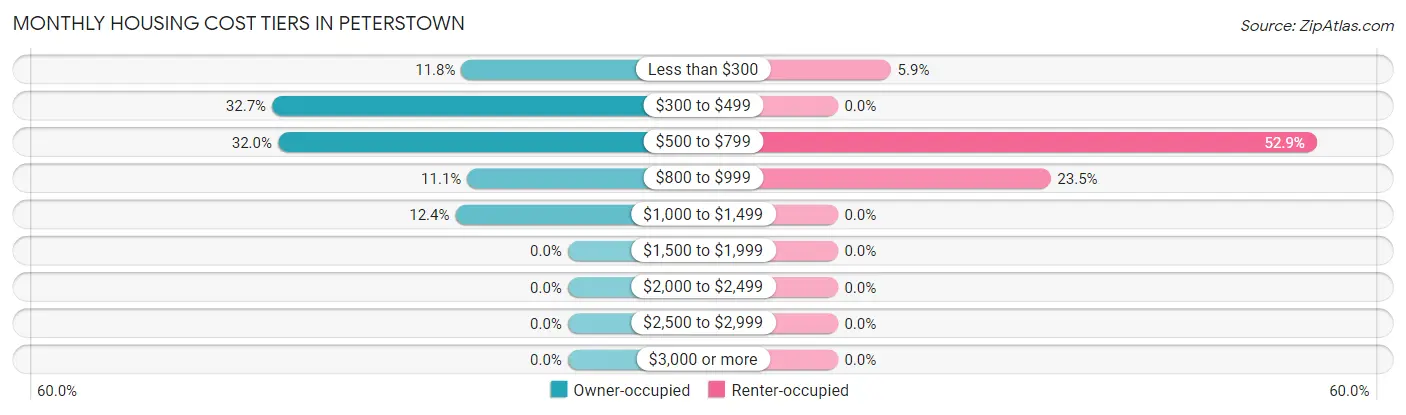
| Monthly Cost | Owner-occupied | Renter-occupied |
| Less than $300 | 18 (11.8%) | 3 (5.9%) |
| $300 to $499 | 50 (32.7%) | 0 (0.0%) |
| $500 to $799 | 49 (32.0%) | 27 (52.9%) |
| $800 to $999 | 17 (11.1%) | 12 (23.5%) |
| $1,000 to $1,499 | 19 (12.4%) | 0 (0.0%) |
| $1,500 to $1,999 | 0 (0.0%) | 0 (0.0%) |
| $2,000 to $2,499 | 0 (0.0%) | 0 (0.0%) |
| $2,500 to $2,999 | 0 (0.0%) | 0 (0.0%) |
| $3,000 or more | 0 (0.0%) | 0 (0.0%) |
| Total | 153 (100.0%) | 51 (100.0%) |
Physical Housing Characteristics in Peterstown
Housing Structures in Peterstown
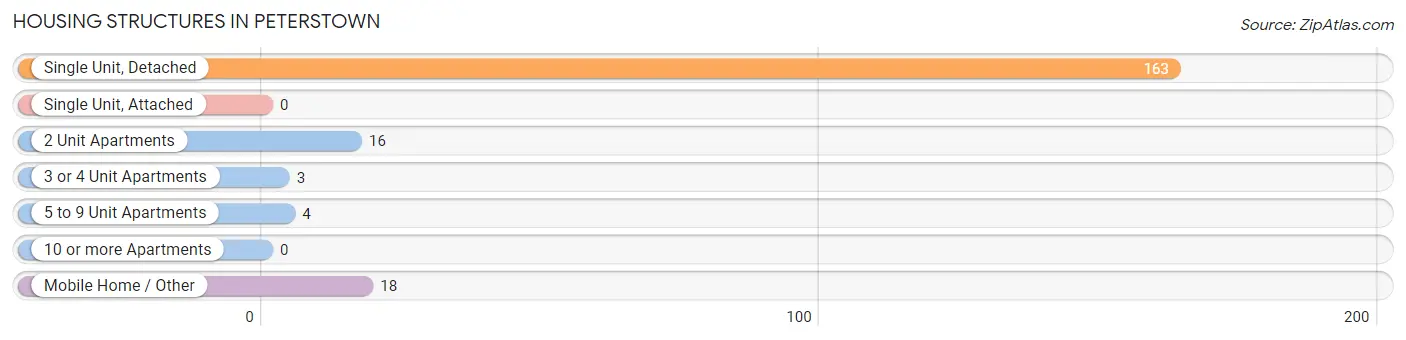
| Structure Type | # Housing Units | % Housing Units |
| Single Unit, Detached | 163 | 79.9% |
| Single Unit, Attached | 0 | 0.0% |
| 2 Unit Apartments | 16 | 7.8% |
| 3 or 4 Unit Apartments | 3 | 1.5% |
| 5 to 9 Unit Apartments | 4 | 2.0% |
| 10 or more Apartments | 0 | 0.0% |
| Mobile Home / Other | 18 | 8.8% |
| Total | 204 | 100.0% |
Housing Structures by Occupancy in Peterstown
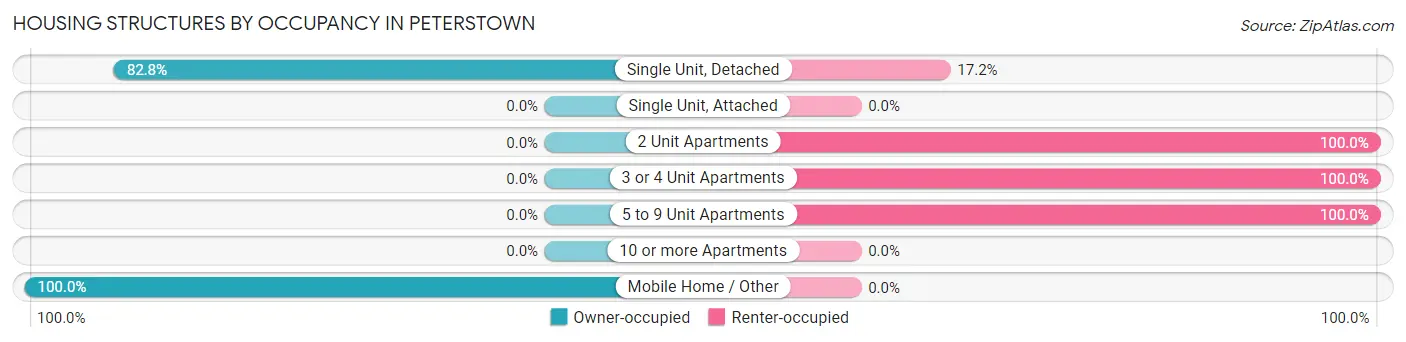
| Structure Type | Owner-occupied | Renter-occupied |
| Single Unit, Detached | 135 (82.8%) | 28 (17.2%) |
| Single Unit, Attached | 0 (0.0%) | 0 (0.0%) |
| 2 Unit Apartments | 0 (0.0%) | 16 (100.0%) |
| 3 or 4 Unit Apartments | 0 (0.0%) | 3 (100.0%) |
| 5 to 9 Unit Apartments | 0 (0.0%) | 4 (100.0%) |
| 10 or more Apartments | 0 (0.0%) | 0 (0.0%) |
| Mobile Home / Other | 18 (100.0%) | 0 (0.0%) |
| Total | 153 (75.0%) | 51 (25.0%) |
Housing Structures by Number of Rooms in Peterstown
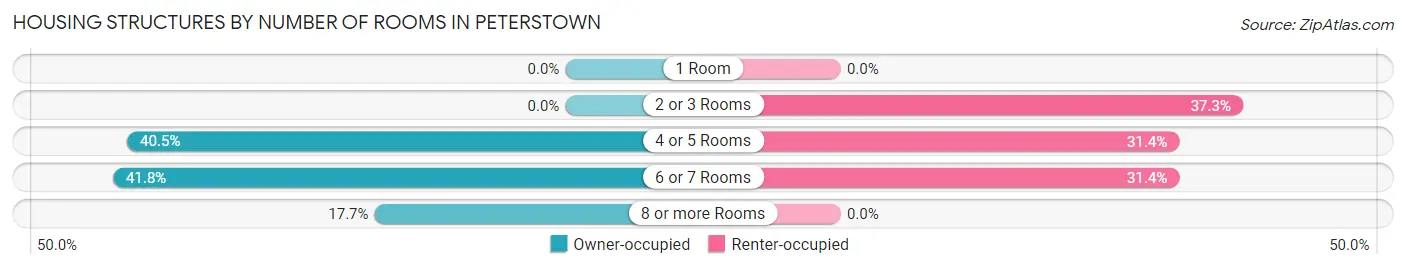
| Number of Rooms | Owner-occupied | Renter-occupied |
| 1 Room | 0 (0.0%) | 0 (0.0%) |
| 2 or 3 Rooms | 0 (0.0%) | 19 (37.2%) |
| 4 or 5 Rooms | 62 (40.5%) | 16 (31.4%) |
| 6 or 7 Rooms | 64 (41.8%) | 16 (31.4%) |
| 8 or more Rooms | 27 (17.6%) | 0 (0.0%) |
| Total | 153 (100.0%) | 51 (100.0%) |
Housing Structure by Heating Type in Peterstown
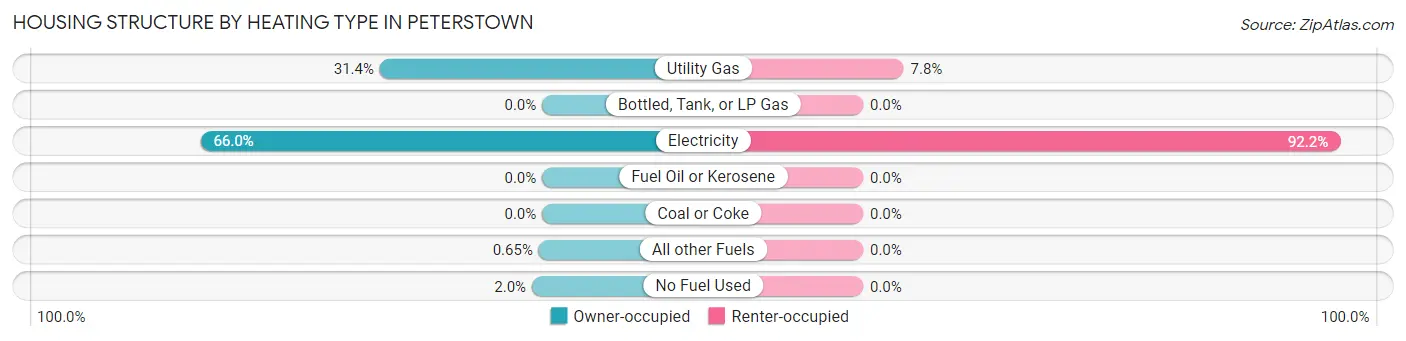
| Heating Type | Owner-occupied | Renter-occupied |
| Utility Gas | 48 (31.4%) | 4 (7.8%) |
| Bottled, Tank, or LP Gas | 0 (0.0%) | 0 (0.0%) |
| Electricity | 101 (66.0%) | 47 (92.2%) |
| Fuel Oil or Kerosene | 0 (0.0%) | 0 (0.0%) |
| Coal or Coke | 0 (0.0%) | 0 (0.0%) |
| All other Fuels | 1 (0.6%) | 0 (0.0%) |
| No Fuel Used | 3 (2.0%) | 0 (0.0%) |
| Total | 153 (100.0%) | 51 (100.0%) |
Household Vehicle Usage in Peterstown
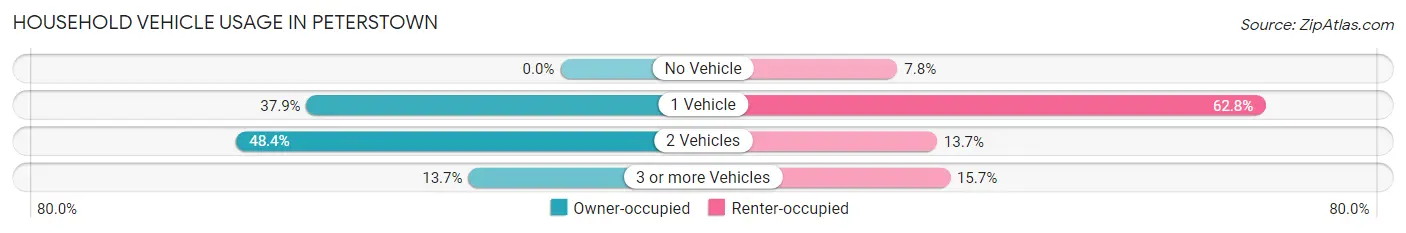
| Vehicles per Household | Owner-occupied | Renter-occupied |
| No Vehicle | 0 (0.0%) | 4 (7.8%) |
| 1 Vehicle | 58 (37.9%) | 32 (62.7%) |
| 2 Vehicles | 74 (48.4%) | 7 (13.7%) |
| 3 or more Vehicles | 21 (13.7%) | 8 (15.7%) |
| Total | 153 (100.0%) | 51 (100.0%) |
Real Estate & Mortgages in Peterstown
Real Estate and Mortgage Overview in Peterstown
| Characteristic | Without Mortgage | With Mortgage |
| Housing Units | 106 | 47 |
| Median Property Value | $117,500 | $112,500 |
| Median Household Income | $31,071 | $0 |
| Monthly Housing Costs | $444 | $0 |
| Real Estate Taxes | $571 | $0 |
Property Value by Mortgage Status in Peterstown
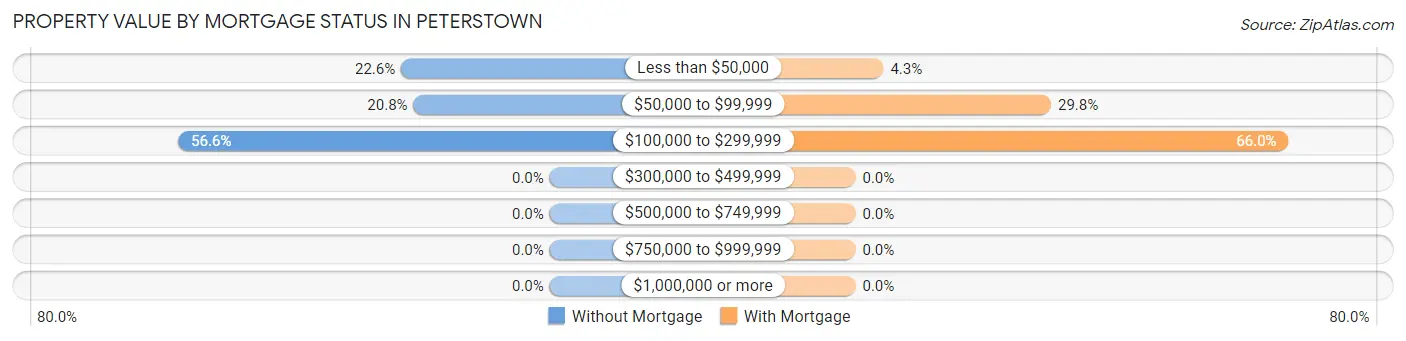
| Property Value | Without Mortgage | With Mortgage |
| Less than $50,000 | 24 (22.6%) | 2 (4.3%) |
| $50,000 to $99,999 | 22 (20.7%) | 14 (29.8%) |
| $100,000 to $299,999 | 60 (56.6%) | 31 (66.0%) |
| $300,000 to $499,999 | 0 (0.0%) | 0 (0.0%) |
| $500,000 to $749,999 | 0 (0.0%) | 0 (0.0%) |
| $750,000 to $999,999 | 0 (0.0%) | 0 (0.0%) |
| $1,000,000 or more | 0 (0.0%) | 0 (0.0%) |
| Total | 106 (100.0%) | 47 (100.0%) |
Household Income by Mortgage Status in Peterstown
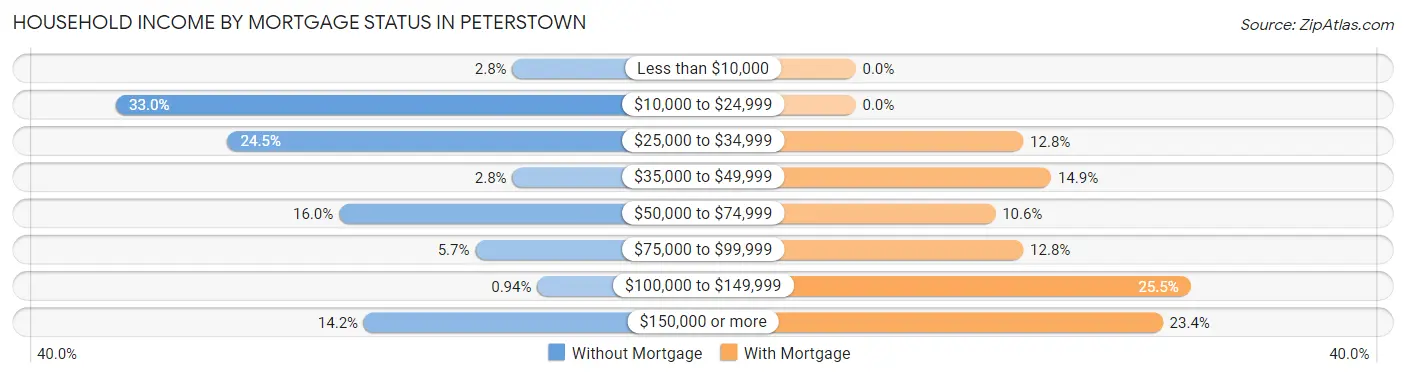
| Household Income | Without Mortgage | With Mortgage |
| Less than $10,000 | 3 (2.8%) | 0 (0.0%) |
| $10,000 to $24,999 | 35 (33.0%) | 0 (0.0%) |
| $25,000 to $34,999 | 26 (24.5%) | 6 (12.8%) |
| $35,000 to $49,999 | 3 (2.8%) | 7 (14.9%) |
| $50,000 to $74,999 | 17 (16.0%) | 5 (10.6%) |
| $75,000 to $99,999 | 6 (5.7%) | 6 (12.8%) |
| $100,000 to $149,999 | 1 (0.9%) | 12 (25.5%) |
| $150,000 or more | 15 (14.1%) | 11 (23.4%) |
| Total | 106 (100.0%) | 47 (100.0%) |
Property Value to Household Income Ratio in Peterstown
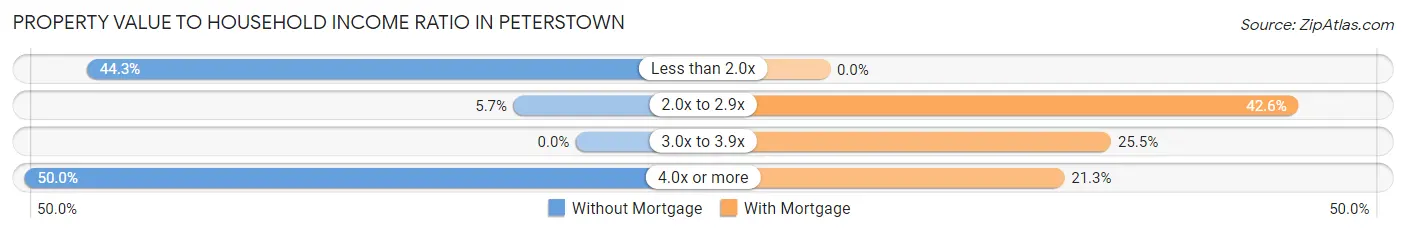
| Value-to-Income Ratio | Without Mortgage | With Mortgage |
| Less than 2.0x | 47 (44.3%) | 0 (0.0%) |
| 2.0x to 2.9x | 6 (5.7%) | 20 (42.5%) |
| 3.0x to 3.9x | 0 (0.0%) | 12 (25.5%) |
| 4.0x or more | 53 (50.0%) | 10 (21.3%) |
| Total | 106 (100.0%) | 47 (100.0%) |
Real Estate Taxes by Mortgage Status in Peterstown
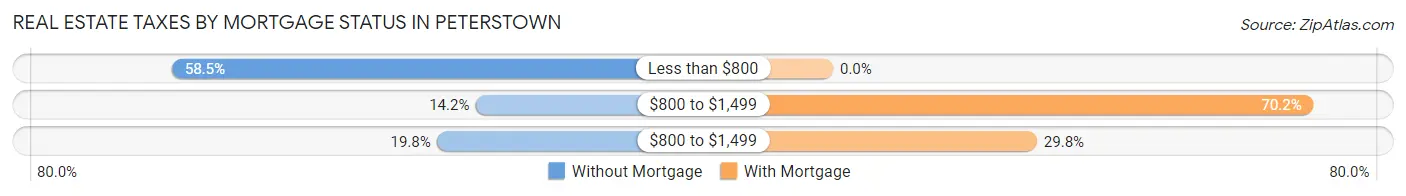
| Property Taxes | Without Mortgage | With Mortgage |
| Less than $800 | 62 (58.5%) | 0 (0.0%) |
| $800 to $1,499 | 15 (14.1%) | 33 (70.2%) |
| $800 to $1,499 | 21 (19.8%) | 14 (29.8%) |
| Total | 106 (100.0%) | 47 (100.0%) |
Health & Disability in Peterstown
Health Insurance Coverage by Age in Peterstown
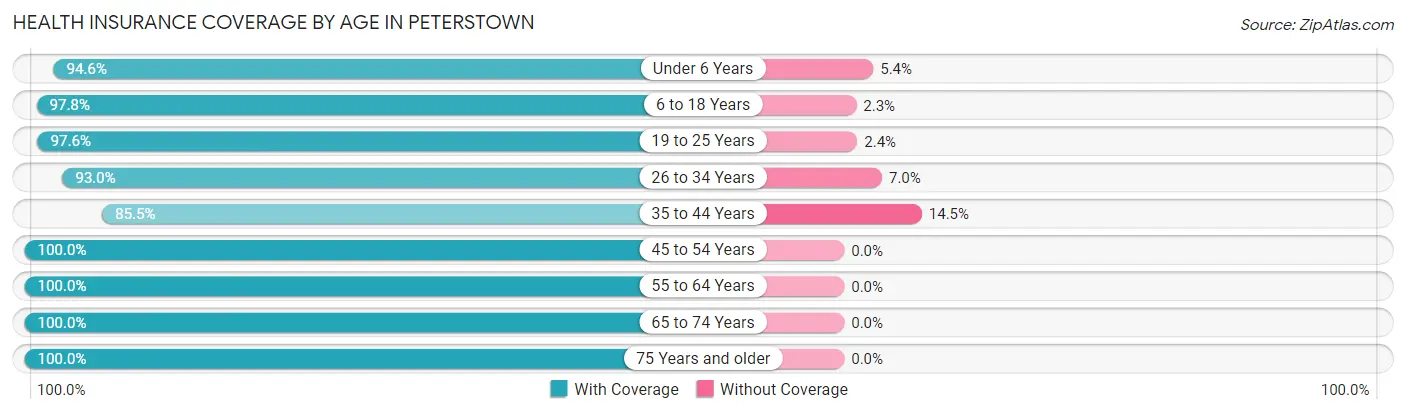
| Age Bracket | With Coverage | Without Coverage |
| Under 6 Years | 35 (94.6%) | 2 (5.4%) |
| 6 to 18 Years | 217 (97.8%) | 5 (2.2%) |
| 19 to 25 Years | 40 (97.6%) | 1 (2.4%) |
| 26 to 34 Years | 66 (93.0%) | 5 (7.0%) |
| 35 to 44 Years | 65 (85.5%) | 11 (14.5%) |
| 45 to 54 Years | 33 (100.0%) | 0 (0.0%) |
| 55 to 64 Years | 93 (100.0%) | 0 (0.0%) |
| 65 to 74 Years | 41 (100.0%) | 0 (0.0%) |
| 75 Years and older | 59 (100.0%) | 0 (0.0%) |
| Total | 649 (96.4%) | 24 (3.6%) |
Health Insurance Coverage by Citizenship Status in Peterstown
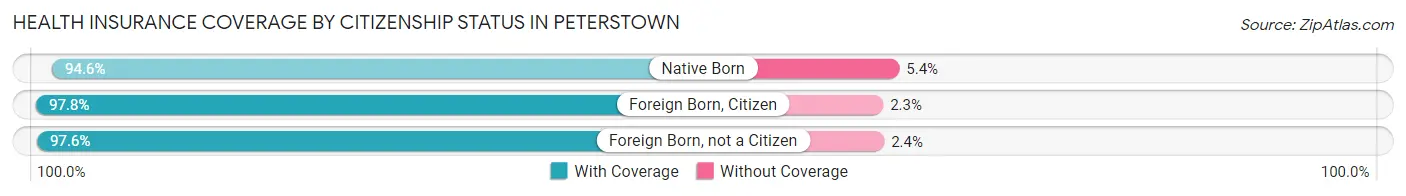
| Citizenship Status | With Coverage | Without Coverage |
| Native Born | 35 (94.6%) | 2 (5.4%) |
| Foreign Born, Citizen | 217 (97.8%) | 5 (2.2%) |
| Foreign Born, not a Citizen | 40 (97.6%) | 1 (2.4%) |
Health Insurance Coverage by Household Income in Peterstown
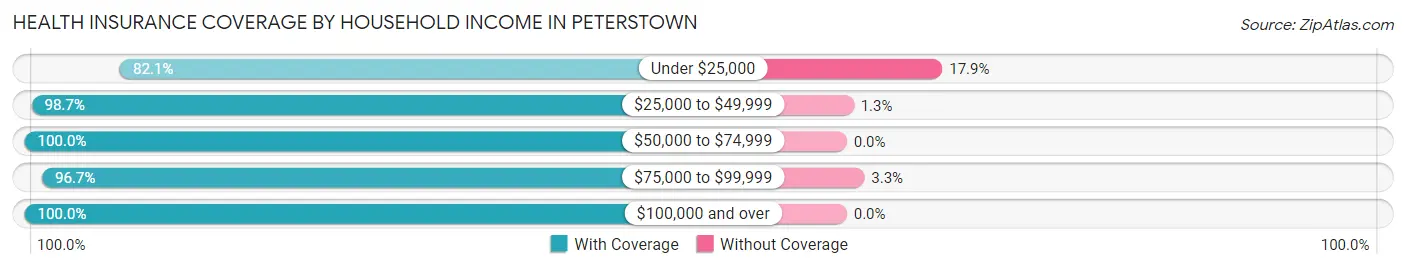
| Household Income | With Coverage | Without Coverage |
| Under $25,000 | 78 (82.1%) | 17 (17.9%) |
| $25,000 to $49,999 | 152 (98.7%) | 2 (1.3%) |
| $50,000 to $74,999 | 120 (100.0%) | 0 (0.0%) |
| $75,000 to $99,999 | 147 (96.7%) | 5 (3.3%) |
| $100,000 and over | 152 (100.0%) | 0 (0.0%) |
Public vs Private Health Insurance Coverage by Age in Peterstown
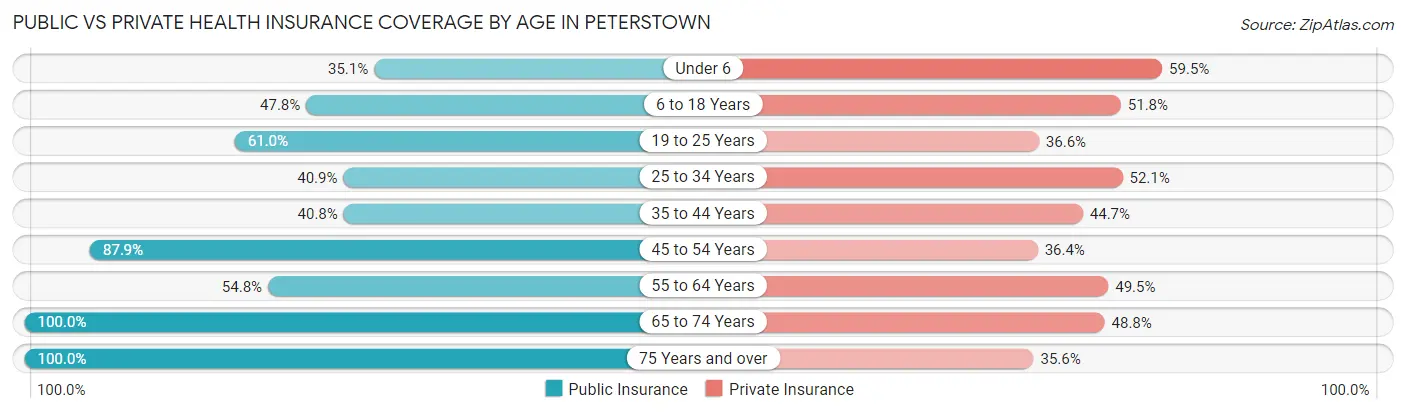
| Age Bracket | Public Insurance | Private Insurance |
| Under 6 | 13 (35.1%) | 22 (59.5%) |
| 6 to 18 Years | 106 (47.7%) | 115 (51.8%) |
| 19 to 25 Years | 25 (61.0%) | 15 (36.6%) |
| 25 to 34 Years | 29 (40.8%) | 37 (52.1%) |
| 35 to 44 Years | 31 (40.8%) | 34 (44.7%) |
| 45 to 54 Years | 29 (87.9%) | 12 (36.4%) |
| 55 to 64 Years | 51 (54.8%) | 46 (49.5%) |
| 65 to 74 Years | 41 (100.0%) | 20 (48.8%) |
| 75 Years and over | 59 (100.0%) | 21 (35.6%) |
| Total | 384 (57.1%) | 322 (47.8%) |
Disability Status by Sex by Age in Peterstown
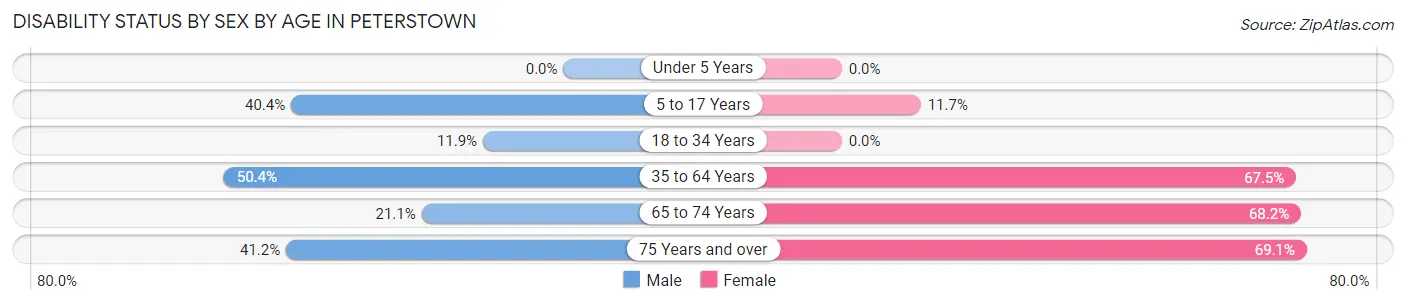
| Age Bracket | Male | Female |
| Under 5 Years | 0 (0.0%) | 0 (0.0%) |
| 5 to 17 Years | 38 (40.4%) | 15 (11.7%) |
| 18 to 34 Years | 8 (11.9%) | 0 (0.0%) |
| 35 to 64 Years | 60 (50.4%) | 56 (67.5%) |
| 65 to 74 Years | 4 (21.0%) | 15 (68.2%) |
| 75 Years and over | 7 (41.2%) | 29 (69.1%) |
Disability Class by Sex by Age in Peterstown
Disability Class: Hearing Difficulty
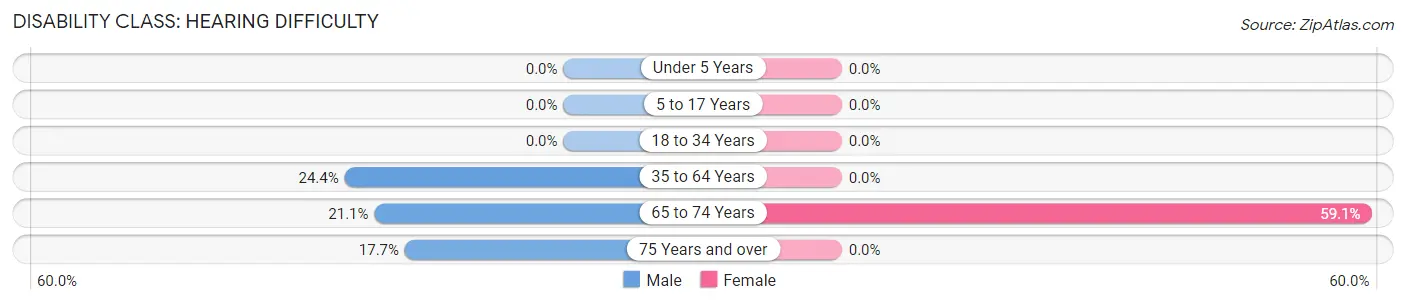
| Age Bracket | Male | Female |
| Under 5 Years | 0 (0.0%) | 0 (0.0%) |
| 5 to 17 Years | 0 (0.0%) | 0 (0.0%) |
| 18 to 34 Years | 0 (0.0%) | 0 (0.0%) |
| 35 to 64 Years | 29 (24.4%) | 0 (0.0%) |
| 65 to 74 Years | 4 (21.0%) | 13 (59.1%) |
| 75 Years and over | 3 (17.6%) | 0 (0.0%) |
Disability Class: Vision Difficulty
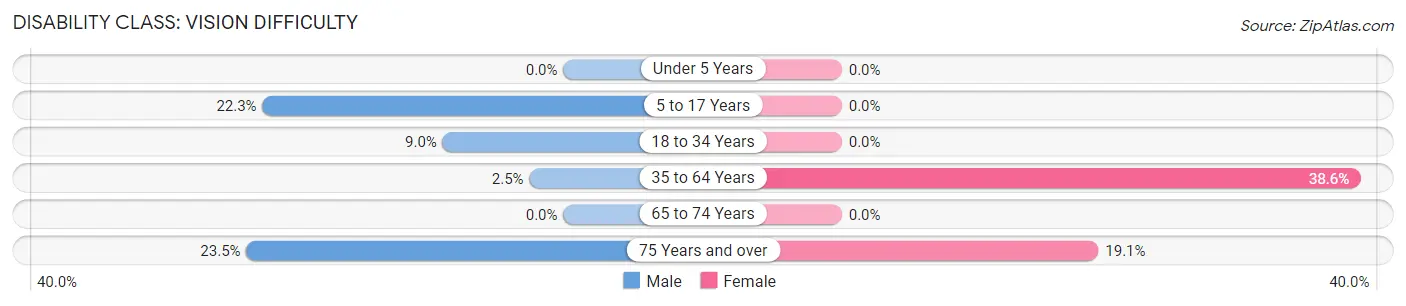
| Age Bracket | Male | Female |
| Under 5 Years | 0 (0.0%) | 0 (0.0%) |
| 5 to 17 Years | 21 (22.3%) | 0 (0.0%) |
| 18 to 34 Years | 6 (9.0%) | 0 (0.0%) |
| 35 to 64 Years | 3 (2.5%) | 32 (38.6%) |
| 65 to 74 Years | 0 (0.0%) | 0 (0.0%) |
| 75 Years and over | 4 (23.5%) | 8 (19.1%) |
Disability Class: Cognitive Difficulty
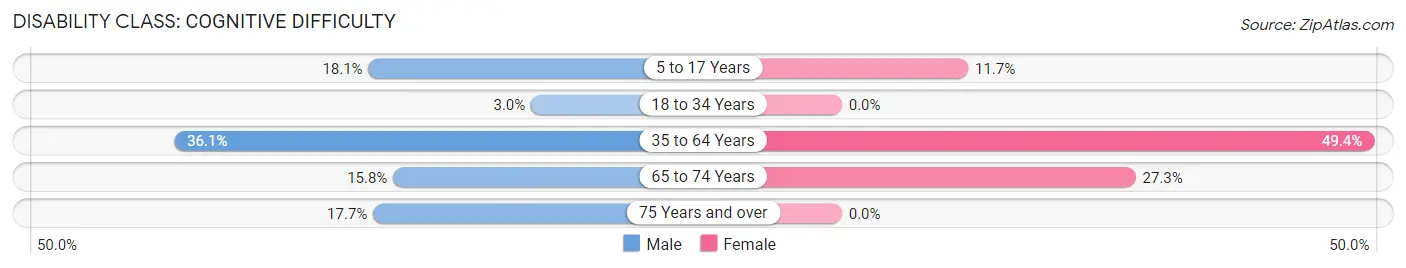
| Age Bracket | Male | Female |
| 5 to 17 Years | 17 (18.1%) | 15 (11.7%) |
| 18 to 34 Years | 2 (3.0%) | 0 (0.0%) |
| 35 to 64 Years | 43 (36.1%) | 41 (49.4%) |
| 65 to 74 Years | 3 (15.8%) | 6 (27.3%) |
| 75 Years and over | 3 (17.6%) | 0 (0.0%) |
Disability Class: Ambulatory Difficulty
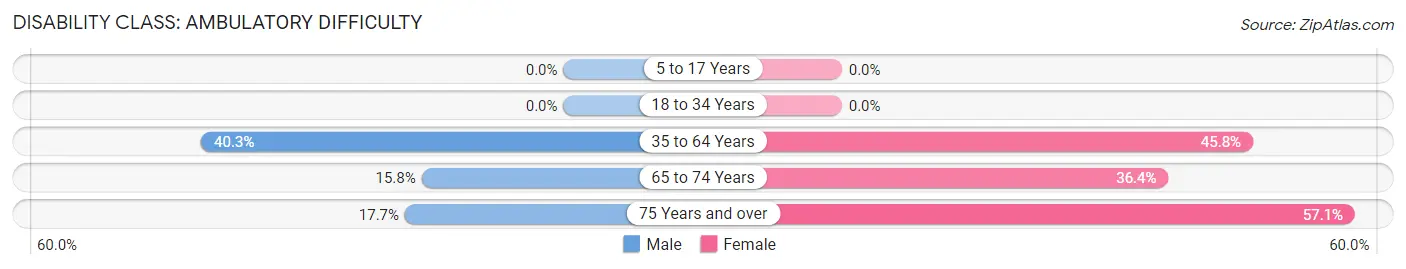
| Age Bracket | Male | Female |
| 5 to 17 Years | 0 (0.0%) | 0 (0.0%) |
| 18 to 34 Years | 0 (0.0%) | 0 (0.0%) |
| 35 to 64 Years | 48 (40.3%) | 38 (45.8%) |
| 65 to 74 Years | 3 (15.8%) | 8 (36.4%) |
| 75 Years and over | 3 (17.6%) | 24 (57.1%) |
Disability Class: Self-Care Difficulty
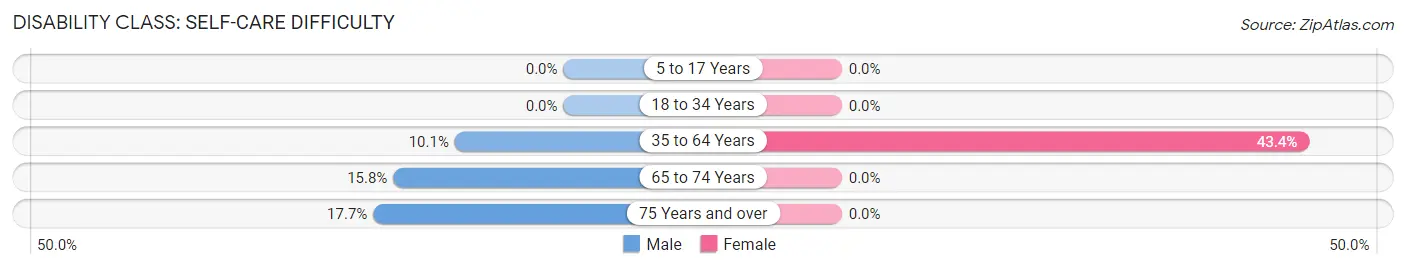
| Age Bracket | Male | Female |
| 5 to 17 Years | 0 (0.0%) | 0 (0.0%) |
| 18 to 34 Years | 0 (0.0%) | 0 (0.0%) |
| 35 to 64 Years | 12 (10.1%) | 36 (43.4%) |
| 65 to 74 Years | 3 (15.8%) | 0 (0.0%) |
| 75 Years and over | 3 (17.6%) | 0 (0.0%) |
Technology Access in Peterstown
Computing Device Access in Peterstown
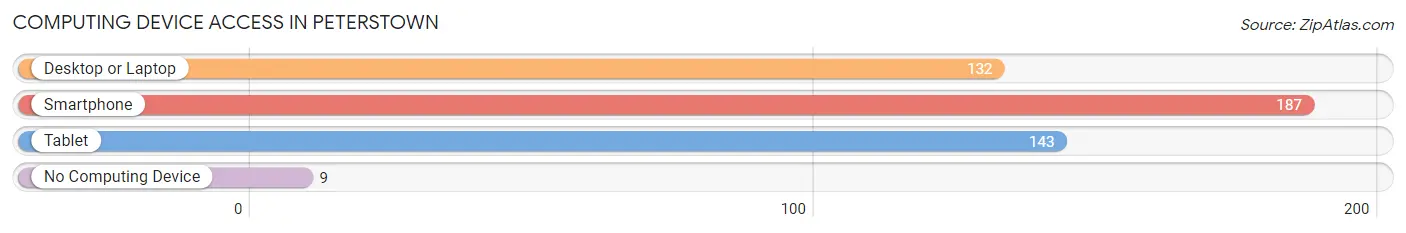
| Device Type | # Households | % Households |
| Desktop or Laptop | 132 | 64.7% |
| Smartphone | 187 | 91.7% |
| Tablet | 143 | 70.1% |
| No Computing Device | 9 | 4.4% |
| Total | 204 | 100.0% |
Internet Access in Peterstown
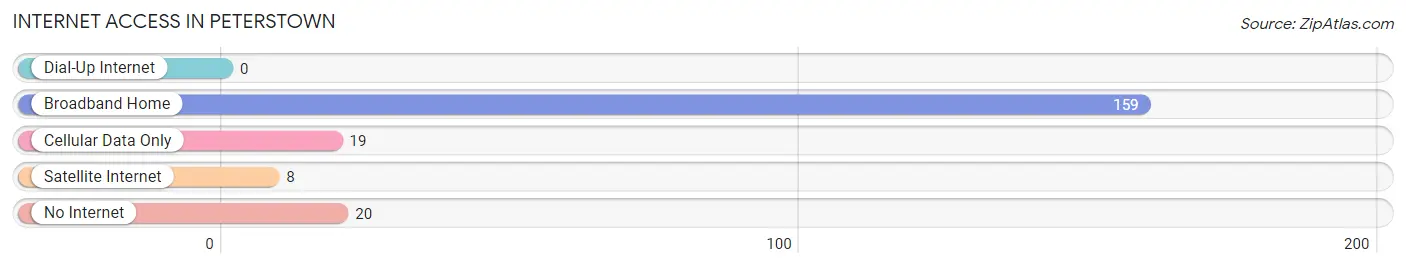
| Internet Type | # Households | % Households |
| Dial-Up Internet | 0 | 0.0% |
| Broadband Home | 159 | 77.9% |
| Cellular Data Only | 19 | 9.3% |
| Satellite Internet | 8 | 3.9% |
| No Internet | 20 | 9.8% |
| Total | 204 | 100.0% |
Peterstown Summary
Peterstown is a small town located in the southeastern corner of West Virginia, in Monroe County. It is situated on the banks of the Greenbrier River, and is part of the Greenbrier Valley region. The town has a population of approximately 1,000 people, and is the county seat of Monroe County.
History
Peterstown was founded in 1790 by Peter Ruffner, a German immigrant who had settled in the area in 1772. Ruffner had purchased the land from the local Native American tribes, and named the town after himself. The town was incorporated in 1832, and was the first town in Monroe County.
In the early 19th century, Peterstown was a thriving agricultural and industrial center. It was home to several mills, including a grist mill, a saw mill, and a woolen mill. The town also had a tannery, a blacksmith shop, and a general store.
In the late 19th century, the town began to decline as the railroad bypassed it. The town was further impacted by the Great Depression, and many of the businesses closed. However, the town was able to survive, and in the mid-20th century, it began to experience a resurgence.
Geography
Peterstown is located in the southeastern corner of West Virginia, in Monroe County. It is situated on the banks of the Greenbrier River, and is part of the Greenbrier Valley region. The town is located at an elevation of 1,890 feet, and has a total area of 0.7 square miles.
The town is surrounded by the George Washington National Forest, and is located near the Monongahela National Forest. The town is also located near the Bluestone National Scenic River, which is a popular destination for fishing, canoeing, and kayaking.
Economy
The economy of Peterstown is largely based on tourism and agriculture. The town is home to several tourist attractions, including the Peterstown Historic District, the Peterstown Museum, and the Peterstown Opera House. The town is also home to several wineries, and is a popular destination for wine tasting.
Agriculture is also an important part of the local economy. The town is home to several farms, and produces a variety of crops, including corn, soybeans, hay, and wheat. The town is also home to several livestock farms, and produces beef, pork, and poultry.
Demographics
As of the 2010 census, the population of Peterstown was 1,000. The racial makeup of the town was 97.2% White, 0.7% African American, 0.2% Native American, 0.2% Asian, 0.2% from other races, and 1.7% from two or more races. Hispanic or Latino of any race were 0.7% of the population.
The median household income in Peterstown was $30,000, and the median family income was $35,000. The per capita income was $17,000. About 17.2% of the population was below the poverty line.
Common Questions
What is the Total Population of Peterstown?
Total Population of Peterstown is 673.
What is the Total Male Population of Peterstown?
Total Male Population of Peterstown is 340.
What is the Total Female Population of Peterstown?
Total Female Population of Peterstown is 333.
What is the Ratio of Males per 100 Females in Peterstown?
There are 102.10 Males per 100 Females in Peterstown.
What is the Ratio of Females per 100 Males in Peterstown?
There are 97.94 Females per 100 Males in Peterstown.
What is the Median Population Age in Peterstown?
Median Population Age in Peterstown is 31.2 Years.
What is the Average Family Size in Peterstown
Average Family Size in Peterstown is 4.7 People.
What is the Average Household Size in Peterstown
Average Household Size in Peterstown is 3.3 People.
What is Per Capita Income in Peterstown?
Per Capita income in Peterstown is $22,833.
What is the Median Family Income in Peterstown?
Median Family Income in Peterstown is $78,750.
What is the Median Household income in Peterstown?
Median Household Income in Peterstown is $39,167.
What is Income or Wage Gap in Peterstown?
Income or Wage Gap in Peterstown is 24.8%.
Women in Peterstown earn 75.2 cents for every dollar earned by a man.
What is Inequality or Gini Index in Peterstown?
Inequality or Gini Index in Peterstown is 0.43.
How Large is the Labor Force in Peterstown?
There are 148 People in the Labor Forcein in Peterstown.
What is the Percentage of People in the Labor Force in Peterstown?
32.4% of People are in the Labor Force in Peterstown.
What is the Unemployment Rate in Peterstown?
Unemployment Rate in Peterstown is 10.8%.